#clean energy transition
Text
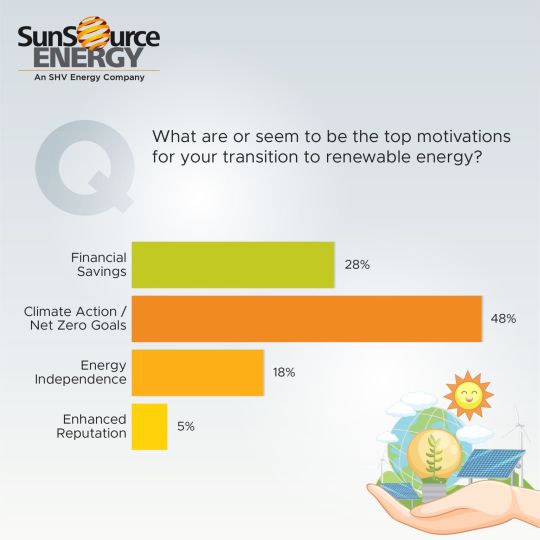
Clean Energy Transition Poll Results by Top Solar Energy Company
The results are in for last month's poll, and it's clear that sustainability is a top priority for businesses. Nearly half (48%) of you identified climate action and achieving net zero goals as the biggest motivator for switching to renewable energy. This echoes a growing trend where businesses are recognising the impact they can have on the environment and are taking proactive steps to reduce their carbon footprint.
At SunSource Energy, we understand these motivations and are here to help your business navigate a seamless transition to clean energy. We offer customised solutions that address your specific needs, whether it's cost reduction, environmental impact, or both.
Ready to join the renewable revolution? To know more on how can your energy transition be simplified, please drop us an email at [email protected]
SunSourcePoll #RenewableEnergy #ClimateAction
0 notes
Text
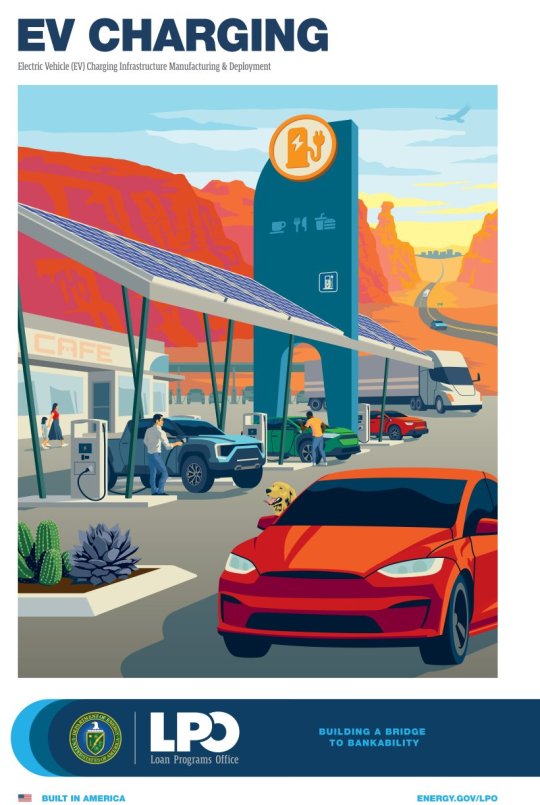
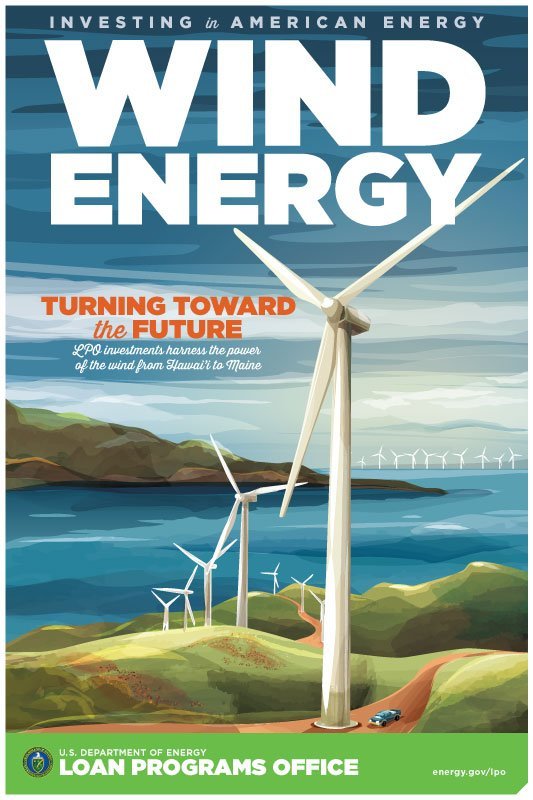

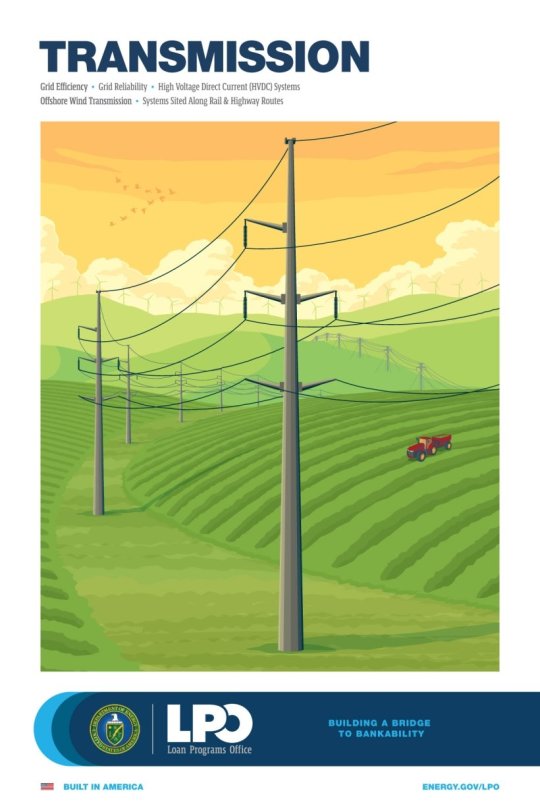
No thoughts just the DOE LPO cleantech posters
#clean energy transition#cleantech#doe#lpo#department of energy#loans program office#renewable energy#renewable energy art
0 notes
Text
The Clean Energy Transition May Be Cheaper Than We Thought
“Cost estimates leave out some of the savings of using less fossil fuels, new analysis says.”
[COMMENTARY] Let’s hope this premise becomes true!
The Clean Energy Transition May Be Cheaper Than We Thought, by Dan Gearino, January 20, 2024, Mother Jones, USA.
View On WordPress
0 notes
Text
By Robinson Meyer
Mr. Meyer is a contributing Opinion writer and the founding executive editor of Heatmap, a media company focused on climate change.
New York Times Opinion
Oct. 1, 2023
More than a year after its passage, much about President Biden’s climate law, the Inflation Reduction Act, is working.
America is putting in more solar panels than ever before, with installations expected to be up 52 percent compared with last year. The law has helped lock in America’s transition to electric vehicles. Companies have announced more than $60 billion in E.V. manufacturing investments since the I.R.A. passed, and Hyundai is rushing to finish its new E.V. factory in Georgia because the law’s incentives are so good. Across the country, investment in all forms of clean-energy manufacturing has ramped up, with spending this spring five times the level of two years ago, according to a new tracker from M.I.T. and the Rhodium Group, a research firm.
The law is supposed to do more than transform the economy, though. It’s also supposed to change how and even where Americans live. The I.R.A. contains nearly $9 billion in rebates meant to help people upgrade and decarbonize their homes — for example, install an induction stove, a heat pump or a new electrical or insulation system. Since the climate law passed last year, Mr. Biden and Democrats in Congress have hyped the savings on energy that these policies will bring to consumers; that is, after all, the inflation that the law is meant to be reducing.
But I have grown worried about these efforts — and about the next phase of the I.R.A.’s implementation more broadly. The building sector accounts for about 13 percent of America’s climate pollution, so the success of these programs is essential to the country’s decarbonization efforts. Yet more important, the execution of these programs poses a political risk for the Biden administration. These rebate and tax credit programs are some of the law’s most visible provisions. Other than the law’s electric vehicle subsidies, these home-focused policies will be most Americans’ best opportunity to get I.R.A. money in their pockets.
If the programs fail, they could seriously mar the I.R.A.’s public image. And right now, they are faltering.
Perhaps the biggest problem is inherent to their design. The most successful federal programs are simple, straightforward and easy to use. Think of the U.S. Postal Service sending free at-home Covid tests to all Americans or the relative ease of signing up for and receiving Social Security benefits. These new home-upgrade programs, meanwhile, seem likely to be especially persnickety, complicated and onerous for many Americans.
That’s because, first, there are a lot of programs in play. Although the I.R.A. streamlined some of the most important existing climate tax credits (for example, for greening the grid), it included four home-focused programs. Two of these programs are tax credits meant to give Americans a tax discount when they install a new rooftop solar system, a geothermal-powered heater, a heat pump or another technology that reduces demand for carbon-emitting fossil fuels. Unlike other tax credits in the law, these programs have no income cap, so they can be used by wealthy Americans who can presumably afford to pay upfront to install residential equipment like a water heater. But like other new tax credits in the law, they require Americans to have some federal tax liability in the first place. If you owe nothing on your taxes, then you can’t get a discount.
These credits are likely to be generous in aggregate, but in some cases they will be too small to spur a serious change of behavior. Installing a whole-home heat-pump system, for instance, can cost tens of thousands of dollars, but the I.R.A.’s new tax credit will cover only $2,000 of that in one calendar year.
That’s when another set of programs is supposed to come in. The I.R.A. introduced a pair of rebate programs meant to help working- and middle-class Americans afford to upgrade appliances and other features of their homes. These two programs, known as HOMES and HEEHRA, are important. When it’s finally put in place, HEEHRA will lower the cost of heat pumps and other climate-friendly appliances at the point of sale, making them more affordable to consumers, including those who are not even aware of the policy. More than perhaps any other programs in the law, these rebates are meant to allow low-income Americans to reduce their monthly energy costs. And because they involve direct cash grants, using the rebates will not require oweing any taxes to the federal government. That is huge for retirees and Social Security recipients, many of whom have no earned income and little to no federal tax liability.
Regardless of how consumers are reimbursed, the programs are exceedingly — perhaps even fatally — complicated. The reason they have yet to take effect is that although these programs will be overseen by the Department of Energy, they will be administered separately by each state’s energy office. The department is still finalizing the last few rules that will govern how these programs work. When it finishes that process, then states will apply for their share of the money. Only then — after states receive their funding and set up their programs — will they be able to start disbursing it to their residents.
So far, very few state offices have received any funds from the programs — not even the preliminary funds meant to help them hire more staff members and manage administration costs. This could directly hurt the programs’ chances of success in the next year. State energy offices employ anywhere from a handful of people to more than 100, and they have now been tasked with overseeing complicated, high-stakes federal programs.
The experts and business leaders I’ve talked to think that these problems will push any serious efforts to carry out the programs well into next year. Montana has said that it doesn’t expect to make rebates available until the first half of 2024. Georgia’s energy office recently estimated that rebates would become available by Sept. 30, 2024, at the latest — barely a month before the presidential election.
Even then, major questions remain about how the programs will work. Democratic lawmakers have called on the Energy Department to consider allowing the rebates to be used retroactively — meaning that someone who bought, say, a heat pump in late 2022 could get free money for it under the law. But that would sharply increase the program’s complexity, and it would more quickly deplete the limited funds allocated to the rebates. The programs draw from fixed pools of funding — about $250 million per state — and when that money runs out at the state level, the rebates will lapse in most cases.
This is not the only place where the I.R.A.’s implementation is mired in confusion. The initial rules of the home energy rebates have left state officials unsure of whether they can use someone’s eligibility for other social welfare programs, such as food stamps, to gauge whether they qualify for a rebate. (The Energy Department has published guidelines about this, but they are not comprehensive.) That may force states to set up expensive processes that will duplicate work that’s already been done and make it even more burdensome for people to use these programs. It’s also unclear whether households can use several Energy Department programs at once — such as the new HOMES rebates and the longstanding weatherization-assistance program — to reduce the cost of a major project.
Unless the Biden administration acts now, these consumer-facing programs could be a big mess by next fall. They will have confusing criteria, work differently in each state and may require applicants to go through time-sucking paperwork before receiving any funds. They will not showcase the nimble, modern government, fighting for working people, that Mr. Biden hopes to sell to voters.
Read more. (no paywall)
0 notes
Text
Carbon Capture and Sequestration (CCS) Market Insights Includes Dynamics Key Players, Demand, Products, and Application 2017 – 2032

Overview of the Carbon Capture and Sequestration (CCS) Market:
The carbon capture and sequestration (CCS) market involves technologies and processes aimed at capturing carbon dioxide (CO2) emissions from industrial and energy-related sources, transporting it, and securely storing it underground or utilizing it in other applications. CCS is a key strategy in mitigating greenhouse gas emissions and addressing climate change by reducing CO2 emissions from fossil fuel-based power plants, industrial facilities, and other high-emitting sources.
Global Carbon Capture and Sequestration Market is valued at USD 2.1 Billion in 2022 and is projected to reach a value of USD 7.49 Billion by 2030 at a CAGR (Compound Annual Growth Rate) of 19.9% over the forecast period 2023-2030.
Key Factors Driving the Carbon Capture and Sequestration (CCS) Market:
Climate Change Mitigation: CCS plays a crucial role in mitigating climate change by capturing and storing CO2 emissions from major industrial and energy-related sources. As governments, organizations, and industries commit to reducing greenhouse gas emissions, CCS offers a viable solution for decarbonizing high-emitting sectors.
Policy and Regulatory Support: Government policies and regulations that incentivize or mandate the reduction of CO2 emissions provide a significant driver for the CCS market. Financial support, tax incentives, carbon pricing mechanisms, and emissions reduction targets create a favorable environment for CCS deployment and investment.
Energy Transition and Fossil Fuel Use: CCS technology enables the continued use of fossil fuels while reducing their carbon footprint. As the world transitions to cleaner energy sources, CCS can play a vital role in mitigating emissions from fossil fuel power plants and industrial processes during the transition period.
Industrial Emissions Reduction: Industries such as cement production, steel manufacturing, and chemical processing contribute to a significant share of global CO2 emissions. CCS can help these industries reduce their emissions by capturing and storing CO2 generated during their production processes.
Enhanced Oil Recovery (EOR): CCS can be coupled with enhanced oil recovery techniques, where the captured CO2 is injected into oil reservoirs to extract additional oil. The revenue generated from EOR can provide economic incentives for implementing CCS projects.
Here's an overview of the demand and scope of the CCS market:
Demand:
Climate Change Mitigation: The primary driver of CCS demand is the urgent need to reduce carbon dioxide (CO2) emissions and limit global warming. CCS offers a way to capture CO2 emissions from industrial processes and power plants before they are released into the atmosphere.
Regulatory Pressures: Governments and international organizations are implementing stricter emissions reduction targets. CCS can help industries comply with these regulations and avoid penalties.
Emission-Intensive Sectors: Industries such as power generation, cement production, steel manufacturing, and oil and gas extraction are major sources of CO2 emissions. These sectors have a high demand for CCS technologies to lower their carbon footprint.
Transition to Clean Energy: As renewable energy sources like wind and solar power grow, CCS can complement these efforts by capturing emissions from intermittent renewable sources and providing a stable source of low-carbon energy.
Scope:
Carbon Capture Technologies: CCS involves capturing CO2 emissions from various sources such as power plants, industrial facilities, and even directly from the air. Different capture technologies, such as post-combustion capture, pre-combustion capture, and oxyfuel combustion, offer diverse solutions for different industries.
Transport and Storage: Once captured, the CO2 needs to be transported and stored safely. This involves building pipelines to transport CO2 to storage sites, often deep underground in geological formations like depleted oil and gas reservoirs or saline aquifers.
Enhanced Oil Recovery (EOR): Some CCS projects leverage the CO2 for enhanced oil recovery, a process where injected CO2 helps extract more oil from depleted wells while simultaneously storing the CO2 underground.
Policy and Incentives: Governments and organizations are providing financial incentives, subsidies, and grants to support CCS projects as part of their climate change mitigation strategies. The scope includes policy frameworks and regulatory mechanisms to encourage CCS adoption.
Research and Innovation: Ongoing research aims to improve the efficiency and affordability of CCS technologies. Innovations in materials, capture processes, and storage techniques expand the scope of CCS applications.
Global Cooperation: CCS requires international cooperation due to its potential for cross-border carbon transport and storage. Collaborative efforts between countries can enhance the effectiveness of CCS projects.
Public Perception and Education: Part of the scope involves raising awareness about CCS, addressing public concerns, and building public support for these technologies as a crucial tool in the fight against climate change.
We recommend referring our Stringent datalytics firm, industry publications, and websites that specialize in providing market reports. These sources often offer comprehensive analysis, market trends, growth forecasts, competitive landscape, and other valuable insights into this market.
By visiting our website or contacting us directly, you can explore the availability of specific reports related to this market. These reports often require a purchase or subscription, but we provide comprehensive and in-depth information that can be valuable for businesses, investors, and individuals interested in this market.
“Remember to look for recent reports to ensure you have the most current and relevant information.”
Click Here, To Get Free Sample Report: https://stringentdatalytics.com/sample-request/carbon-capture-and-sequestration-(ccs)-market/11394/
Market Segmentations:
Global Carbon Capture and Sequestration (CCS) Market: By Company
• Siemens
• Aker Solutions
• Fluor
• Mitsubishi Heavy Industries
• Halliburton
• Honeywell International
• Shell Global
• Maersk Oil
Global Carbon Capture and Sequestration (CCS) Market: By Type
• Carbon Capture
• Carbon Sequestration
Global Carbon Capture and Sequestration (CCS) Market: By Application
• Energy
• Industrial
• Agricultural
• Others
Global Carbon Capture and Sequestration (CCS) Market: Regional Analysis
The regional analysis of the global Carbon Capture and Sequestration (CCS) market provides insights into the market's performance across different regions of the world. The analysis is based on recent and future trends and includes market forecast for the prediction period. The countries covered in the regional analysis of the Carbon Capture and Sequestration (CCS) market report are as follows:
North America: The North America region includes the U.S., Canada, and Mexico. The U.S. is the largest market for Carbon Capture and Sequestration (CCS) in this region, followed by Canada and Mexico. The market growth in this region is primarily driven by the presence of key market players and the increasing demand for the product.
Europe: The Europe region includes Germany, France, U.K., Russia, Italy, Spain, Turkey, Netherlands, Switzerland, Belgium, and Rest of Europe. Germany is the largest market for Carbon Capture and Sequestration (CCS) in this region, followed by the U.K. and France. The market growth in this region is driven by the increasing demand for the product in the automotive and aerospace sectors.
Asia-Pacific: The Asia-Pacific region includes Singapore, Malaysia, Australia, Thailand, Indonesia, Philippines, China, Japan, India, South Korea, and Rest of Asia-Pacific. China is the largest market for Carbon Capture and Sequestration (CCS) in this region, followed by Japan and India. The market growth in this region is driven by the increasing adoption of the product in various end-use industries, such as automotive, aerospace, and construction.
Middle East and Africa: The Middle East and Africa region includes Saudi Arabia, U.A.E, South Africa, Egypt, Israel, and Rest of Middle East and Africa. The market growth in this region is driven by the increasing demand for the product in the aerospace and defense sectors.
South America: The South America region includes Argentina, Brazil, and Rest of South America. Brazil is the largest market for Carbon Capture and Sequestration (CCS) in this region, followed by Argentina. The market growth in this region is primarily driven by the increasing demand for the product in the automotive sector.
Click Here, To Buy Premium Report:https://stringentdatalytics.com/purchase/carbon-capture-and-sequestration-(ccs)-market/11394/?license=single
Reasons to Purchase Carbon Capture and Sequestration (CCS) Market Report:
• To gain insights into market trends and dynamics: this reports provide valuable insights into industry trends and dynamics, including market size, growth rates, and key drivers and challenges.
• To identify key players and competitors: this research reports can help businesses identify key players and competitors in their industry, including their market share, strategies, and strengths and weaknesses.
• To understand consumer behavior: this research reports can provide valuable insights into consumer behavior, including their preferences, purchasing habits, and demographics.
• To evaluate market opportunities: this research reports can help businesses evaluate market opportunities, including potential new products or services, new markets, and emerging trends.
• To make informed business decisions: this research reports provide businesses with data-driven insights that can help them make informed business decisions, including strategic planning, product development, and marketing and advertising strategies.
About US:
Stringent Datalytics offers both custom and syndicated market research reports. Custom market research reports are tailored to a specific client's needs and requirements. These reports provide unique insights into a particular industry or market segment and can help businesses make informed decisions about their strategies and operations.
Syndicated market research reports, on the other hand, are pre-existing reports that are available for purchase by multiple clients. These reports are often produced on a regular basis, such as annually or quarterly, and cover a broad range of industries and market segments. Syndicated reports provide clients with insights into industry trends, market sizes, and competitive landscapes. By offering both custom and syndicated reports, Stringent Datalytics can provide clients with a range of market research solutions that can be customized to their specific needs
Contact US:
Stringent Datalytics
Contact No - +1 346 666 6655
Email Id - [email protected]
Web - https://stringentdatalytics.com/
#Carbon Capture#Carbon Sequestration#CCS Technologies#Climate Change Mitigation#Greenhouse Gas Emissions#Carbon Dioxide Reduction#Industrial Emissions#Carbon Capture Infrastructure#CO2 Storage#Emission-Intensive Industries#Clean Energy Transition#Regulatory Compliance#Policy Frameworks#Carbon Pricing#CCS Projects#Carbon Storage Sites#Enhanced Oil Recovery#Geologic Sequestration#Carbon Transport#CCS Funding#Carbon Offset#CCS Incentives#CCS Innovation#Research and Development#Carbon Capture Efficiency#Public Perception#Global Collaboration#Carbon Market#CCS Policy#Carbon Neutrality
0 notes
Text
"Heat stored underground in caverns can be set aside in Finland’s summer months to be re-used during frigid winters thanks to a state-of-the-art ‘seasonal energy’ storage facility.
Slated for construction this summer near Helsinki, it will be the largest in the world by all standards and contain enough thermal energy to heat a medium-sized city all winter.
Thermal exchange heating systems, like those built underground, or domestic heat pumps, are seen as the most effective way available of reducing the climate-impact of home heating and cooling.
Their function relies on natural forces or energy recycling to cool down or heat up water and then using it to radiate hot or cold energy into a dwelling.
In Vantaa, Finland’s fourth largest city neighboring the capital of Helsinki, the ambitious Varanto seasonal energy storage project plans to store cheap and environmental friendly waste heat from datacenters, cooling processes, and waste-to-energy assets in underground caverns where it can be used to heat buildings via the district heating network whenever it is needed.
In Finland and other Nordic countries, the heat consumption varies significantly between seasons. Heat consumption in the summertime is only about one-tenth of the peak load consumption during the cold winter months.
Varanto will utilize underground caverns equal in space to two Maddison Square Gardens—over a million cubic meters—filled with water heated by this waste heat and pressure that will allow the water to reach temperatures of up to 300 degrees Fahrenheit without the water boiling or evaporating.
youtube
“The world is undergoing a huge energy transition. Wind and solar power have become vital technologies in the transition from fossil fuels to clean energy,” says Vantaa Energy CEO Jukka Toivonen.
“The biggest challenge of the energy transition so far has been the inability to store these intermittent forms of energy for later use. Unfortunately, small-scale storage solutions, such as batteries or accumulators, are not sufficient; large, industrial-scale storage solutions are needed. Varanto is an excellent example of this, and we are happy to set an example for the rest of the world.” ...
“Two 60-MW electric boilers will be built in conjunction with Varanto,” adds Toivonen. “These boilers will be used to produce heat from renewable electricity when electricity is abundant and cheap. Our heat-producing system will work like a hybrid car: alternating between electricity and other forms of production, depending on what is most advantageous and efficient at the time.”
... Construction of the storage facility’s entrance is expected to start in summer 2024, while it could be operational as early as 2028."
-via Good News Network, April 12, 2024. Video via VantaanEnergia, March 10, 2024
#solarpunk#heat pump#renewable energy#heating#finland#energy transition#climate change#climate hope#good news#hope#helsinki#clean energy#Youtube
365 notes
·
View notes
Text

#free congo#don't forget about the congo#tesla#glencore#cobalt#nickel#human rights abuses#allegations#mining industry#renewable energy#clean energy#environmental impact#worker mistreatment#corruption#ethical sourcing#global supply chain#corporate responsibility#renewable energy transition#accountability
189 notes
·
View notes
Text
sorry for being so angry tonight. a better world is possible, we have the engineers, the knowledge, and the power to do it. but our world is driven by a greed and hatred unlike any other, one that sucks the soul out of us all.
we can live lives filled with peace, love, and relative comfort but it's been decided for us that we can't. we can uncover the secrets of our world and universe, but we only chose to do so when it's profitable.
there are so many amazing, wonderful, beautiful people on this world. so many vibrant cultures, so much love, so many hopes and dreams. but the west takes it all. capitalism takes more than the world can provide, pushes people into poverty and slavery, all so only a few can play with us all as mere toys and have dick waving competitions.
we're turned against each other, we're told others are savage and inhuman, that they're just a number, just a percentage point. they play god, and as one that is filled with nothing but vengeance and rage. one that only seeks to punish and hoard all that there is, until there isn't anything else anymore.
we could've made such a beautiful world for ourselves by this point if a few key things had gone through, but greed and hatred was won time and time again.
my only hope is that we can finally start to push this horrid system into the fire, and we can truly start to set things right. for all its failings, i think the internet has really started to bring us together. i just want people to live and be happy. i want everyone to be able to follow their dreams and feel love. i really hope we can reach that point someday.
#sorry. again.#had one of those “oh yeah i'm alive” moments when i was writing that francis bebey thing#and it just kinda snowballed from there y'know#knowing history and how long certain concepts have been around is just so infuriating#we really could've been in such a good state by now#space based solar power beaming down nearly limitless energy by the 80s#floating sea platforms providing fresh seafood and electricity to equatorial nations#nearly carbon neutral electrical grid by this time if reagan hadn't been president#liquid salt reactors to help transition us from fossil fuels to clean energy#so many things have been possible and are currently possible to make life so much better for everyone#but instead we waste it on dozens of useless wifi satellites that'll trap us on our planet#nuclear fearmongering preventing us from weaning off of fossil fuels easily#every day i wake up hoping this chain of bad decisions and terror has been a dream#but it isn't#we have to make do with what we have and strive for a better world#we'll get there someday#my posts
7 notes
·
View notes
Note
Do u go to /went to smith? Bc I saw ur smith college problem post and it is SO ACCURATE but if you don’t go here I’m gonna have a crisis about how the fuck you know the discourse so well
i went to texas tech in lubbock texas baby. level 4000 discourse is just a parody of itself
#also unt in denton which is the hippie liberal school of texas but. the competition is not very steep. hippie liberal was mostly applied in#having a real budget allocated for transitioning to clean energy. and being big on performing arts. rather than. social issues#ask#anonymous
17 notes
·
View notes
Text
been closely inspecting my north node (virgo) the past couple days. i think i’m finally starting to understand the path i’m on….it’s in aries rn and transiting in my third house, feels eerily fitting for everything i’ve been going through lately
#third house is like. the mind thoughts interests socialization etc#aries is ‘Get It Done’ energy#been cleaning house and weirdly creative#very excited for what this transit holds for me…
3 notes
·
View notes
Video

flickr
Zimbabwes 43rd Independence Day by Lars Ling
Via Flickr:
What a great day celebrating Zimbabwe's 43rd Independence Day at the residence in Stockholm, Sweden. Attending was Honorable guests from the Swedish Gov and many African Ambassadors, Entrepreneurs and special guests. Superb cake and food. Brilliant hosting by H.E. Priscila Misihairambwi-Mushonga, Zimbabwes Ambassador to Sweden, Nordics and Baltics. THANK YOU! Check out Zimbabwes TALKING GREEN event during Stockholm +50 here: flic.kr/s/aHBqjA2Y2t The latest on Instagram: bit.ly/instagramlarsling For Clean Energy and Green Transition solutions w Financing, connect with CleanTech Region Impact Group. linktr.ee/cleantechregion Photo and video credit: Lars Ling linktr.ee/larsling Want to Do Business, Network, and meeting Investors in Silicon Valley? Join the Nordic-Baltic Impact Week! linktr.ee/nordicimpact All rights reserved (c) copyright
#Zimbabwe#43rd#Independence Day#Sweden#Nordics#Baltics#His Excellency#Priscila#Misihairambwi-Mushonga#green transition#clean energy#african#sustainability#impact#investors#stockholm +50#SDGs#flickr
5 notes
·
View notes
Text

Swedish Startup taking wind energy industry by storm.
Net-zero targets achieved.
A Swedish startup is taking the wind energy industry by storm with a revolutionary idea: wooden wind turbine towers. This innovation slashes life cycle CO2 emissions by a whopping 90% compared to the traditional towers. Not only is it eco-friendly, but the wood comes from sustainably managed forests, making it a double win for the planet. These wooden towers are lighter and easier to transport, making them ideal for remote locations. Plus, their natural beauty adds a touch of Scandinavian flair to any landscape. Join the conversation and let's celebrate this innovative leap in clean energy transition!
0 notes
Text
Hello climate-marchers, world-shakers, & changemakers! Here’s you climate headline goodness:
The Good Bright
The Good Cheer
The Good Solar
#sunny climate News#climate action now#climate News#environment#climate hope#renewable#clean energy#clean energy future#clean energy transition#solar#solarpunk#now
0 notes
Text
My practice, Virgo new moon, August '22
I associate the Virgo new moon strongly with self care and I'm already doing something Scary As Shit(TM) so I decided to spend today tending to myself. This is especially easy for me today because my partner is out of town so I have the place to myself for most of two full days.
The first thing that I did this morning was force myself to go outside and go for a walk. The heat and humidity have been extreme in the latter half of this summer which has put me off of my walk schedule. Then, when I came home, I gathered some herbs from my garden (lavender, sage, anise hyssop, and rosemary) and made myself a cleansing and protective house tea.
I lit my hearth candle, swept my downstairs, mopped with the house tea plus vinegar, and grounded my house to seal the energy. Part wy through I remember to eat so that I could take my meds.
Then, house tended to, I jumped in the shower and did a full body cleanse on my person (I like to use sugar or salt scrubs for this)
Myself tended to, I had to do something with the mound of tomatoes that my partner brought home from our farm share yesterday. So I have a pot of slow-roasted vegetable soup on the stove and some cheddar biscuits in the oven. The soup will be dinner for me tonight, maybe lunch tomorrow, and then the rest will get frozen for future fall meals.
This truly is tending to myself. I know that sometime in the next couple of months I will get overwhelmed and (often) the first executive function that I lose is my ability to cook healthy meals for myself. My partner is going to be super busy all through the fall (they are taking some classes and working), so I'll be responsible for the majority of the meals out of necessity. The more that I can set myself up to do that when I have spoons, the better off I'll be.
All of these things is a regular part of my practice but none of it is spellwork. I may do a small working later tonight to support the Scary Shit(TM) that I have to do right now but also, maybe not.
This is certainly enough if I want to let it be.
#witchblr#words#mine#personal#my practice#cottage witchcraft#house cleansing#virgo new moon#hearth craft#I don't know why I have so much energy but I am going to use it#that's a lie#the transiting Sun is conjunct my natal Mars#I am basically a cat with the zoomies today#but now my house is clean#and food smells so good#soon I will get to eat a biscuit#I made the biscuits just for me
5 notes
·
View notes
Text
Power generation from renewable energy resources plays an essential role in Europe’s transition to a decarbonized energy system.
The European State of the Climate (ESOTC) report reveals that a record 43% of actual electricity generation in Europe came from renewable sources, up from 36% in 2022. For the second consecutive year, energy generation from renewables overtook the generation from polluting fossil fuels. The largest source is biomass, which is not covered in this report. Until 2018, hydro-power was the second largest renewable energy source, but that position has now been taken by wind power. The total installed capacity of wind and solar power has been steadily increasing over the past two decades.
Renewable energy resources and electricity demand are highly sensitive to climatic conditions, which are subject to long-term trends and fluctuations on timescales ranging from days to decades. With Europe’s increasing move to renewable resources for its electricity supply, monitoring and understanding their temporal and spatial variability, and how they may be changing in a warming climate, is becoming more vital. It is important to assess how these variations affect both the demand for electricity and the potential for renewable energy generation.
This section provides an overview of actual electricity generation in Europe in 2023. It then explores the implications of climate conditions for potential power production for onshore wind power, solar photovoltaic (PV) and run-of-river hydropower, and on electricity demand. Only climate-dependent variations are taken into account; all other factors, such as variations due to improvements in the efficiency of the technology, are taken as constant. Other assumptions, such as the homogenous distribution of production units for wind and solar power across Europe, are also made. Potential power generation is represented as capacity factor (CF) – the ratio between the average power potentially delivered and the theoretical maximum power. CF ranges in value between 0, when no power is delivered, and 1, when the delivered power is equal to the theoretical maximum power of the system.
Measured electricity generation and demand in 2023
Figure 1a. Percentage of the total actual annual electricity generation from 2016 to 2023 for Europe, from solar (yellow), wind (purple) and hydro (blue) power, and other sources, including other renewables and fossil fuels (grey). Total generation in TWh is shown in Figure S1[5]. Data source: ENTSO-E and Elexon.
In 2023, electricity demand across Europe was the lowest in eight years, at around 2.6 PWh. The year saw a record share of electricity generation from renewables, at around 43%, with 17% from hydropower, 18% from wind power and 7% from solar power. Solar and wind energy tend to follow a complementary seasonal cycle: solar power generation is naturally highest during spring and summer, while wind power produces more electricity in autumn and winter.
Climate-driven electricity demand and potential for generation in 2023
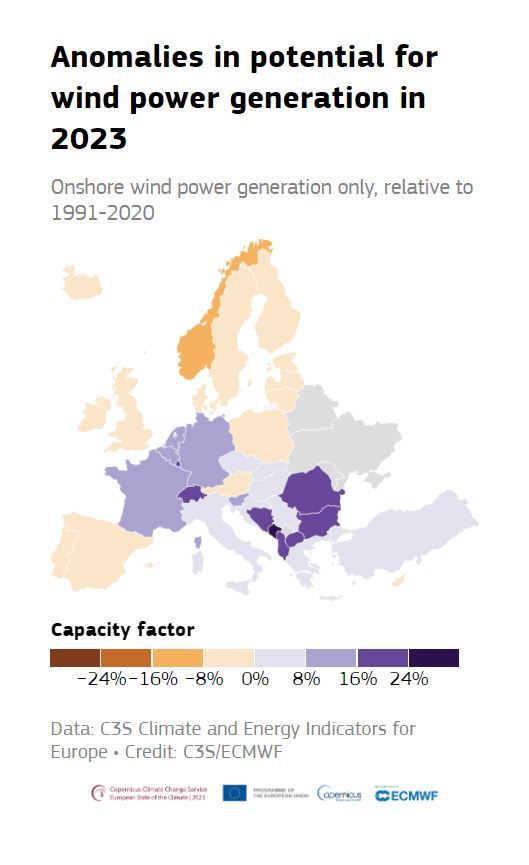
Figure 2. Anomalies (%) in potential electricity generation from three renewable sources in 2023: onshore wind capacity factor (top left), solar photovoltaic capacity factor (top right), run-of-river hydropower capacity factor (bottom left); and in climate-driven electricity demand (bottom right). All anomalies are relative to the average for the 1991–2020 reference period and expressed as a percentage of this average. Countries shaded in grey are those for which no data are available, except for solar PV for which these countries are not shown. Data source: C3S Climate and Energy Indicators for Europe.

The climate-driven electricity demand in countries in central and eastern Europe was close-to or below average for the year as a whole. This is consistent with warmer-than-average temperatures experienced across much of Europe, notably during the winter and autumn, and a corresponding reduced demand for heating. Conversely, climate-driven electricity demand was above average in parts of southern Europe, particularly Spain and Italy, and in Norway and Sweden. In southern Europe, this was largely due to high summer temperatures, leading to increased demand for cooling; in Scandinavia, it was linked to the well-below-average temperatures experienced during several months that increased the demand for heating. More on temperature conditions can be found in the ‘Temperature’ and ‘Contrasting summer’ sections.

Potential electricity generation from wind was above average in central and southeastern parts of Europe, and below average in Spain, the UK, Iceland, Fennoscandia, and parts of northeastern Europe.

Potential electricity generation from solar was below average in northwestern and central parts of Europe, and above average in southwestern and southern Europe, and Fennoscandia. Solar CF is closely related to surface solar radiation, but other technological factors also play a role. For example, while solar radiation was well above average across much of northern Europe in May and June, the potential for solar generation was not as high, as not all solar radiation is converted into power, particularly at high temperatures. Therefore, averaging across the year results in lower potential power generation from solar PV, compared to the anomalies in solar radiation.
For run-of-river hydropower, potential electricity generation was above average across much of Europe, except for Spain, Norway and Romania. This largely reflects regional anomalies in precipitation. Similarly, the month-to-month variability in hydropower CF, discussed below, reflects anomalies in monthly average river flow across the European river network.
Variability throughout the year
Potential power generation from renewable sources and climate-driven electricity demand both change throughout the year, due to variability in weather and climate. Below, June and November are discussed, to demonstrate this variability between warmer and cooler times of year.
Onshore wind power
Figure 3. Average onshore wind power capacity factor anomaly (%) for June 2023 (left) and November 2023 (right), relative to the respective monthly average for the 1991–2020 reference period and expressed as a percentage of this average. Countries shaded in grey are those for which no data are available. Data source: C3S Climate and Energy Indicators for Europe.
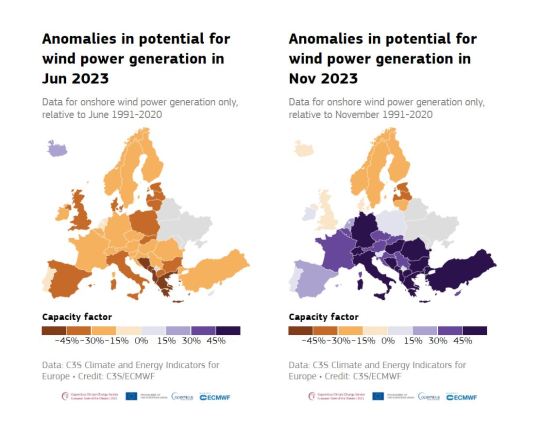
In June, wind power CF was below average across Europe, except for Iceland, with the largest anomalies observed in Serbia, Bosnia and Herzegovina, and Albania, at up to 64% below average. This reflects below-average wind speeds across all but northeastern Europe and Iceland. In contrast, November saw well-above-average wind power CF anomalies across central and southern parts of Europe, and below-average anomalies in Fennoscandia, the United Kingdom and Iceland. This is consistent with above-average wind speeds observed across most of Europe in the last three months of 2023, associated with storm activity.
Solar photovoltaic
Figure 4. Average solar photovoltaic capacity factor anomaly (%) for June 2023 (left) and November 2023 (right), relative to the respective monthly average for the 1991–2020 reference period and expressed as a percentage of this average. Countries with no data available are not shown. Data source: C3S Climate and Energy Indicators for Europe.
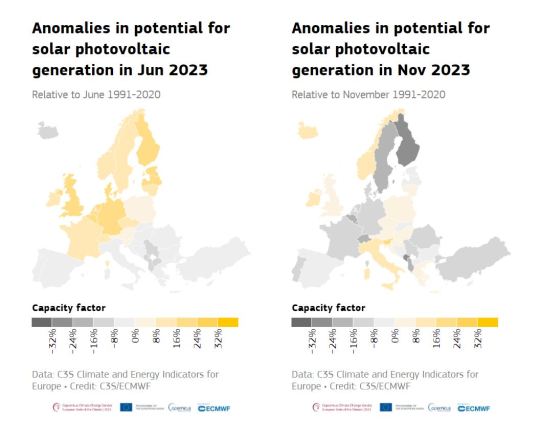
For solar PV power, June saw above-average CF across most of central and northern Europe, and below-average CF across southern Europe and Iceland. This reflects a contrast in surface solar radiation seen across Europe in June. During this month, positive surface solar radiation anomalies, of up to 70 W/m2, were seen in parts of central Europe and Scandinavia, and negative anomalies, as low as -40W/m2, in southern Europe. In November, the solar CF anomalies also corresponded to anomalies in surface solar radiation. Below-average solar radiation and solar PV CF were seen across central Europe, and particularly the Alps, and parts of southeastern Europe and eastern Scandinavia.
Run-of-river hydropower
Figure 5. Average run-of-river hydropower capacity factor anomaly (%) for June 2023 (left) and November 2023 (right), relative to the respective monthly average for the 1991-2020 reference period and expressed as a percentage of this average. Countries shaded in grey are those for which no data are available. Data source: C3S Climate and Energy Indicators for Europe.

In June, below-average run-of-river hydropower CF was seen across much of Europe, while Italy saw well-above-average run-of-river hydropower CF. This reflects positive precipitation anomalies and above-average river flows in Italy in May and June. In November, run-of-river hydropower CF was above average across most of Europe. For most areas, it was 10–20% above average, but it was as much as 57% above average in Portugal and 39% in Switzerland, associated with well-above-average precipitation anomalies and high river flow. The exceptions were Norway and Romania, where slightly-below-average run-of-river hydropower CF was observed, linked to slightly-below-average river flow. More on hydrological conditions in Europe can be found in the ‘Precipitation’ and ‘River flow’ sections.
Climate-driven electricity demand
Figure 6. Average climate-driven electricity demand anomaly (%) for June 2023 (left) and November 2023 (right), relative to the respective monthly average for the 1991–2020 reference period and expressed as a percentage of this average. Countries shaded in grey are those for which no data are available. Data source: C3S Climate and Energy Indicators for Europe.

Climate-driven electricity demand can be linked to factors such as a reduced need for heating when temperatures are warmer than average during winter, and increased need for air conditioning when temperatures are warmer than average during summer.
While the climate-driven electricity demand for the year as a whole was generally below average, it was slightly above average in June across much of western and central part of Europe. These areas correspond to those that saw above-average temperatures during June. However, warmer-than-average temperatures over Scandinavia in the same month corresponded to slightly below-average demand. Later in the year, demand over northern Europe was generally above average. From October to December, temperatures in Scandinavia were much colder than average, reflected in well-above-average demand. In November, however, southern Europe saw below-average demand associated with above-average temperatures for the time of year.
Changes in energy statistics through 2023
While climate conditions can drive demand for additional energy, to some extent they can also compensate through increased potential to generate power. For example, in summer, demand can be higher, but this can be balanced out by additional solar power generation.
Comparison of energy statistics aggregated over a region can highlight links and compensation between climate-driven electricity demand and renewable power resources at a larger geographical scale than that of individual countries[8]. Here, statistics are reported for a region of central Europe, defined here as France, Belgium, Luxembourg, the Netherlands, Germany and Switzerland. These countries are chosen because of their relatively similar climatic conditions in 2023.
Figure 7. Changes in energy statistics for run-of-river hydro-power capacity factor (CF), solar photovoltaic CF, onshore wind CF and anomalies in climate-driven electricity demand for each day in 2023. The daily average CF for the 1991–2020 reference period is indicated by the dashed grey line. Climate-driven electricity demand is expressed as a percentage of the 1991–2020 reference period. Values are averaged across a region of central Europe (here defined as France, Belgium, Luxembourg, the Netherlands, Germany and Switzerland). Data source: C3S Climate and Energy Indicators for Europe.
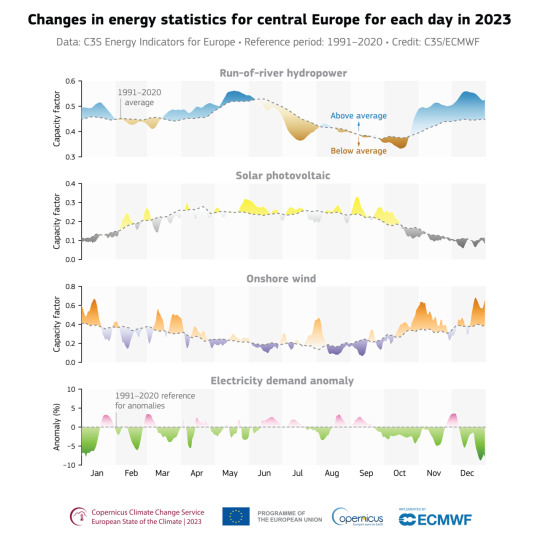
Averaged across six central European countries, the climate-driven electricity demand was below average for most of the year. January, February, October and December saw the largest negative anomalies, with daily values reaching around 7–9% below average in January and December. The lower demand reflected the higher-than-average temperatures during these months and the associated reduced demand for heating. Apart from two weeks in late November and early December, demand was persistently below average from late September until the end of the year.
Climate-driven electricity demand was most above average at the end of January, and in early March, late August, and early December; up to around 3.5% above average during all these periods. The two longest periods of above-average demand were early June to mid-July and mid-August to mid-September. These periods coincided with above-average summer temperatures and the associated demand for air conditioning.
Solar PV CF was above average during several periods in February, May, September and October. September saw the largest positive monthly anomaly, of 18% above average, with daily CF values reaching around 0.3. The increased solar PV CF in September partially compensated for the higher electricity demand.
Onshore wind CF was variable during 2023, but generally above average. There was a long period of above-average CF throughout October and November, which saw daily CF values peaking at around 0.65. November also saw the largest monthly onshore wind CF anomalies, at around 45% above average for the month as a whole. This increase in onshore wind CF was associated with storm activity across much of Europe. February, June and a period from mid-August to the beginning of October saw below-average onshore wind CF, except for a short period of slightly above average anomalies in mid-September. November’s storms continued into December; the associated above-average precipitation and river flow led to above average run-of-river hydropower CF during these two months. At its peak, it reached almost 20% above average, after being close to average for much of the year. July was the only month that saw below-average hydropower CF; as much as 12% below average for the month as a whole.

Monitoring wind, solar , and hydropower is crucial for optimizing the potential for renewable energy generation. Accurate climate monitoring supports strategies to accelerate the transition to sustainable energy sources, fostering both environmental protection and economic growth.
#climate-driven electricity demand#clean energy#capacity factor (CF)#potential power production#onshore wind power#solar photovoltaic (PV)#run-of-river hydropower#and on electricity demand.#energy transition#renewable energy sources#energy sources
0 notes
Text
Pass legislation to significantly expand transmission for clean energy NOW!
AN OPEN LETTER to THE PRESIDENT & U.S. CONGRESS
820 so far! Help us get to 1,000 signers!
Right now, there are at least 2,000 gigawatts of renewable energy waiting for permission to connect to power lines in the U.S., which is more than the total capacity of the country’s existing power plants. Wait times to connect new power plants to the grid can reach five years or more. Without rapidly improving transmission, the United States will not be able to achieve Biden's goal of 100% clean energy by 2035 or provide cheaper, more reliable electricity to American households. If the U.S. can’t build new transmission at a faster pace, roughly 80 percent of the emissions reductions expected from the Inflation Reduction Act–the largest climate legislation in U.S. history–might not happen.
That’s why I’m writing to urge Congress to pass legislation to significantly expand transmission for clean energy.
Multiple efforts are currently in play. Most recently in the House, Representatives Sean Casten and Mike Levin introduced the Clean Energy and Transmission Acceleration Act, (HR 6747) which would encourage the development of new transmission lines to carry renewable power where it’s needed while protecting the rights of communities to provide input on where lines are built and to benefit from their construction. I strongly support this bill.
But any legislation is better than none, and NONE of the bills proposed so far have been passed. This is not good.
Increasing access to clean energy will help tackle the climate crisis by ensuring the reliability of the grid and reducing consumers' bills. Renewable energies like wind and solar are quickly becoming the least expensive source of energy and we need to make sure as many people as possible get access to these clean, abundant energy sources.
Please pass a strong, fair transmission bill—like HR 6747—that prioritizes clean energy, climate change, and environmental justice. This is urgent; all of our children are counting on us to secure their futures. Thanks.
▶ Created on April 23 by Jess Craven · 819 signers in the past 7 days
📱 Text SIGN PMNVSR to 50409
🤯 Liked it? Text FOLLOW JESSCRAVEN101 to 50409
#JESSCRAVEN101#PMNVSR#resistbot#Clean Energy#Renewable Energy#Climate Action#Transmission Expansion#Green Energy#Clean Energy Now#Climate Change#Energy Infrastructure#Renewables#Climate Crisis#Energy Policy#Infrastructure Bill#Green Grid#Renewable Power#Energy Transition#Climate Legislation#Sustainable Energy#Clean Tech#Electric Grid#Energy Security#Energy Equity#Renewable Future#Grid Modernization#Climate Justice#Energy Innovation#Renewable Resources#Energy Efficiency
0 notes
Last Seen Blogs