#NOAA Climate Prediction Center
Text
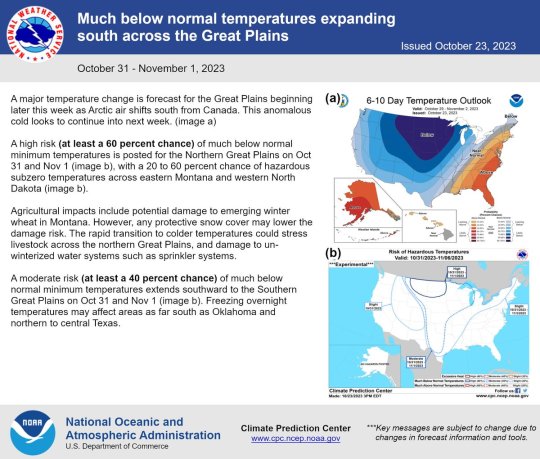
"An Arctic air mass shifts south from Canada through the Great Plains beginning later this week. Hazardous cold temperatures could impact agricultural interests. Locations as far south as Texas may reach freezing. " - NOAA NWS Climate Prediction Center
0 notes
Text
NWS: Cold and dry weather favored over the next 6-10 days
New Post has been published on https://aroundfortwayne.com/news/2022/10/12/nws-cold-and-dry-weather-favored-over-the-next-6-10-days/
NWS: Cold and dry weather favored over the next 6-10 days

The latest NOAA Climate Prediction Center outlook for the next 6 to 10 days.
#Fort Wayne Indiana#National Weather Service Northern Indiana#NOAA Climate Prediction Center#NOAA Climate Prediction Center outlook#weather story
0 notes
Text
Tornado Quest Top Science Links For December 30, 2023 - January 6, 2024 #science #weather #tornado #climate #climatechange #wintersafety #windchill #droughtmonitor #astronomy
Happy New Year everyone and thanks for stopping by. This week, we’ll continue our look at winter weather safety and the latest US Drought Monitor. There are several other interesting reads for the new year, so let’s get started.
On 8 April 2024, a solar eclipse will take place that, for many parts of North America, will be like nothing you’ve ever seen before.
While on the topic of astronomy,…

View On WordPress
#2023#accuweather#astronomy#climate#climate change#climatology#drought monitor#environment#forecast model#hail#high winds#meteorology#NOAA#science#severe weather#solar eclipse#spc#storm prediction center#tornado#tornado activity#tornado climatology#tornado patterns#us drought monitor#weather#weather forecasting#wind chill#wind chill chart#wind chill safety#winter safety#winter weather safety
1 note
·
View note
Photo

Higher and lower than average weekend temperatures in the US
by u/makella_
Map made with Felt using data from NOAA's Climate Prediction Center. Analysis done in QGIS. Link to online map here
67 notes
·
View notes
Text
"A parade of atmospheric river-fueled winter storms in California and other western states has erased the most extreme drought conditions for the first time since 2020 and more water is on the way, forecasters predict.
The U.S. Drought Monitor's latest conditions report shows no part of California is in the Extreme or Exceptional Drought designations that blanketed most of the state last summer.
Most of the central portion of the state is completely free of drought conditions from the latest readings on March 14. Parts of Northern and Southern California are still showing Abnormally Dry or Moderate Drought on the scale, while Moderate Drought conditions are still in place in parts of Siskiyou, Lassen, Modoc, Inyo and San Bernardino counties .

Record snowfall and rain have helped to loosen drought's grip on parts of the western U.S. as national forecasters and climate experts warned Thursday that some areas should expect more flooding as the snow begins to melt...
Jon Gottschalck, chief of the operational prediction branch at NOAA's Climate Prediction Center, said the start of the fire season in the Southwestern U.S. likely will be delayed."
-via CBS News, 3/16/23
And an update from 3/30/23
50% of California is now out of drought completely!
Couldn't find an article about this that didn't have a picture of drastic flooding, rip.
"Drought conditions across California continue to retreat thanks to heavy rain and historic snowfall that has battered the Golden State since late last year.
Data from the U.S. Drought Monitor released on Thursday shows that more than 50% of California is free of any drought classification for the first time since February 2020...
In November, virtually all of California’s Central Valley was deemed to be in an “exceptional drought,” the U.S. Drought Monitor’s worst classification.
As of [March 30th], California’s entire coastline was drought-free and only a small section of the Central Valley was considered “abnormally dry.” More significant drought conditions still exist in the northeastern and southeastern areas of the state...
California’s Sierra Nevada mountains are seeing record snowpack that will eventually melt and fill the state’s reservoirs. On Wednesday, Mammoth Mountain ski resort announced it had set a new all-time snowfall record."
-via KTLA, 3/30/23
#california#united states#drought#california drought#snowpack#mammoth#sierra nevada mountains#water reservoir#water conservation#rain#good news#hope
108 notes
·
View notes
Text
Monday was the world's hottest day on record, exceeding an average of 17ºC (62.6ºF) for the first time, according to initial measurements taken on Tuesday by US meteorologists. The average daily air temperature on the planet's surface on July 3 was logged at 17.01ºC by an organization attached to the US National Oceanic and Atmospheric Administration (NOAA).
This measurement surpasses the previous daily record (16.92ºC) set on July 24 last year, according to data from NOAA's National Centers for Environmental Prediction going back to 1979. The world's average air temperature, which fluctuates between around 12ºC and just under 17ºC on any given day over the year, averaged 16.2ºC at the beginning of July between 1979 and 2000.
The record has yet to be corroborated by other measurements, but could soon be broken as the northern hemisphere's summer begins. The average global temperature typically continues to rise until the end of July or beginning of August. Even last month, average global temperatures were the warmest the European Union's Copernicus climate monitoring unit had ever recorded for the start of June.
Temperatures are likely to rise even further above historical averages over the next year with the onset of an El Niño weather phenomenon in the Pacific Ocean, which the World Meteorological Organization confirmed on Monday is now underway. In addition, human activity—mainly the burning of fossil fuels—is continuing to emit roughly 40 billion metric tons of planet-warming CO₂ into the atmosphere every year.
[phys.org]
[h/t Robert Scott Horton]
21 notes
·
View notes

Photo

The Climate Prediction Center (CPC) is tasked with long-term, seasonal forecasting for the United States. Their latest outlook from November has a few nuggets about the upcoming Spring. First, let’s look at the text:
“below normal precipitation is favored over
parts of the Northwest and Northern Plains, as well as in the Southern Plains
from spring 2024 through early fall 2024.”
Then, let’s take a look at the graphic above.
The top illustration is the precipitation for March-May, showing a belt of above-normal precip from the Southeast back into the Plains.
That area shrinks and moves away from the Plains for April-June (bottom-left) before being replaced by an area of below-normal precipitation over parts of the Southern Plains in the May – July outlook (bottom-right).
Taken as a whole, it does seem like the CPC is expecting a drier-than-normal back half of the Spring over the heart of the traditional alley, but things could be busy early across the Southeast and back into the Southern Plains. This would match some past El Niño springs that had rapid and wild starts and tepid, quiet back halves. 2007 immediately comes to mind as one example of this.
However, seasonal forecasting is an imperfect science. Regardless, speculation is what storm chasers do this time of year.
2 notes
·
View notes
Text

A close-up, on-the-ground view of Europe's next-generation satellites
Journalists have been given a up-close view of two very special spacecraft that will soon empower weather services in Europe with more and higher quality data for weather forecasting.
Metop Second Generation A1 and B1 (Metop-SGA1 and Metop-SGB1) are the first pair of a total of six satellites in the EUMETSAT Polar System—Second Generation (EPS-SG) system.
The first two satellites are undergoing testing and integration of their instruments at the Airbus Defense and Space cleanroom in Toulouse, France. It is anticipated they will be launched in 2025–2026 into their low-Earth, polar orbit, at about 835km altitude.
"The multi-billion euro EPS-SG system will be the main source of data for complex computer modeling used for advanced weather forecasting from 12 hours to 10 days ahead," EUMETSAT's EPS-SG Program Manager Fran Martinez Fadrique said.
"Its new and next-generation instruments will provide more and better data for weather and climate services in Europe until at least the mid-2040s. Studies show they will generate an estimated socio-economic return of 20:1 on our member states' investment through significantly improved weather predictions."
The data from the first-generation Metop satellites have been the single biggest contributor to accuracy of weather forecasts 12 hours to 10 days in advance. The second-generation Metop satellites will provide more, and higher resolution, data, EUMETSAT's EPS-SG Program Scientist Dr. Rosemary Munro said.
"This system, together with the third generation of our geostationary Meteosat satellites, the first of which was launched less than a year ago, will enable a new era of weather forecasting in Europe," Munro said.
"Most importantly, we know the benefits of this crucial space infrastructure will be felt by the citizens in our member states through more accurate and timely weather forecasts which will help save lives and livelihoods.
"The data from this system has many uses beyond weather forecasting. From monitoring wildfires and plumes of volcanic ash, from aiding maritime safety to helping to predict droughts through to monitoring the hole in the ozone layer, these satellites will provide a wealth of data about the Earth system.
"Additionally, the Metop-SGA satellites will carry the European Union's Copernicus Sentinel-5 instrument, which will aid monitoring and prediction of air pollution."
Martinez Fadrique said the EPS-SG system represents a new chapter in an established European success story that has resulted in Europe being a world leader in satellite meteorology.
"This success was possible because of the model of cooperation between EUMETSAT and the European Space Agency (ESA), harnessing European scientific and industrial expertise and the commitment of European industry," he said.
"The requirements for the new satellites are defined by EUMETSAT through consultation with scientists and users of their data, primarily the national meteorological and hydrological services of our 30 member states and the European Center for Medium-Range Weather Forecasts.
"ESA then procures the spacecraft to meet those requirements. These Metop-SG satellites have been developed under ESA contract by a European industrial consortium led by Airbus Defense and Space.
"To operate these spacecraft, and our existing satellites, and to receive, process, disseminate and archive the vastly increased amount of data produced by their instruments, EUMETSAT has developed sophisticated ground systems in high-tech mission control centers at its Darmstadt headquarters."
The EPS-SG system is part of the European-United States' Joint Polar System. Under this arrangement, data from EUMETSAT's and the United States National Oceanic and Atmospheric Administration's (NOAA) polar-orbiting satellites are shared, bringing benefits to weather forecasting and climate monitoring to both sides.
IMAGE....Two Metop-SG satellites: Metop-SGB in the forefront and Metop-SGA in the back, in the Airbus cleanroom. Credit: European Organisation for the Exploitation of Meteorological Satellites (EUMETSAT)
2 notes
·
View notes
Text
A leading expert on Hurricanes on Tuesday declined to draw a connection between the intensity of Hurricane Ian, which is bearing down on the Florida Gulf Coast, and climate change when pressed by CNN anchor Don Lemon.
“Can you tell us what this is and what effect climate change is having on this phenomenon?” Lemon asked Jamie Rohme, the acting director of the NOAA Hurricane Center during Lemon’s prime-time program on CNN.
Lemon pressed Rohme, asking him again “what effect climate change has on this phenomenon, because it seems these storms are intensifying.”
“I don’t think you can link climate change to any one event,” the hurricane expert responded. “On the whole on the cumulative, climate change may be making storms worse, but to link it to any one event, I would caution against that.”
“We can come back and talk about climate change at a later time, I want to talk about the here and now,” Rohme said before providing an analysis of the storm’s development and projected path.
Recent studies have shown that climate change is producing more rain in Hurricanes and expanding their reach further north.
A study, published in April in the journal Nature Communications, found that human-caused climate change led to a 5 percent increase in rainfall in all named storms and an 8 percent increase in rainfall during hurricane-strength storms.
Another study published in 2020 showed that climate change is contributing to increased power in hurricanes, making them more likely to cause more damage.
Ian was upgraded to a Category 4 storm overnight ahead of its expected landfall on Florida’s west coast with areas from Englewood to Bonita Beach and Charlotte Harbor expected to experience a predicted 12 feet to 18 feet of storm surge.
“Listen, I grew up there and these storms are intensifying, something is causing them to intensify,” Lemon said in response to Rohme’s comments.
17 notes
·
View notes
Text

Traveling to the American Southwest this week: be prepared for slowdowns and delays
"An Atmospheric River Event Likely to Impact the West Coast next Week with Heavy Precipitation and High Winds"
- NOAA Climate Prediction Center
#NOAA#Climate Prediction Center#chattanooga weather#tennessee river valley#wdef.com/weather#chief meteorologist austen onek#[email protected]#wdef-tv#wdef chattanooga#wdef#wdef news 12
0 notes
Text
With forecasters at NOAA's Climate Prediction Center (a division of the National Weather Service) predicting above-average hurricane activity this year, a paper published in the peer review magazine Oceanography shows that robotic ocean observing platforms can improve intensity forecasts for hurricanes and tropical storms and should be supported as a crucial component of the ocean infrastructure designed to protect the lives of coastal residents and mitigate the economic impact from storms.
The Atlantic hurricane season, which officially begins today, is expected to bring 14-21 named storms, including 3 to 6 major hurricanes with winds of 111 mph or higher.
In the U.S., hurricanes have caused more than $1 trillion in losses since 1980, and while the landfall forecasts that drive evacuation orders and guide coastal preparations ahead of storms have been steadily improving, storm strength forecasting has lagged. Storm intensity is influenced by many factors, including atmospheric circulation, internal storm dynamics and air-sea interactions, as well as boundary currents—for instance, the Loop Current in the Gulf of Mexico—and even seafloor topography.
12 notes
·
View notes
Text
Tornado Quest Top Science Links For December 23 - 30, 2023 #science #weather #climate #climatechange #wintersafety #windchill #droughtmonitor
Greetings everyone and thanks for stopping by. As 2023 wraps up, we’ll review the climate data on 2023, winter weather safety, and the US Drought Monitor. I hope everyone has a safe and happy New Year holiday.
ICYMI: As 2023 comes to an end, it’s become very clear through solid scientific data that it was our planet’s hottest year on record.
There was plenty of climate news in 2023, but was it…

View On WordPress
#2023#climate#climate change#climate crisis#climate emergency#climatology#environment#hai#hail#meteorology#NOAA#science#severe weather#severe weather climatology#storm prediction center#tornado#weather#wind#wind chill#wind chill chart#wind chill safety#winter#winter weather preparedness#winter weather safety
0 notes
Text
2024 Texas Hurricane Season Predictions
2024 Texas Hurricane Season Predictions
Predictions Show a Very Active Hurricane Season
Texans well know about the damaging high winds and flash flooding from tropical storms. This year's TX hurricane predictions show a very active season. Learn why this season could be one of the toughest.
Apart from hot summers, one thing Texans know all too well about is hurricane season. Flooded streets, damaged roofs, and your Texas electricity is out. Towns hit hard in the past like Rockport, Port Arthur, Houston and others shudder when skies darken over the Gulf of Mexico. This season's hurricane predictions look like it could be another tough one.
Officially, the Atlantic hurricane season begins on June 1 and runs through the end of November. But due to the potential for global economic disruptions from these powerful storm systems, everyone wants to know how to prepare well in advance.
AccuWeather's March 27 forecast warns of an "explosive season" where forecasters may even run out of names.
Tropical Storm Risk (TSR), which makes forecasts in December, released their updated prediction on April 8.
Colorado State University researchers released their annual hurricane forecast on April 8, also.
NOAA's Climate Prediction Center (CPC) usually releases forecasts in late May.
Given this past year's record warm temperatures and a La Niña expected to emerge in the Pacific Ocean, these weather services now expect "a very active" hurricane season ahead.
Are Hurricane Predictions Accurate?
Bear in mind that storm predictions are based on the probability for the environment to spin up tropical storms. So, predicted storm numbers are not iron-clad. But while some year's predict too many; in the past 30 years, we're seeing predictions fall short. For example, the 2023 hurricane season forecast only 13 tropical storms. But due exceptional warm sea surface temperatures, there were 20 and it became the fourth most active season on record. Dire-sounding, true but of the 20 tropical storms that formed, only three made landfall in North America. Several stayed at sea and disipated as they wandered north.
However, there have been more extremely active hurricane seasons since 1995 than there has been since 1900. And two of the most active seasons occurred in 2005 with 28 storms and 2020 with 30 -- eleven of which made landfall in the US causing $37 billion in damage.
With all that in mind, the 23 tropical storms predicted this year is twice as many tropical storms that occur during a statistically "normal" season. And this makes the consensus for the potential number of storms compelling. As we'll see, conditions going into the 2024 season have more in common with 2020 than last year.
Why So Many Storms?
Tropical storm systems need three things to spin up:
LOTS of calm, warm water. Sea surface temperatures (SSTs) at least 80°F (26.5°C) to a depth of about 150 feet.
Dry, thirsty air. When a firm, dry trade wind blows across warm sea water (at about 11 mph), it has an easy time evaporating that water and taking on its heat. As this warm, humid air begins to move upwards and organize, it can quickly develop into a moist and unstable atmosphere that supports sustained shower and thunderstorm activity.
A nice, calm upper atmosphere. Tropical storms like winds that move horizontally and spiral up in nice, stacked layers (stack of pancakes). Vertical winds that cut or shear across that horizontal structure can tear it apart. Wind shearing happens everywhere but as long as it's about 23 mph from the ocean surface all the way up to around 60,000 feet, the tropical storm will be fine.
The ENSO (El Niño/Southern Oscillation) also plays a role. To be clear, El Niño, ENSO Neutral, and La Niña don’t prevent or cause hurricanes. Rather, it is an ocean-atmosphere system at the equator in the Pacific Ocean that can shift atmosphere's circulation (called the "Walker Circulation"). El Niños usually produce wind shears in the Atlantic that blow apart tropical storms or shift them to the middle of Atlantic (as we saw in 2023). ENSO Neutral and La Niñas, however, shift those wind-shear patterns far to the east, leaving a nice, calm upper atmosphere over the Atlantic where tropical storms develop.
Current Conditions
This past February saw record global temperatures, especially in the Atlantic Ocean. Currently, sea surface temperatures remain warm. In fact, there's a band of 80°F (26.5°C) water stretching all way from west Africa to the west coast of Cuba. All three hurricane predictions cite warmer than normal SSTs as a reason for more storms. And given NOAA's temperature predictions for the summer, it looks like much of the US Atlantic coast will stay like bathwater. That may sound like good news for beach goers (and sharks) but it's also perfect for building tropical storms.
There is a lot of dry air coming off the African west coast. Actually, too much right now. The Saharan Air Layer (SAL) lies about 5,000 and 20,000 feet up in the sky that transports plumes of dry, dust-laden air from west Africa to as far west as Texas. It usually forms in the late spring/early summer when hot dry winds blow across the Sahara desert and move over the Atlantic Ocean. As result the SAL can impede tropical storm formation:
Big dust plumes can warm the atmosphere but block sunlight from warming the ocean surface below. That reduces evaporation.
The dry air can create down drafts or sinking air. These can interfere with moist air rising and organizing into low pressure systems.
SAL winds are strong enough to carry dust. So, their winds can also produce vertical wind shears that blow out storm formation.
Although the SAL begins in the spring it don't blow all summer long. All the same, in both 2022 and 2023, the SAL helped keep a lid on storm formation for about 2 months. The pattern peaks in June and fades in early August. Each plume usually last 3 to 5 days. But once the SAL pattern ends, a warm ocean can spin up a storm in only a few days, if not hours.
All three hurricane predictions also cite the weakening El Niño. This shows that sea surface temperatures in the middle of the Pacific Ocean at the equator are getting cooler. NOAA predicts that they expect ENSO Neutral conditions between April and June. Already, cooler water temperatures as deep as 200 feet are being detected in the eastern Pacific. So change is coming.
While ENSO Neutral means there's no giant mass of warm or cold water in the Pacific affecting the atmosphere, it allows other atmospheric conditions to exert a bigger influence on hurricane seasons. From 2016 through 2020, summer time ENSO Neutral conditions produced some of the most active hurricane seasons on record. In fact, some of the biggest and deadliest storms to hit the US occurred during ENSO Neutral conditions: Hurricane Harvey (2017), Hurricanes Katrina and Rita (2005), and Tropical Storm Alison (2001).
NOAA predicts 70% to 80% chance for La Niña will emerge in August. Again, all three hurricane predictions suggest a La Niña can produce conditions that spawn the most tropical storms will most likely align. And in many ways, this suggests similarities to the 2020 season.
Hurricane season 2020 also began with above average sea surface temperatures in the Atlantic. Trade winds were weak across most of the Atlantic. ENSO Neutral was firmly in place and would slowly turn into La Niña by autumn; so there was little wind shear. Some tropical storms first formed at a liesurely pace from mid-May to June. But in mid-July, storm systems began forming in bursts. The most occured in September. At one point there were five named storms spinning in the Atlantic. All told, 2020 saw 30 tropical storms. Eleven struck the US; six of them were hurricanes.
So August and September could be dangerously busy.

Learn what's driving hurricane predictions this summer and what you need to know to stay safe.
Predictions for a Hurricane Hitting the US in 2024
Because hurricanes are creatures of heat, water, and wind they are reliably unpredictable. Once they spin up we can only guess where they probably will go. After all, these storm systems form in an area that stretches from the west coast of Africa all the way to the western shore of the Gulf of Mexico. That said, given the number and potential strength of the storms forecast and the things that sustain their formation, it's logical to anticipate a few coming ashore. But, predicting just how many with any accuracy is a dicey gamble.
While weather services do their best to tease details out of the hundred or so years of record keeping, most won't forecast the number and locations of landfalls.
NOAA predictions usually don't predict landfalls.
CSU also does not predict the number of landfalls but estimates probability. For example, this year, they estimate a 62% chance for a storm making landfall somewhere along the the entire (Atlantic) US coastline.
Accuweather forecast that the US will see 4-6 direct impacts.
TSR says 4.6 tropical storms or hurricanes will come ashore.
One other important thing to remember here is that electricity prices in Texas could surge if tropical storms shut down off-shore natural gas production in the Gulf of Mexico. Some natural gas platforms are located more than 100 miles from shore.
Tropical Storms - What Are the Biggest Dangers?
Tropical storms and hurricanes can unlease three dangerous events: storm surges, high winds, and flooding.
Coastal residents face the greatest danger from storm surges. Because of increasingly higher tides, storm surges are now more likely to cause flooding in any coastal city, including those in major bays and estuaries. Texas and other Gulf coast states have seen past storm surges as high a 10 to 24 feet deep that move inland for miles. So residents living on the coast will face a good chance of needing to evacuate at some point this summer.
Because water and heat fuel these storms, they lose power once they move inland. That doesn't mean they're any less dangerous. For those who live further inland, high winds, tornados, and flooding are all potential dangers. Weakened cyclones can turn into slow moving storm systems that dump enormous amounts of rain as they go. This makes flash flooding more likely and extremely dangerous in areas like central and west Texas.
How You Can Prepare for the 2024 Texas Hurricane Season
Texas Electricity Ratings is a Houston company. We've all been through the high winds, rain, and electricity outages from some very tough hurricanes. These powerful storms can affect any part of Texas so we want everyone to stay safe. Find out now what you can do to keep your family safe when the power goes out well before the first big storm comes.
Make a plan so your family knows for what to do when a dangerous storm comes your way.
Make a Hurricane Emergency Checklist to help you keep track of how to prepare and what supplies you'll need if you choose to shelter in place.
Build your hurricane disaster kit. Make sure every person and pet in your home has everything they need to get through a disaster.
Gather essential stuff for your Grab-N-Go bag. Each person (and pet) should have their own in case you need to leave your home and evacuate to stay safe.
Review and understand Texas evacuation routes ahead of time. Make arrangements well ahead of time where you’ll go to in the event of an evacuation order.
0 notes
Link
NOAA’s Geostationary Operation Environmental Satellite-U (GOES-U) is offloaded from a C-5M Super Galaxy transport aircraft onto the flatbed of a heavy-lift truck at the Launch and Landing Facility at NASA’s Kennedy Space Center in Florida on Tuesday, Jan. 23, 2024. Crews transported the satellite to the Astrotech Space Operations facility in Titusville, Florida to prepare it for launch. NASA/Isaac Watson The Geostationary Operational Environmental Satellite U (GOES-U), the fourth and final weather-observing and environmental monitoring satellite in NOAA’s GOES-R Series, is now in Florida. The satellite landed on Tuesday, Jan. 23, in a United States Air Force C-5M Super Galaxy cargo plane at the Launch and Landing Facility at NASA’s Kennedy Space Center. Data from the environmental monitoring satellite constellation enables forecasters to predict, observe, and track local weather events that affect public safety like thunderstorms, hurricanes, wildfires, and solar storms. Teams spent several hours offloading GOES-U then transferring it to the Astrotech Space Operations facility in nearby Titusville where they will process the spacecraft and perform final checkouts as part of launch preparations. “GOES is a special circumstance because it’s a series of missions,” said Rex Engelhardt, GOES-U mission manager for NASA’s Launch Services Program. “Knowledge carries over from mission to mission, which makes for a really strong and a very experienced team. To procure and integrate satellites like GOES-U onto commercial rockets, the launch services team understands the requirements of what the satellites are going to need to reach orbit, and that knowledge is critical in bringing additional reliability to the integration process to help ensure success.” Fueling will be one of the key steps to readying the spacecraft to operate for 15 years in orbit. Technicians will add about 5,000 pounds of hypergolic propellants to GOES-U, then mate the spacecraft to a payload adapter and encapsulate it in a protective payload fairing as part of launch processing. After testing and fueling are complete, the encapsulated spacecraft will move to the SpaceX hangar at Launch Complex 39A at NASA Kennedy. GOES-U is scheduled to launch no earlier than Tuesday, April 30, aboard a SpaceX Falcon Heavy rocket. NOAA’s Geostationary Operation Environmental Satellite-U (GOES-U) is offloaded from a C-5M Super Galaxy transport aircraft onto the flatbed of a heavy-lift truck at the Launch and Landing Facility at NASA’s Kennedy Space Center in Florida on Tuesday, Jan. 23, 2024. Crews transported the satellite to the Astrotech Space Operations facility in Titusville, Florida to prepare it for launch. NASA/Isaac Watson On board GOES-U are seven instruments, including a new Compact Coronagraph-1 (CCOR-1) instrument. As a part of NOAA’s Space Weather Follow On mission, CCOR-1 will observe the Sun’s outermost layer, called the corona, for large explosions of plasma that could produce geomagnetic solar storms. The CCOR-1 instrument will enhance capabilities to provide advance warnings up to four days ahead of these storms that can cause widespread damage to satellites, power grids, and communication and navigation systems. The GOES-R Series satellites are planned to operate into the 2030s. Looking forward, NOAA is working with NASA to develop the next generation of geostationary satellites, called Geostationary Extended Observations, which will bring new capabilities in support of U.S. weather, ocean, and climate operations beyond the 2030s. NASA will manage the development of the geostationary satellites and launch them for NOAA. “The GOES-R program demonstrates the tremendous value of NASA’s longstanding collaboration with NOAA,” said Renee Falden, program executive in the Joint Agency Satellite Division at NASA Headquarters in Washington. “We are taking the best qualities of that collaboration forward into the GeoXO program, which will continue NOAA’s key observations from geostationary orbit while generating new data streams for a broad community of users across the country.” NASA’s Launch Services Program, based at Kennedy, manages the launch service for the GOES-U mission. NASA’s Goddard Space Flight Center oversees the acquisition of the spacecraft and instruments. Lockheed Martin designs, builds, and tests the GOES-R series satellites. L3Harris Technologies provides the primary instrument, the Advanced Baseline Imager, along with the ground system, which includes the antenna system for data reception.
0 notes
Text
Long Term Forecast
NOAA updated our long term forecasts on 12/21. Put simply enough, they predict highertemperatures and less precipitation. Climate Prediction Center – Seasonal Outlook
If the folks at NOAA are right – and they usually are – it might be a good idea to plan for an early gardening season. As always, click the link if you want more information.

View On WordPress
0 notes
Last Seen Blogs

ama-rres
Sin título

zenithlux
Full-Time Dreamer

themysticalwild
This is The Mystical Wild. We Are its Keepers.

spandexinspace
Allegedly a comic book blog

shimmery-neurons
Shimmery Neurons!!!