#biomass assessments
Text
Very good news for Pacific Bluefin Tuna!
#pacific bluefin tuna#fisheries management#biomass assessments#noaa fisheries#fish#commercial fishing#recreational fishing
3 notes
·
View notes
Photo

Soil quality in Europe
The cultivation of bioenergy plants in fertile, arable lands increasingly results in new land use conflicts with food production and cannot be considered as sustainable. Marginal lands have been frequently considered as potential alternatives for producing bioenergy from biomass. However, clear definitions and assessment methods for selecting marginal lands and for calculating potentials are still widely missing.
The project “SEEMLA” aims at triggering the exploitation of currently underused marginal lands for biomass production for energy purposes. Study sites have been selected in different European countries: Germany, Greece, and Ukraine. The selected sites represent a wide variety of different types of marginal lands. Based on a soil assessment set given by the Muencheberg Soil Quality Rating (SQR) system potentially “marginal” sites have been investigated. The SQR system allows for clearly distinguishing between soils of higher and lower quality. Soils with SQR scores below 40 are regarded as “marginal”. They can be classified into different groups with regard to the importance of soil hazard indicators as evaluated by the SQR approach. The calculated SQR scores correlate significantly with biomass yields of bioenergy plants.
Further, the SQR method was adapted for use in a GIS study on marginal-land potentials in Europe. Thus, 46 % of the investigated European area could be classified as “marginal” with SQR scores below 40. From that area 22.6 % can be considered as potentially suitable for producing renewable resources after eliminating protected sites or other places not suitable for any kind of land use. Taking the ecological demands of selected bioenergy plants into account it is possible to give first preliminary recommendations for regional crop cultivation.
It can be concluded that Europe offers a large potential for renewable resources from marginal sites. However, the implementation into practice is often impeded by missing or varying policies and regulations. A proper implementation needs clear regulations and also incentives for farmers at the European level.
Full article >>
186 notes
·
View notes
Link
2 notes
·
View notes
Text
WIP Wednesday
"We don't know what the Wraith are actually feeding on or how. If it's some kind of time dilation there's nothing we can do, but if I can figure out their space magic vampire shit I might be able to reverse this."
"You can't get those answers from a genetic sample in two weeks," Weir says.
"There are more efficient ways."
They stare each other down. Weir knows exactly what he's asking for, what he needs to figure out the Wraith, but most of the expedition is still of the impression he's his creator. Alex isn't sure if she's weighing the risks of sending him out Wraith hunting or waiting for the recon team to figure out what he's asking for. Maybe both, knowing her.
Most of the expedition are geniuses so it doesn't take long.
"You want us to catch a Wraith. A live one."
It's not surprising Sheppard is the one who gets it—McKay wouldn't think of something so stupid, but Sheppard is a soldier.
"Oh, great. Let's just bring a Wraith into the city! That can't possibly go wrong," McKay shouts, tossing his hands up with his typical drama.
"Of course the Wraith wouldn't be coming into the city. I'd go to them."
Alex rolls his eyes. When he ignores McKay and watches Sheppard instead he can see the man inspecting Weir; assessing her confidence in the outcome, probably.
Alex is confident and she knows what he can do. He's even well stocked up on biomass from absorbing every stray bit of dust he could get his tendrils into back on Earth and practicing his photosynthesis in the desert sun. There's been less opportunity on Atlantis, but even the long abandoned, completely sealed city has left behind biomass and he's been photosynthesizing during his off work hours under the LED lights he packed in his personal belongings. Since he isn't on any of the recon teams Alex hasn't used much of it up.
Even assuming the average Wraith is as tough as the Supreme Hunter, they'll be significantly less adaptable.
"We have trouble enough killing a Wraith. Catching one alive won't be easy," Sheppard says.
"Won't need to be alive long," he answers.
Alex wanders over to Sumner's bed and inspects the vitals readouts with a grimace. Not having much medical experience, even secondhand, little of it means much to Alex. All of the Gentek scientists and doctors he consumed specialized primarily in research and most of them never did any type of practical patient care.
"Two weeks."
His smile is probably too sharp to be completely human, but he doesn't care at the moment. There are more important things to think about now.
"Then I'd best go find Teyla."
Alex turns on his heel and heads for the training rooms where Teyla spends a large part of her time. Behind him Sheppard and McKay both hurry after, McKay with significantly more noise. He ignores McKay's questions and ranting, mildly grateful for Sheppard's military background that means he knows when not to ask any. He feels a moment of regret for Cross getting caught by the Supreme Hunter.
---
This is from several chapters in to this fic (which is not yet posted at all, though the first chapter might go up soon) but I think it mostly stands on its own. This whole idea was spawned by my thoughts about how much Alex Mercer (blacklight edition) has in common with the Wraith.
4 notes
·
View notes
Text

The Best Places to Plant Trees in Maryland
Nature has provided an effective tool for removing some climate-warming carbon from the atmosphere—trees. Through photosynthesis, trees pull carbon dioxide out of the air and can store it for hundreds of years. But knowing the best places to plant them—to get the most environmental and economic benefits—can be a challenge.
Using high-resolution lidar data, satellite imagery, and modeling, a team of researchers supported by the NASA Carbon Monitoring System (CMS) has developed a method to help the state of Maryland assess the best places to grow trees. The method considers both the carbon storage potential and economic opportunity of the land.
First, the researchers mapped how much carbon could be captured (or sequestered) by trees and other plants based on local environmental conditions. The map above (top) shows the amount of carbon stored in trees and other vegetation (also known as above-ground biomass) across Maryland as of 2011. The other map (bottom) shows the amount of carbon that could potentially be stored in vegetation, based on climate, soil type, and land use across the state. For example, Eastern Maryland has a warmer and longer growing season than western parts of the state, allowing for more tree growth and more carbon storage.
Statewide, there is potential to soak up nearly three times as much carbon in vegetation compared to what was sequestered in 2011. The data behind the map rely on Landsat satellite imagery and high-resolution airborne lidar measurements of tree height and canopy extent.
“Maryland is the first state in the nation to use a remote sensing-based system for monitoring forest carbon,” said Rachel Lamb, senior climate advisor for the Maryland Department of the Environment. The agency is using these data to track carbon fluxes from existing forests and to assess the best places to plant new trees to maximize carbon outcomes. The state aims to plant and maintain 5 million native trees by 2031, as part of its efforts to reduce carbon pollution by 60 percent from 2006 levels.
Lamb helped develop these datasets as a doctoral and postdoctoral researcher at the University of Maryland in 2021 and 2022. During her time at the university, she built upon the above maps to assess the economic feasibility of growing trees on farmland, based on estimates of how much money farmers are currently making. About one-third of Maryland’s land is farmed, and much of this land was once deciduous forest.
“Using these data, we were able to identify places where it’s a win-win for the environment, the climate, and for farmers financially to grow trees instead of crops,” said Lamb. In her 2021 paper in Environmental Research Letters, Lamb found that about 23 percent of Maryland’s cropland would be more profitable growing trees than crops. The estimate is based on a carbon price of $20 per ton, and a land-use commitment of 20 years.
“While these findings are not prescriptive—some farmers may prefer to grow crops instead of trees and of course agriculture plays an important role in food security—they can help landowners and the state make strategic decisions on what to grow in specific locations, based on joint economic, social, and environmental outcomes.”
Images by Michala Garrison, based on data from Hurtt et al. (2019). Story by Emily Cassidy.
3 notes
·
View notes
Text
10 Most Popular Power and Renewable Energy Management Courses in India

Climate change and concerns about environmental sustainability have led to a sharp increase in the demand for renewable energy in recent years. So, qualified individuals in India are demanded to plan, coordinate, and carry out renewable energy projects.
This guide will provide the popular power and renewable energy management courses in India and information on the qualifications and skills required for a career in renewable energy and how to get started in the field.
What is Renewable Energy Management?
Renewable energy management involves designing, implementing, and managing projects and systems to generate electricity, heat, or fuel from renewable sources such as solar, wind, hydro, biomass, and geothermal energy.
A career in renewable energy requires a strong foundation in Renewable Energy Management, as it is critical to the success of any renewable energy project. Professionals in this field must deeply understand renewable energy technologies, energy markets, policy and regulatory frameworks, project finance, environmental impact assessment, and stakeholder engagement.
Which course is best for renewable energy?
Online courses, certificate programs, undergraduate and graduate degree programs, and executive education programs are just a few of the several types of renewable energy courses offered.
It is crucial to consider aspects like the course's content, the standing of the institution offering it, the length of the program, and the course's cost when selecting a renewable energy course.
Online courses in renewable energy offer several advantages, including flexibility, affordability, and accessibility to some of the best online renewable energy courses available in India.
Top 10 Popular Power and Renewable Energy Management Courses in India
1. Post Graduate Diploma in Renewable Energy Management from TERI School of Advanced Studies
This one-year curriculum covers various subjects, including project management, legislation and regulation, biomass, solar, wind, and other energy sources. The course comprises both practical instruction and a research project.
2. Master's in Renewable Energy from Amity University
This two-year program includes project financing and investment, energy policy, and renewable energy technologies. Internships and a capstone project are features of the program.
3. Executive Program in Renewable Energy from Indian Institute of Management (IIM) Ahmedabad
Professionals with prior experience in the energy industry should enroll in this six-month program. The program includes project financing, management, policy, and technologies related to renewable energy.
4. Post Graduate Program in Power Management from Great Lakes Institute of Management
Professionals with prior experience in the energy industry should enroll in this six-month program.
The program includes project financing, management, policy, and technologies related to renewable energy.
5. Diploma in Power Management from Narsee Monjee Institute of Management Studies (NMIMS)
This one-year curriculum includes energy economics, renewable energy technology, electricity generation, transmission, and distribution.
A final project and internships are both part of the curriculum.
6. Energy Management Certificate Course from Indian Institute of Technology (IIT) Bombay
Energy efficiency, renewable energy technology, and energy law and policy are all topics covered in this six-month course. In addition, the curriculum includes case studies and site visits to renewable energy projects.

7. Master's in Energy Studies from the University of Petroleum and Energy Studies (UPES)
The topics covered in this two-year degree include project management, energy policy, and renewable energy technology. Internships and a research project are part of the program.
8. Advanced Certificate Program in Renewable Energy Management and Finance from Indian School of Business (ISB)
This four-month curriculum covers policy and regulation, financing, and renewable energy technologies.
Case studies and a capstone project are also part of the program.
9. Master's in Energy Science and Technology from Indian Institute of Technology (IIT) Bombay
Energy systems, renewable energy technologies, and energy policy and management are all topics covered in this two-year study.
A research project and electives in specific subjects are part of the program.
10. Certification Course in Solar Energy from National Institute of Solar Energy (NISE)
The design, installation, and maintenance of solar energy systems are all covered in this three-month program.
The course involves practical instruction and a capstone project.
Qualifications and Skills Required for a Career in Renewable Energy
Educational and Professional Qualifications
Generally, a renewable energy profession necessitates a bachelor's degree in engineering, science, or technology.
Graduate degrees, such as a Master's in Renewable Energy or Energy Management, might give job seekers a competitive edge.
Professional certifications from trade organizations like the Renewable Energy and Energy Efficiency Partnership (REEEP) and the Association of Energy Engineers (AEE) can further show expertise.
Key Skills Required for a Career in Renewable Energy
Technical expertise in biomass, wind, solar, and other renewable energy sources.
You'll need project management abilities to plan, create, implement, and manage renewable energy projects.
Analytical abilities are needed to conduct energy audits and assess and evaluate the viability of renewable energy projects.
Business and financial skills to understand project finance, funding options, and investment analysis.
Communication and stakeholder engagement skills to collaborate with diverse stakeholders such as government agencies, investors, and local communities.
Popular Renewable Energy Courses
The Post Graduate Diploma in Renewable Energy Management from the TERI School of Advanced Studies, the Master's in Renewable Energy from Amity University, and the Energy Management Certificate Course from the Indian Institute of Technology (IIT) Bombay are some of the more well-known renewable energy courses in India.
These courses cover many subjects, including project management, financing, renewable energy technology, energy law and policy, and more.
In addition to formal schooling, developing practical skills in the industry can benefit from hands-on experience through internships or on-the-job training.
How to start a career in Renewable Energy?

Gain Relevant Education and Training
1. Work toward a relevant degree or diploma in engineering, science, or technology.
2. Consider taking additional classes in project management, business and finance, and renewable energy technologies.
3. Take part in internships or apprenticeships to get real-world experience.
Build a Professional Network
1. Participate in trade shows and other events to meet industry experts.
2. Join a professional group to network with like-minded individuals and stay up to current on market changes, such as the Renewable Energy Association of India (REAI) or the Indian Wind Power Association (IWPA).
Look for Job Opportunities
1. Research and apply for job opportunities in renewable energy companies, energy consultancies, and government agencies.
2. Some of India's widespread power management courses include the Executive Program in Renewable Energy from the Indian Institute of Management (IIM) Ahmedabad.
And the Post Graduate Program in Power Management from the Great Lakes Institute of Management and the Diploma in Power Management from Narsee Monjee Institute of Management Studies (NMIMS).
3. Consider starting your own renewable energy venture or consulting firm.
Stay Up-to-Date with Industry Developments
1. To stay current on the most recent trends and advancements in renewable energy, read industry publications and news.
2. Participate in professional development programs and continuing education courses to improve your abilities and expertise.
Conclusion
However, to succeed, one must pursue a career in renewable energy, build a solid professional network, stay up-to-date with industry developments, and consider starting a venture or consulting firm.
Suppose you are interested in pursuing a career in India, including online courses in power management. With the proper education, training, and experience, you can contribute to a more sustainable future while building a rewarding career in renewable energy.
#renewable energy management#careers in renewable energy#job opportunities in renewable energy#career transition in power sector
2 notes
·
View notes
Text
The Real Story about Global Warming
What to do about Climate Change?
Below are a series of questions I would challenge you to consider in assessing the severity of climate change and the ability to effectively do anything about it.
I will assume that for each question that we answer in support of climate change. Just realize that at any point of the questions that a no, maybe, or not sure invalidates any logic that we should spend billions or trillions of dollars.
Key Questions to Ask about the Truth of Climate Change
Is the world actually warming?
The earth has actually been in a cooling phase, or at least a pause, for the until about 2018; thus the change to the climate change to further obfuscate the issue. Hurricanes, tornadoes, and droughts have actually decreased in recent decades, not become more severe. If we pull back a million years, or even better, a billion years, we see a steady swing of temperature changes that make Al Gore's hockey stick look insignificant. We are actually at the tail end of an inter-glacial period (free of an ice age), and are likely to see significant cooling in decades to come. But let us say the earth is warming, then the question is:
2) Is the climate change significant enough to pose a threat to the planet?
The earth has been going through changes in climate constantly, from seasons to decades to eons. Normal fluctuations have been occurring forever without humans being the cause. 80,000 years ago Kansas was under over a mile of ice. 80,000,000 years ago Kansas was a sea over 1,000 feet deep! This all occurred without a single SUV or smokestack, imagine that. But again let’s assume there is some sort of threat that we should pay attention to.
3) Is the climate change being caused by humans?
By far, the largest factor affecting world temperatures is the sun. Just notice the difference in temperature between day and night or winter and summer. The amount of irradiance the earth receives has a dramatic effect on temperature. The yearly cycle of orbiting the sun as significant effect on temperature. But, there are other longer cycles in play as well.
The 11-year sun spot cycle affects earth’s temperature. During solar flares, cosmic rays that normal bombard the earth freely, are greatly diminished (pushed aside) by the energy coming from the sun spots. This effects cloud formation. From Google: “Cosmic rays are charged particles that bombard the Earth's atmosphere from outer space. Studies suggest they may influence cloud cover either through the formation of new aerosols (tiny particles suspended in the air that can grow to form seeds for cloud droplets) or by directly affecting clouds themselves.”
Clouds can reflect heat entering the earth’s atmosphere (the albedo effect: the measure of diffusive reflection of solar radiation out of the total solar radiation received by a body) or they can help to trap heat beneath them and raise temperature. The balance between lower temperatures ((albedo effect) and raising temperature via entrapping surface heat is not well known. But suffice it to say the sun, cosmic rays and clouds are integral to varying temperatures.
The Milankovitch cycle describes the ever-changing relationship between the earth and the sun. The elliptical orbit we have around the sun varies over tens of thousands of years and becomes nearly circular. The 23.5-degree tilt of the sun varies over thousands of years. The “wobble” of the earth changes such that Vegas not Polaris will be true north at some point, and then back again. All of these factors contribute more to changes in temperature cycles than CO2.
CO2, the culprit most cited by global warming alarmist, is only 400 parts per million (PPM) in the atmosphere. The vast majority of CO2 comes from the oceans, decaying biomass, and volcanoes. Only one-tenth of CO2 comes from humans or 40 PPM. Just as a reference, that is like one penny out $250 worth of pennies…very small.
CO2 has ranged from 7,000 parts per million to as low as 180 parts per million - and life survived. In fact, in times of higher CO2 concentrations, agriculture flourished, famine was reduced and human advancement increased. Humankind was freed from spending all their time tilling the land and was able to contemplate the stars, write poetry, advance science and ponder the meaning of life. Did you know that greenhouses intentionally pump in CO2 to levels of 2,000 PPM or more because plants thrive in a CO2-enriched environment?
Arctic and Antarctic ice cores conclusively show over and over that periods of significant temperature rise always precede the rise in CO2; by many decades or even hundreds of years. Why? Because the oceans, by far, the largest repository of CO2, release it as temperatures rise. This leads to massive increases in vegetation which, as it dies, also releases prodigious amounts of stored CO2. CO2 continues to rise, as a lagged effect, for decades or centuries after a cooling period has started. The causality is just the opposite as expounded by climate alarmist.
CO2, as a greenhouse gas (GHG), is a poor retainer of heat. Yes, it does, as a GHG, elevate temperature especially between zero and 400 PPM. However, it is an ever-decreasing asymptotic curve of diminishing affect. It is estimated that a doubling of CO2 to 800 PPM would only have a .7-degree C impact on global average temperatures. Why? Because the bandwidth spectrum that CO2 resides within is nearly saturated at 400 PPM.
Let's not forget that water vapor is by far the most abundant GHG (about 85% of GHGs). It has far greater impact on heat absorption in the atmosphere than CO2. But let us for argument sake say that global warming is real, it poses a threat, and it is man-made. Next question.
4) Is there something that we can practically do to change the threat of global warming?
Short of shutting down all fossil fuel consumption, what is it we can do? Will better MPG or electric cars (which use energy from electric plants that predominately burn fossil fuels) stop climate change? Will going to all solar and wind help?
Only about 3% of US energy comes from these highly subsidized yet unprofitable businesses. These technologies do not have the ability or resources to provide the energy needed to run the U.S. economy, and won’t have it for decades. If we shut everything down will it make a difference? What data, analysis, or studies show that a 100% effort by humans would change the natural temperature cycles the earth has experienced? But let’s assume we can, next question.
5) If there are practical things we can do, are they affordable?
Who is going to pay for all this climate change remediation? Do we even have a plan of what actions we would take, what the timeline would be, or most importantly how much it would cost? What is the plan except invoking mammoth carbon taxing? Will the poorest 180 countries contribute any money? Probably not. In fact, they likely will receive a massive influx of cash to “fight” global warming. Can you guess why they signed the Paris treaty? One perspective is that climate change is really just a justification and means to help redistribute the wealth of the 20 richest countries, mostly from the U.S., to the poorest nations.
Will India or China (who both of whom out pollute the U.S.) agree to divert huge national resources away from their growing economies to solve a problem that many believe doesn’t exist? Does the U.S., which is already $20T in debt, have the resources? All the billionaires in the U.S, only have about $2.2T and all the millionaires only about $19T. Where does the money come from? Especially if we want to continue to increase U.S. entitlements?
President Trump rightly pulled out of the Paris Accord because the U.S. was being forced to pay the preponderance of the costs, and countries like China and India were being allowed to continue to pollute. But let’s assume we can afford it. Next question.
6) Do we as citizens of the world have the political will to allow our leaders to effect massive changes that would directly affect our pocketbooks, our lifestyles, consumption patterns, and freedoms?
Would we be willing to go back to the lifestyle of the pre-industrial world? No electricity, no cars, no iPhones, no lights, no A/C? Okay, maybe not that drastic - how about limiting car usage, rationing electricity, or moving us all into smaller “sustainable” 1970 era Russian-like apartments?
If we restrict fossil fuels won’t people start cutting down trees to heat their homes and doing other unhealthy environmental things? What do we do when nations ignore the rules? Do we succumb to a one-world government that has the power and control to force us?
It is a lot of ifs, and I for one am not willing to give our government further control of my life on a bunch of flimsy ifs. Who benefits if climate change is a hoax or is being vastly overblown? Government! It gives them more power, more control; and for us, less personal freedom and ultimately, a world dominated by elites and not of, for and by the people.
I am not a climate denier; I am a government skeptic! Do we need to be prudent proactive stewards of the earth? Do we need to combat pollution? Of course! Do we need to be told to change our lives based on politicized science - not on my watch! There is no such thing as settled science, that is a non-sequitur.
Is global warming real? Is it a threat? Are humans a significant cause? Is there something we can do about it? Can we afford to fix it? These are some of the questions we should all be demanding be answered before we are shackled with the consequences of trying to battle the climate change phantom.
6 notes
·
View notes
Text
Distilleries powered by what?
Now everyone knows global warming is becoming a greater concern each year and more action needs to be taken to start slowing it down. This is why the Scottish Whisky Association have taken it upon themselves to set a goal for all distilleries to be carbon neutral by 2040. This is important because distilleries use a lot of electricity, some may even argue that they aren’t necessary! If you said that to a Whisky drinker I’m sure they would have something to say about it though.
This goal of distilleries being carbon neutral by 2040 seems fairly reasonably especially when you could just plant a lot of trees until that evens the scales. Hopefully distilleries are seen to go for something else as this option is quite expensive and not really the idea of the goal. Ideally renewable energy is the best for the environment but it’s good to explore other options.
One of the biggest by-products of Brewing and Distilling is spent grain, once sugar has been extracted from the grain it is no longer needed. There are various ways to dispose of this but ideally it can be recycled. The most common way of doing this is farmers using the spent grain to feed their livestock. Another more recent innovation is to use the spent grain to create power for the brewery/distillery.
For example, Bunnahabhain a distillery on Isla have built a Biomass energy centre that will power the distillery and more. The spent grain is usually not enough to power the whole distillery so they have arranged to receive wood chips from a nearby forestry commission. The good thing about the wood chips is that the trees in these forests is that they are already being chopped down regardless to add more variety rather than a purely carnivorous forest. The biomass energy centre works by combusting the spent grain and the wood chips together, the ash is then used as fertilizer for the new trees.
Similar to Biomass energy, due to the water content in spent grain, creating biogas may be more favourable. Biogas is created from a reaction called anaerobic digestion, this involves the spent grain being placed in a sealed container and the bacteria converts the spent grain into gasses - mostly methane. Zorg, a company that has been designing and building biogas plants since 2006 have made a number of biogas plants in distilleries.
The most common way of powering your distillery with renewable energy would be with wind turbines. Most distilleries in Scotland are located outside densely populated areas so making use of the land to build wind turbines seems like the easiest option. It is expensive, however they will need to do something by 2040 anyway so this might be the only way. North Point Distillery is a distillery located towards the north of Scotland and specialises in rum. Their distillery runs 100% of renewable energy thanks to a nearby wind farm. To add to that their bottles are made from 100% recycled bottles. Corks and labels come from partners with carbon-free certifications
Overall there will be many distilleries creating many unique methods of getting their distillery to carbon neutral. They also may use many different sources of energy but as long as they reach that target then I can't really complain.
2 notes
·
View notes
Text
Microbiologists study giant viruses in climate-endangered Arctic Epishelf Lake
https://sciencespies.com/nature/microbiologists-study-giant-viruses-in-climate-endangered-arctic-epishelf-lake/
Microbiologists study giant viruses in climate-endangered Arctic Epishelf Lake
Less than 500 miles from the North Pole, the Milne Fiord Epishelf Lake is a unique freshwater lake that floats atop the Arctic Ocean, held in place only by a coating of ice. The lake is dominated by single-celled organisms, notably cyanobacteria, that are frequently infected by unusual “giant viruses.” Investigators from Université Laval, Québec, Canada have produced the first assessment of the abundance of the viruses in this lake. The research is published in Applied and Environmental Microbiology, a journal of the American Society for Microbiology.
Viruses are key to understanding polar aquatic ecosystems, as these ecosystems are dominated by single celled microorganisms, which are frequently infected by viruses. These viruses, and their diversity and distribution in the Milne Fiord Lake have seldom been studied. team is now working to sequence the giant viruses, an effort that will likely lead to understanding how the viruses influence the lake’s ecology via their interactions with the cyanobacteria they infect.
Quickly rising temperatures limit the time remaining to for microbiologists to develop a clear picture of the biodiversity and biogeochemical cycles of these ice-dependent environments, as well as the consequences of the rapid, irreversible changes in temperature. “The ice shelf that holds the lake in place is deteriorating every year, and when it breaks up, the lake will drain into the Arctic Ocean and be lost,” said corresponding author Alexander I. Culley.
“Our results highlight the uniqueness of the viral community in the freshwater lake, as compared to the marine fiord water, particularly in the halocline community,” said Culley. The halocline is an area where salinity falls quickly as one ascends the water column. This environment offers niches for viruses and hosts which are found neither in freshwater nor marine layers of uniform salinity, he said.
The remote lake in the high arctic could only be reached by helicopter, when weather conditions allowed. The research team collected water samples and sequenced all the DNA in the lake water, allowing them to identify the viruses and microorganisms within it. The study establishes a basis for advancing understanding of viral ecology in diverse global environments, particularly in the high Arctic.
“High bacterial abundance coupled with a possible prevalence of lytic lifestyle at this depth suggests that viruses have an important role in biomass turnover,” said Mary Thaler, Ph.D., a member of Culley’s team at Université Laval. “Lytic lifestyle” refers to the release of daughter virus particles as the host microbial cell is destroyed.
The most dramatic change observed in the Milne Fiord Epishelf Lake was a multiyear decline in the abundance of cyanobacteria. The researchers attributed that drop to the increasing marine influence in the freshwater lake, “since cyanobacteria have very low abundance in the Arctic Ocean,” they wrote.
Nonetheless, the details of this ecosystem remain obscure, because so far most of its viruses are known only from fragments of their sequences. Thus, in most cases, the scientists do not yet know how the viruses influence the microbes they infect, or which viruses inhabit which microbes.
Story Source:
Materials provided by American Society for Microbiology. Note: Content may be edited for style and length.
#Nature
#2022 Science News#9-2022 Science News#acts of science#Earth Environment#earth science#Environment and Nature#everyday items#Nature Science#New#News Science Spies#Our Nature#planetary science#production line#sci_evergreen1#Science#Science Channel#science documentary#Science News#Science Spies#Science Spies News#September 2022 Science News#Space Physics & Nature#Space Science#Nature
1 note
·
View note
Text
The achievement of German forestry science in standardizing techniques for calculating the sustainable yield of commercial timber and hence revenue was impressive enough. What is decisive for our purposes, however, was the next logical step in forest management. That step was to attempt to create, through careful seeding, planting, and cutting, a forest that was easier for state foresters to count, manipulate, measure, and assess. The fact is that forest science and geometry, backed by state power, had the capacity to transform the real, diverse, and chaotic old-growth forest into a new, more uniform forest that closely resembled the administrative grid of its techniques. To this end, the underbrush was cleared, the number of species was reduced (often to monoculture), and plantings were done simultaneously and in straight rows on large tracts. [...]
The great simplification of the forest into a “one-commodity machine” was precisely the step that allowed German forestry science to become a rigorous technical and commercial discipline that could be codified and taught. A condition of its rigor was that it severely bracketed, or assumed to be constant, all variables except those bearing directly on the yield of the selected species and on the cost of growing and extracting them. As we shall see with urban planning, revolutionary theory, collectivization, and rural resettlement, a whole world lying “outside the brackets” returned to haunt this technical vision. [...]
Only an elaborate treatise in ecology could do justice to the subject of what went wrong, but mentioning a few of the major effects of simplification will illustrate how vital many of the factors bracketed by scientific forestry turned out to be. German forestry’s attention to formal order and ease of access for management and extraction led to the clearing of underbrush, deadfalls, and snags (standing dead trees), greatly reducing the diversity of insect, mammal, and bird populations so essential to soil-building processes. The absence of litter and woody biomass on the new forest floor is now seen as a major factor leading to thinner and less nutritious soils. Same-age, same-species forests not only created a far less diverse habitat but were also more vulnerable to massive storm-felling. The very uniformity of species and age among, say, Norway spruce also provided a favorable habitat to all the “pests” which were specialized to that species. Populations of these pests built up to epidemic proportions, inflicting losses in yields and large outlays for fertilizers, insecticides, fungicides, or rodenticides. Apparently the first rotation of Norway spruce had grown exceptionally well in large part because it was living off (or mining) the long-accumulated soil capital of the diverse old-growth forest that it had replaced. Once that capital was depleted, the steep decline in growth rates began.
As pioneers in scientific forestry, the Germans also became pioneers in recognizing and attempting to remedy many of its undesirable consequences. To this end, they invented the science of what they called “forest hygiene.” In place of hollow trees that had been home to woodpeckers, owls, and other tree-nesting birds, the foresters provided specially designed boxes. Ant colonies were artificially raised and implanted in the forest, their nests tended by local schoolchildren. Several species of spiders, which had disappeared from the monocropped forests, were reintroduced. What is striking about these endeavors is that they are attempts to work around an impoverished habitat still planted with a single species of conifers for production purposes. In this case, “restoration forestry” attempted with mixed results to create a virtual ecology, while denying its chief sustaining condition: diversity.
The metaphorical value of this brief account of scientific production forestry is that it illustrates the dangers of dismembering an exceptionally complex and poorly understood set of relations and processes in order to isolate a single element of instrumental value. The instrument, the knife, that carved out the new, rudimentary forest was the razorsharp interest in the production of a single commodity. Everything that interfered with the efficient production of the key commodity was implacably eliminated. Everything that seemed unrelated to efficient production was ignored. Having come to see the forest as a commodity, scientific forestry set about refashioning it as a commodity machine. Utilitarian simplification in the forest was an effective way of maximizing wood production in the short and intermediate term. Ultimately, however, its emphasis on yield and paper profits, its relatively short time horizon, and, above all, the vast array of consequences it had resolutely bracketed came back to haunt it.
Even in the realm of greatest interest—namely, the production of wood fiber—the consequences of not seeing the forest for the trees sooner or later became glaring. Many were directly traceable to the basic simplification imposed in the interest of ease of management and economic return: monoculture. Monocultures are, as a rule, more fragile and hence more vulnerable to the stress of disease and weather than polycultures are. [...] Any unmanaged forest may experience stress from storms, disease, drought, fragile soil, or severe cold. A diverse, complex forest, however, with its many species of trees, its full complement of birds, insects, and mammals, is far more resilient—far more able to withstand and recover from such injuries—than pure stands. Its very diversity and complexity help to inoculate it against devastation: a windstorm that fells large, old trees of one species will typically spare large trees of other species as well as small trees of the same species; a blight or insect attack that threatens, say, oaks may leave lindens and hornbeams unscathed. Just as a merchant who, not knowing what conditions her ships will face at sea, sends out scores of vessels with different designs, weights, sails, and navigational aids stands a better chance of having much of her fleet make it to port, while a merchant who stakes everything on a single ship design and size runs a higher risk of losing everything, forest biodiversity acts like an insurance policy. Like the enterprise run by the second merchant, the simplified forest is a more vulnerable system, especially over the long haul, as its effects on soil, water, and “pest” populations become manifest. Such dangers can only partly be checked by the use of artificial fertilizers, insecticides, and fungicides. Given the fragility of the simplified production forest, the massive outside intervention that was required to establish it—we might call it the administrators’ forest—is increasingly necessary in order to sustain it as well.
6 notes
·
View notes
Text
Power generation from renewable energy resources plays an essential role in Europe’s transition to a decarbonized energy system.
The European State of the Climate (ESOTC) report reveals that a record 43% of actual electricity generation in Europe came from renewable sources, up from 36% in 2022. For the second consecutive year, energy generation from renewables overtook the generation from polluting fossil fuels. The largest source is biomass, which is not covered in this report. Until 2018, hydro-power was the second largest renewable energy source, but that position has now been taken by wind power. The total installed capacity of wind and solar power has been steadily increasing over the past two decades.
Renewable energy resources and electricity demand are highly sensitive to climatic conditions, which are subject to long-term trends and fluctuations on timescales ranging from days to decades. With Europe’s increasing move to renewable resources for its electricity supply, monitoring and understanding their temporal and spatial variability, and how they may be changing in a warming climate, is becoming more vital. It is important to assess how these variations affect both the demand for electricity and the potential for renewable energy generation.
This section provides an overview of actual electricity generation in Europe in 2023. It then explores the implications of climate conditions for potential power production for onshore wind power, solar photovoltaic (PV) and run-of-river hydropower, and on electricity demand. Only climate-dependent variations are taken into account; all other factors, such as variations due to improvements in the efficiency of the technology, are taken as constant. Other assumptions, such as the homogenous distribution of production units for wind and solar power across Europe, are also made. Potential power generation is represented as capacity factor (CF) – the ratio between the average power potentially delivered and the theoretical maximum power. CF ranges in value between 0, when no power is delivered, and 1, when the delivered power is equal to the theoretical maximum power of the system.
Measured electricity generation and demand in 2023
Figure 1a. Percentage of the total actual annual electricity generation from 2016 to 2023 for Europe, from solar (yellow), wind (purple) and hydro (blue) power, and other sources, including other renewables and fossil fuels (grey). Total generation in TWh is shown in Figure S1[5]. Data source: ENTSO-E and Elexon.
In 2023, electricity demand across Europe was the lowest in eight years, at around 2.6 PWh. The year saw a record share of electricity generation from renewables, at around 43%, with 17% from hydropower, 18% from wind power and 7% from solar power. Solar and wind energy tend to follow a complementary seasonal cycle: solar power generation is naturally highest during spring and summer, while wind power produces more electricity in autumn and winter.
Climate-driven electricity demand and potential for generation in 2023
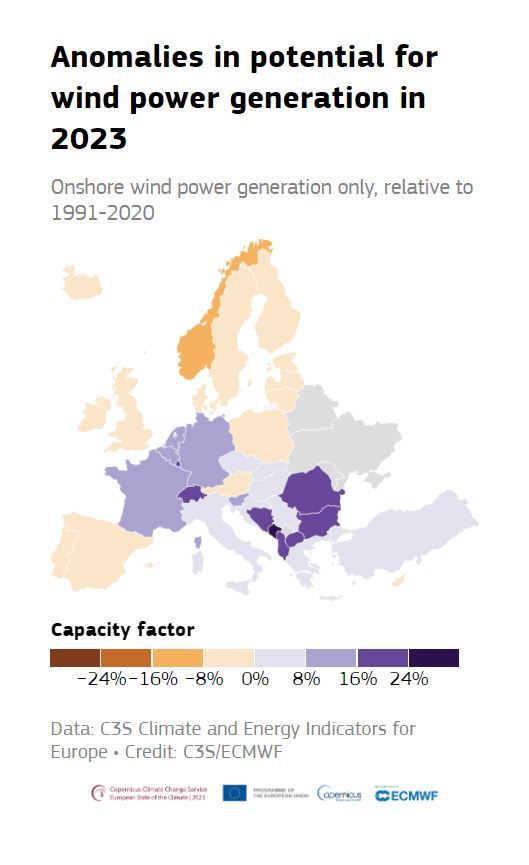
Figure 2. Anomalies (%) in potential electricity generation from three renewable sources in 2023: onshore wind capacity factor (top left), solar photovoltaic capacity factor (top right), run-of-river hydropower capacity factor (bottom left); and in climate-driven electricity demand (bottom right). All anomalies are relative to the average for the 1991–2020 reference period and expressed as a percentage of this average. Countries shaded in grey are those for which no data are available, except for solar PV for which these countries are not shown. Data source: C3S Climate and Energy Indicators for Europe.

The climate-driven electricity demand in countries in central and eastern Europe was close-to or below average for the year as a whole. This is consistent with warmer-than-average temperatures experienced across much of Europe, notably during the winter and autumn, and a corresponding reduced demand for heating. Conversely, climate-driven electricity demand was above average in parts of southern Europe, particularly Spain and Italy, and in Norway and Sweden. In southern Europe, this was largely due to high summer temperatures, leading to increased demand for cooling; in Scandinavia, it was linked to the well-below-average temperatures experienced during several months that increased the demand for heating. More on temperature conditions can be found in the ‘Temperature’ and ‘Contrasting summer’ sections.

Potential electricity generation from wind was above average in central and southeastern parts of Europe, and below average in Spain, the UK, Iceland, Fennoscandia, and parts of northeastern Europe.

Potential electricity generation from solar was below average in northwestern and central parts of Europe, and above average in southwestern and southern Europe, and Fennoscandia. Solar CF is closely related to surface solar radiation, but other technological factors also play a role. For example, while solar radiation was well above average across much of northern Europe in May and June, the potential for solar generation was not as high, as not all solar radiation is converted into power, particularly at high temperatures. Therefore, averaging across the year results in lower potential power generation from solar PV, compared to the anomalies in solar radiation.
For run-of-river hydropower, potential electricity generation was above average across much of Europe, except for Spain, Norway and Romania. This largely reflects regional anomalies in precipitation. Similarly, the month-to-month variability in hydropower CF, discussed below, reflects anomalies in monthly average river flow across the European river network.
Variability throughout the year
Potential power generation from renewable sources and climate-driven electricity demand both change throughout the year, due to variability in weather and climate. Below, June and November are discussed, to demonstrate this variability between warmer and cooler times of year.
Onshore wind power
Figure 3. Average onshore wind power capacity factor anomaly (%) for June 2023 (left) and November 2023 (right), relative to the respective monthly average for the 1991–2020 reference period and expressed as a percentage of this average. Countries shaded in grey are those for which no data are available. Data source: C3S Climate and Energy Indicators for Europe.
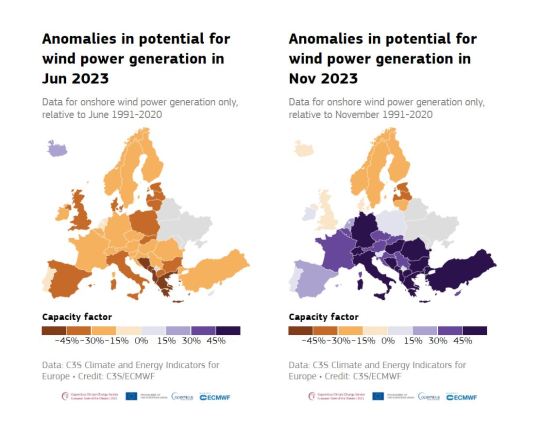
In June, wind power CF was below average across Europe, except for Iceland, with the largest anomalies observed in Serbia, Bosnia and Herzegovina, and Albania, at up to 64% below average. This reflects below-average wind speeds across all but northeastern Europe and Iceland. In contrast, November saw well-above-average wind power CF anomalies across central and southern parts of Europe, and below-average anomalies in Fennoscandia, the United Kingdom and Iceland. This is consistent with above-average wind speeds observed across most of Europe in the last three months of 2023, associated with storm activity.
Solar photovoltaic
Figure 4. Average solar photovoltaic capacity factor anomaly (%) for June 2023 (left) and November 2023 (right), relative to the respective monthly average for the 1991–2020 reference period and expressed as a percentage of this average. Countries with no data available are not shown. Data source: C3S Climate and Energy Indicators for Europe.
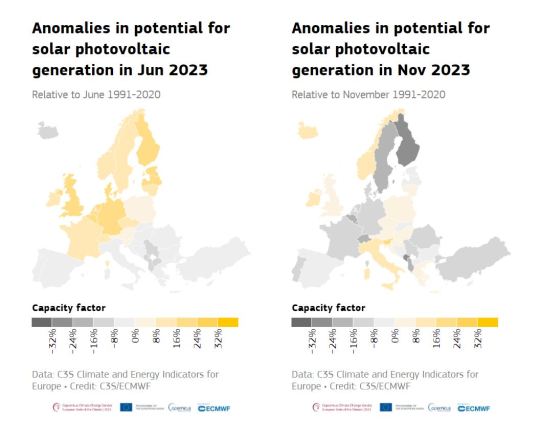
For solar PV power, June saw above-average CF across most of central and northern Europe, and below-average CF across southern Europe and Iceland. This reflects a contrast in surface solar radiation seen across Europe in June. During this month, positive surface solar radiation anomalies, of up to 70 W/m2, were seen in parts of central Europe and Scandinavia, and negative anomalies, as low as -40W/m2, in southern Europe. In November, the solar CF anomalies also corresponded to anomalies in surface solar radiation. Below-average solar radiation and solar PV CF were seen across central Europe, and particularly the Alps, and parts of southeastern Europe and eastern Scandinavia.
Run-of-river hydropower
Figure 5. Average run-of-river hydropower capacity factor anomaly (%) for June 2023 (left) and November 2023 (right), relative to the respective monthly average for the 1991-2020 reference period and expressed as a percentage of this average. Countries shaded in grey are those for which no data are available. Data source: C3S Climate and Energy Indicators for Europe.

In June, below-average run-of-river hydropower CF was seen across much of Europe, while Italy saw well-above-average run-of-river hydropower CF. This reflects positive precipitation anomalies and above-average river flows in Italy in May and June. In November, run-of-river hydropower CF was above average across most of Europe. For most areas, it was 10–20% above average, but it was as much as 57% above average in Portugal and 39% in Switzerland, associated with well-above-average precipitation anomalies and high river flow. The exceptions were Norway and Romania, where slightly-below-average run-of-river hydropower CF was observed, linked to slightly-below-average river flow. More on hydrological conditions in Europe can be found in the ‘Precipitation’ and ‘River flow’ sections.
Climate-driven electricity demand
Figure 6. Average climate-driven electricity demand anomaly (%) for June 2023 (left) and November 2023 (right), relative to the respective monthly average for the 1991–2020 reference period and expressed as a percentage of this average. Countries shaded in grey are those for which no data are available. Data source: C3S Climate and Energy Indicators for Europe.

Climate-driven electricity demand can be linked to factors such as a reduced need for heating when temperatures are warmer than average during winter, and increased need for air conditioning when temperatures are warmer than average during summer.
While the climate-driven electricity demand for the year as a whole was generally below average, it was slightly above average in June across much of western and central part of Europe. These areas correspond to those that saw above-average temperatures during June. However, warmer-than-average temperatures over Scandinavia in the same month corresponded to slightly below-average demand. Later in the year, demand over northern Europe was generally above average. From October to December, temperatures in Scandinavia were much colder than average, reflected in well-above-average demand. In November, however, southern Europe saw below-average demand associated with above-average temperatures for the time of year.
Changes in energy statistics through 2023
While climate conditions can drive demand for additional energy, to some extent they can also compensate through increased potential to generate power. For example, in summer, demand can be higher, but this can be balanced out by additional solar power generation.
Comparison of energy statistics aggregated over a region can highlight links and compensation between climate-driven electricity demand and renewable power resources at a larger geographical scale than that of individual countries[8]. Here, statistics are reported for a region of central Europe, defined here as France, Belgium, Luxembourg, the Netherlands, Germany and Switzerland. These countries are chosen because of their relatively similar climatic conditions in 2023.
Figure 7. Changes in energy statistics for run-of-river hydro-power capacity factor (CF), solar photovoltaic CF, onshore wind CF and anomalies in climate-driven electricity demand for each day in 2023. The daily average CF for the 1991–2020 reference period is indicated by the dashed grey line. Climate-driven electricity demand is expressed as a percentage of the 1991–2020 reference period. Values are averaged across a region of central Europe (here defined as France, Belgium, Luxembourg, the Netherlands, Germany and Switzerland). Data source: C3S Climate and Energy Indicators for Europe.
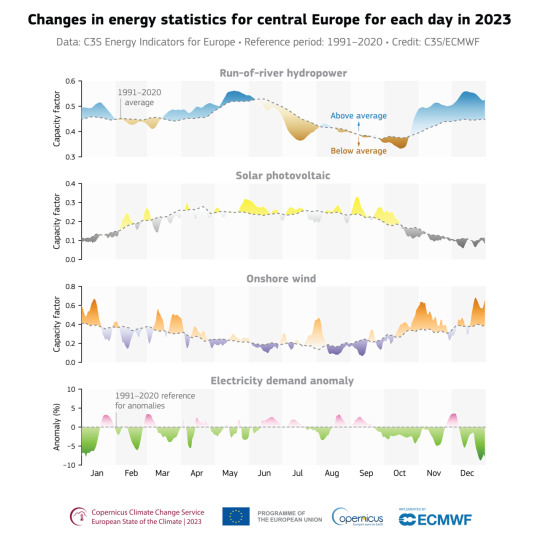
Averaged across six central European countries, the climate-driven electricity demand was below average for most of the year. January, February, October and December saw the largest negative anomalies, with daily values reaching around 7–9% below average in January and December. The lower demand reflected the higher-than-average temperatures during these months and the associated reduced demand for heating. Apart from two weeks in late November and early December, demand was persistently below average from late September until the end of the year.
Climate-driven electricity demand was most above average at the end of January, and in early March, late August, and early December; up to around 3.5% above average during all these periods. The two longest periods of above-average demand were early June to mid-July and mid-August to mid-September. These periods coincided with above-average summer temperatures and the associated demand for air conditioning.
Solar PV CF was above average during several periods in February, May, September and October. September saw the largest positive monthly anomaly, of 18% above average, with daily CF values reaching around 0.3. The increased solar PV CF in September partially compensated for the higher electricity demand.
Onshore wind CF was variable during 2023, but generally above average. There was a long period of above-average CF throughout October and November, which saw daily CF values peaking at around 0.65. November also saw the largest monthly onshore wind CF anomalies, at around 45% above average for the month as a whole. This increase in onshore wind CF was associated with storm activity across much of Europe. February, June and a period from mid-August to the beginning of October saw below-average onshore wind CF, except for a short period of slightly above average anomalies in mid-September. November’s storms continued into December; the associated above-average precipitation and river flow led to above average run-of-river hydropower CF during these two months. At its peak, it reached almost 20% above average, after being close to average for much of the year. July was the only month that saw below-average hydropower CF; as much as 12% below average for the month as a whole.

Monitoring wind, solar , and hydropower is crucial for optimizing the potential for renewable energy generation. Accurate climate monitoring supports strategies to accelerate the transition to sustainable energy sources, fostering both environmental protection and economic growth.
#climate-driven electricity demand#clean energy#capacity factor (CF)#potential power production#onshore wind power#solar photovoltaic (PV)#run-of-river hydropower#and on electricity demand.#energy transition#renewable energy sources#energy sources
0 notes
Text
Biomass Power Generation Market: Assessing Market Dynamics

Global biomass power generation market is expected to grow due to the advancements in biomass power generation techniques during the forecast period of 2024-2028.
According to TechSci Research report, “Biomass Power Generation Market - Global Industry Size, Share, Trends, Opportunity, and Forecast, 2018-2028”, the global biomass power generation market is anticipated to register 4.97% CAGR during the forecast period. During the projected period, the worldwide biomass power generating market will be driven by the rising need for environmentally friendly and sustainable sources of energy generation. Biomass power generation is becoming more widely used in significant emerging nations worldwide. A dependable, economical, and secure source of electricity generation is biogas.
It has been applied to advance economic growth and expand access to electricity. The main players in the global biomass power generation market are concentrating on innovation to expand their business potential. Since biomass produces no carbon emissions, it decreases the reliance on fossil fuels for energy production. Additionally, by offering tax incentives, loan guarantees, and other forms of support, governments around the world are boosting their investments in biomass power generation.
There are many governments initiative to boost the market. For instance, an agreement was signed between MoPNG and companies or institutions to build 5,000 CBG plants by 2024 with a total capacity of 15 tons of CBG per year as part of the biofuels policy to promote ethanol blending in vehicle fuel. Owing to this agreement the global biomass power generation market is further anticipated to expand in the forecast period of 2024-2028.
Browse over XX Market Data Figures spread through XX Pages and an in-depth TOC on "Global Biomass Power Generation Market”
https://www.techsciresearch.com/report/biomass-power-generation-market/15679.html
Global biomass power generation market is segmented based on technology, feedstock, end-user, fuel type, and region. Based on technology, the market is divided into combustion, pyrolysis, gasification, anaerobic digestion, landfill gas (LFG), and others. Based on feedstock, the market is divided into urban residue, municipal solid waste (MSW), agricultural and forest residue, energy crops, woody biomass, and others. Based on end-user, the market is divided into industrial, residential & commercial, utilities. Based on fuel type, the market is divided into solid, liquid, gaseous. Based on region, the market is further bifurcated into North America, Asia Pacific, Europe, South America, and Middle East & Africa.
Based on technology, the combustion segment dominated the market. The trend is expected to continue in the future with the segment registering a steady growth rate over the forecast period. In comparison to other sophisticated biomass power technologies, the combustion technology operates more economically and is simpler. This is anticipated to increase the market demand for combustion technology over competing technologies.
Based on feedstock, municipal solid waste (MSW) will dominate the market in the forecast period. Throughout the forecast period, the category will continue to grow at a constant CAGR and maintain its dominant position. Municipal solid waste is being used more widely than liquid biofuels.
Based on end-user, industrial segment will dominate the market in the forecast period. The industrial sector is one of the largest consumers of electricity in the world. In fact, it accounts for about 30% of global electricity consumption. The global economy is growing, and this is leading to an increase in industrial activity. As a result, there is a growing demand for electricity to power factories, machines, and other equipment. Due to which the industrial segment is growing rapidly.
Based on region, Asia Pacific will dominate the market in the forecast period. In growing and expanding economies like China and India, urbanization and fast industrialization are gaining traction due to which the demand for power generation is high in these areas.
Key market players in the global biomass power generation market are:
Mitsubishi Power Ltd.
Suez SA, Xcel Energy Inc.
Ramboll Group A/S
Babcock & Wilcox Enterprises, Inc.
Orsted A/S
Ameresco Inc
General Electric Company
Veolia Environnement S.A.
Vattenfall AB
Download Free Sample Report
https://www.techsciresearch.com/sample-report.aspx?cid=15679
Customers can also request for 10% free customization on this report.
“Future energy consumption will rise because of rising industrialization, development, and population growth. However, as fossil fuels produces greenhouse gas emissions, the risks related to climate change are also rising. The globe's increasing need for energy and concern for the environment will jointly drive the growth of the biomass generating market because biomass power generation will help the world meet its dual objectives of rising energy consumption and environmental protection.
Additionally, governments throughout the world are implementing laws that are supportive of biomass power generation to promote it to meet energy needs, reduce emissions, save money, and the environment by reducing reliance on fossil fuels”, said Mr. Karan Chechi, Research Director with TechSci Research, a research-based global management consulting firm.
“Biomass Power Generation Market – Global Industry Size, Share, Trends, Opportunity, and Forecast, 2018–2028 Segmented By Technology (Combustion, Pyrolysis, Gasification, Anaerobic Digestion, Landfill gas (LFG), and Others), By Feedstock (Urban Residue, Municipal Solid Waste (MSW), Agricultural and Forest Residue, Energy Crops, Woody biomass, and Others), By End-User (Industrial, Residential & Commercial, and Utilities), By Fuel (Solid, Liquid, and Gaseous), By Region and Competition” has evaluated the future growth potential of biomass power generation market and provides statistics & information on market size, structure, and future market growth. The report intends to provide cutting-edge market intelligence and help decision makers take sound investment decisions. Besides, the report also identifies and analyzes the emerging trends along with essential drivers, challenges, and opportunities in global biomass power generation market.
Browse Related Research Reports:
Substation Automation Market
https://www.techsciresearch.com/report/substation-automation-market/16542.html
Smart Electric Meter Market
https://www.techsciresearch.com/report/global-smart-electric-meter-market/2653.html
stationary lead acid battery market
https://www.techsciresearch.com/report/stationary-lead-acid-battery-market/16426.html
Contact
TechSci Research LLC
420 Lexington Avenue,
Suite 300, New York,
United States- 10170
M: +13322586602
Email: [email protected]
Website: https://www.techsciresearch.com
#Biomass Power Generation Market#Biomass Power Generation Market Size#Biomass Power Generation Market Share#Biomass Power Generation Market Trends#Biomass Power Generation Market Growth
0 notes
Link
1 note
·
View note
Text
Astute Analytica, a leading market research firm, released its latest comprehensive Moringa Seeds & Biomass Market research report. This detailed analysis provides an extensive assessment of the current market, including valuable insights on market valuation, key drivers, emerging trends, lucrative opportunities, regional insights, competitive landscape, and detailed segmentation.
0 notes
Text
Environmental Considerations for Tree Removal

Trees are an integral part of our ecosystem, providing numerous benefits to the environment and our communities. However, there may be instances where tree removal becomes necessary, whether due to safety concerns, infrastructure development, or other factors. In such cases, it is crucial to consider the environmental implications and take appropriate measures to minimize the impact.
Assessing the Necessity of Tree Removal
Before deciding to remove a tree, it is essential to carefully evaluate the situation. Consult with arborists or tree care professionals to determine if the tree poses a genuine threat or if it can be preserved through proper pruning, maintenance, or other remedial actions. Trees may need to be removed if they are diseased, structurally unsound, or pose a danger to nearby buildings, power lines, or public safety.
Examining the Ecological Impact
Trees play a vital role in maintaining the health of our environment. They help clean the air by absorbing carbon dioxide and releasing oxygen, provide shade and regulate temperatures, prevent soil erosion, and offer habitats for various species of wildlife. When considering tree removal, it is crucial to assess the potential impact on the local ecosystem. Evaluate the role the tree plays in the surrounding environment and consider the consequences of its removal, such as the loss of habitat, reduced biodiversity, and the disruption of the local microclimate.
Prioritizing Sustainable Practices
If tree removal is deemed necessary, focus on implementing sustainable practices to minimize the environmental impact. Explore options for relocating the tree to a more suitable location, if possible. This not only preserves the tree but also helps maintain the ecological balance of the area. When relocation is not feasible, consider replanting or replacing the removed tree with a species suitable for the local climate and ecosystem. This helps maintain the overall tree canopy and ensure the long-term sustainability of the environment.
Proper Disposal and Recycling
When a tree is removed, it is essential to dispose of the remains responsibly. Avoid simply discarding the tree parts, as this can contribute to waste and landfill. Instead, explore options for recycling or repurposing the tree material. Wood from the tree can be used for various purposes, such as furniture, mulch, or even as fuel for biomass energy production. This not only reduces waste but also promotes a circular economy and supports sustainable resource management.
Compliance with Regulations and Permits
In many cases, tree removal is subject to local or regional regulations and may require obtaining the necessary permits. Research the relevant laws and regulations in your area and ensure compliance before proceeding with the removal process. This may involve obtaining approval from local authorities, adhering to specific tree removal guidelines, or following specific protocols for protected or heritage trees.
By considering these environmental factors, you can contribute to the preservation and sustainable management of our urban and natural landscapes. Responsible tree removal practices not only protect the local ecosystem but also demonstrate a commitment to environmental stewardship and the long-term well-being of our communities.

When choosing a tree service in Hagerstown, MD, it's important to consider a few key factors. First and foremost, look for a tree service in Hagerstown, MD, that is licensed, insured, and has a proven track record of providing safe and reliable tree service. A reputable tree service in Hagerstown, MD, should have the necessary certifications and training to handle even the most complex tree-related tasks, from pruning and trimming to removal and stump grinding.
Secondly, it's crucial to choose a tree service in Hagerstown, MD, that uses modern, well-maintained equipment and employs trained professionals. This ensures that the job is completed efficiently and with minimal disruption to your property. Additionally, a reliable tree service in Hagerstown, MD, should be willing to provide references and discuss their work process with you, giving you the confidence that you're making the right choice.
Finally, consider the company's customer service and communication. A good tree service in Hagerstown, MD, will be responsive to your needs, provide transparent pricing, and work with you to ensure that your expectations are met. By taking the time to research and compare different tree service providers in Hagerstown, MD, you can find the perfect partner to keep your trees healthy and your property looking its best.
Warren Henry Tree Service
21250 Leitersburg Pike, Hagerstown, MD 21742
(240) 730–3225
https://warrenhenrytreeservice.com/
0 notes
Text
Quantitative assessment of strain isolates and microbiomes using fast MS/MS-free metaproteomics
Microbial proteomics and metaproteomic studies rely heavily on mass spectrometry. Standard liquid chromatography/tandem mass spectrometry-based methods for protein identification and quantitation exhibit lengthy analysis time. Here, we report on the implementation of the previously developed DirectMS1 approach for metaproteomics studies that provides a unique combination of accurate protein quantitation and rapid analysis time. We validated our method using a series of proteome-wide analyses of bacterial samples including strain isolates, mock microbiomes composed of bacteria spiked at known concentrations and human fecal microbiomes. We demonstrated that the developed two-stage search algorithm identifies the bacterial isolate species with an accuracy of 95%, when no prior information on the sample is available. Microbiome composition was resolved at the genus level with the mean difference between the actual and identified microbiome components of 12%. Pearson coefficient of up to 0.97 was achieved in estimates of strain biomass change in mock microbiome samples. By the example of Rhodococcus biodegradation of n-alkanes, phenols and its derivatives, we showed that our approach effectively characterizes changes in the activity of metabolic pathways of strain isolates. For the benchmarking, the changes in biodegradation activity were also assessed using the standard label-free and TMT DDA approaches. http://dlvr.it/T5Z4SB
0 notes
Last Seen Blogs

divaminor
Off-Key Tumbles of F. Minor

honestsister
Barret Wallace was Right

okoyoko
Oko's cave

autisticbugboy
lance ‘this is fierce wretched’ sweets