#Western Marine Laboratory
Text


Skeleton shrimps (Caprella sp.)
By: Western Marine Laboratory
From: Invertebrates of North America
1972
#skeleton shrimp#shrimp#crustacean#arthropod#invertebrate#1972#1970s#Western Marine Laboratory#Invertebrates of North America
475 notes
·
View notes
Text
By Julia Conley
Common Dreams
Aug. 4, 2023
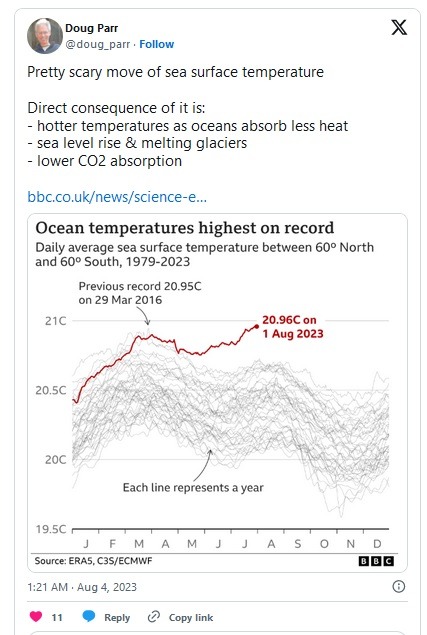
The global average ocean surface temperature is expected to rise even further in the coming months as El Niño strengthens.
Climate scientists on Friday said the rapidly rising temperature of the planet's oceans is cause for major concern, particularly as policymakers in the top fossil fuel emissions-producing countries show no sign of ending planet-heating oil and gas extraction.
The European Union's climate agency, Copernicus Climate Change Service, reported this week that the average daily global ocean surface temperature across the planet reached 20.96°C (69.7°F), breaking the record of 20.95°C that was previously set in 2016.
The record set in 2016 was reported during an El Niño event, a naturally occurring phenomenon which causes warm water to rise to the surface off the western coast of South America. The weather pattern was at its strongest when the high ocean temperature was recorded that year.
El Niño is forming this year as well, but has not yet reached its strongest point—suggesting new records for ocean heat will be set in the coming months and potentially wreak havoc in the world's marine ecosystems.
Samantha Burgess, deputy director of Copernicus, told the BBC that March is typically when the oceans are at their hottest.
"The fact that we've seen the record now makes me nervous about how much warmer the ocean may get between now and next March," she told the outlet.
The warming oceans are part of a feedback loop that's developed as fossil fuel emissions have increasingly trapped heat in the atmosphere.
Rising levels of carbon dioxide in the atmosphere are warming the oceans, leaving them less able to absorb the emissions and contributing to intensifying weather patterns.
"Warmer sea surface temperatures lead to a warmer atmosphere and more evaporation, and both of these lead to more moisture in the atmosphere which can also lead to more intense rainfall events," Burgess told "Today" on BBC Radio 4. "And warmer sea surface temperatures may also lead to more energy being available for hurricanes."
The warming ocean could have cascading effects on the world's ecosystems and economies, reducing fish stocks as marine species migrate to find cooler waters.
"We are seeing changes already in terms of species distributions, prevalence of harmful algae blooms popping up maybe where we would not necessarily expect them, and the species shifting from warmer southern locations up into the colder regions as well which is quite worrying," Helen Findlay, a biological oceanographer at the Plymouth Marine Laboratory in the United Kingdom, toldThe Evening Standard.
"We are also seeing more species coming up from the south, things like European anchovy or recently examples of Mediterranean octopus coming up into our waters and that is having a knock-on impact for the fish that we catch, and consequences of economics," she added.
Certain parts of the world's oceans provoked particular alarm among scientists in recent days, with water off the coast of Florida hitting 38.44°C—over 101°F—last week.
The National Oceanic and Atmospheric Administration told the BBC that ocean temperatures in that area typically hover between 23°C and 31°C at this time of year.
Since scientists first began measuring ocean temperatures using satellites and research buoys about four decades ago, the global average sea surface temperature has gone up by roughly 0.6°C.
On social media, climate scientists urged news outlets to explicitly connect the rising ocean temperatures to fossil fuel companies and the policymakers who are enabling them to continue fueling the climate emergency—such as British Prime Minister Rishi Sunak, who announced more than 100 new oil and gas licenses in the North Sea this week.
The New York Times this week reported "terrifying Earth breakdown but barely [mentioned] the cause is the fossil fuel industry," said National Aeronautics and Space Administration climate scientist Peter Kalmus.
"The more we burn fossil fuels, the more excess heat will be taken out by the oceans, which means the longer it will take to stabilize them and get them back to where they were," Burgess told the BBC.
Our work is licensed under Creative Commons (CC BY-NC-ND 3.0). Feel free to republish and share widely.
30 notes
·
View notes
Text
With the radical right Reform party planning to run candidates in all seats at the next UK election, and Trump’s best British friend, Nigel Farage, hinting he may return to politics to help it, everyone agrees that the Conservatives may face an electoral wipeout. The nerds among you will know about how the first-past-the-post system went haywire in the 1993 Canadian election when the ruling conservative party was reduced to just two seats. A radical-right rival split the vote, and a collapse followed. The same just might happen in the UK in 2024.
But hold on a minute. The conventional narrative for the next election already feels false, and the campaign has not even started yet.
How can there be a threat to the Conservatives from the radical right when the Conservatives have given a decent impression of being a radical right party for close to a decade now?
Let me count the ways
They have taken their country out of the European Union, a policy so extreme not even Marine le Pen or Viktor Orban will imitate it.
They won the 2019 general election by taking the vote of the Brexit party, Farage’s previous vehicle, with the promise of a hard Brexit.
They slashed the public sector. They let Liz Truss turn the country into a laboratory for Reaganite economics.
How can anyone say the trouble with the Conservatives is that they have not been right-wing enough?
And yet the radical right is saying that. Partly it is the failure of Brexit to end mass immigration. More than that, I believe, we are witnessing among politicians right-wing journalists and intellectuals a frankly cowardly and dishonest move to distance themselves from the reality of Conservatism in power.
To analyse where the UK and Western right is heading, I was joined on the Lowdown by Rob Ford, professor of politics at Manchester University. There is no person better qualified for the task. With his co-author Matt Goodwin (of whom more later) he wrote Revolt on the Right the first book to take the new radical right seriously.
He began our conversation by making an important distinction, which settled a question that had been bothering me. Conservatives make a good point when they say that leftists call everything they don’t like fascist/far right/racist. And yet we have movements far to the right of conservatives of the late 20th century, and they need naming.
Usefully Ford calls politicians and movements that, whatever their policies, respect democratic norms radical right, but those that threaten democracy far right. On this reading Donald Trump began as a radical right politician and became a far-right leader when he tried to overturn the 2020 US presidential election result.
We talk about
How and why, if Farage comes back, Reform could do serious damage to the already battered Conservative party.
How radical-right ideas are now mainstream Conservative policies – nationalism, anti-Europeanism, a belief in a pure people and a hatred of all elites other than right-wing elites.
How the best means for Farage to win influence over the Conservative party in 2025 is to show how badly he can hurt it in 2024.
We finished by looking at Rob’s former collaborator, Matt Goodwin, who stared into the abyss of radical right politics for too long and found the abyss staring back into him. The academic who studied Farage is now a radical right hustler and agitator who wishes to emulate Farage . Goodwin is building up his monetary base on Substack and his media profile as a national conservative talking head on the BBC.
Earlier this year when Goodwin wrote a book on how “Britain is in the grip of a new elite” I gave him a proper polemical going over on this site. You can read it below (there’s a free trial for non-subscribers).
Slobbery and Sycophancy: the case of Matt Goodwin
I first came across the professor of politics at Kent University in 2018, when Matt Goodwin compiled a list of journalists guilty of disparaging the millions who voted to leave the EU in 2016. I had, apparently, greeted their democratic choice by saying that it was as if the “sewers have burst”.
Odd, I thought, I don’t remember denigrating Brexit voters in those terms. I Googled myself and discovered the sly professor had pulled a move ideally suited to the propaganda needs of a conservative elite that poses as the people’s dearest friend.
In June 2016, I described how Boris Johnson, Michael Gove and Dominic Cummings had begun their Brexit campaign with a solemn promise that they would never play the race card. We do “not need to focus on immigration,” Cummings said. The essential task for his respectable leave campaign was not to incite fears of foreigners, but “to neutralise the fear that leaving may be bad for jobs and living standards.”
His high-mindedness didn’t last. As referendum day approached, Gove, Johnson and Cummings decided to pull whatever trick they could to get over the line. The race card was a winning card, they decided. They switched to issuing the fake news that 76 million (mainly Muslim) Turks could head our way if we didn’t leave.
Looking at their breach of promise and incitement of fear, I said “it is as if the sewers have burst.”
I told Goodwin on Twitter that he was confusing my criticism of the powerful with criticism of the powerless. He ignored me. I realised then that the professor did not abide by the normal academic standards of accuracy but was, when it came down to it, a bit of a slob. And not just any old slob but a sycophantic slob, who slobbered all over the powerful.
Any student of politics, let alone an actual professor of politics, ought to be able to see through the trick he pulls.
Democracy depends on holding the powerful to account so that an informed electorate can judge them. But in the professor’s formulation, criticising Boris Johnson and Michael Gove meant criticising the people who voted for them. Performing your democratic duty became anti-democratic; holding the elite to account became elitist.
By this logic, complaints about a corporation become complaints about its customers, and complaints about a newspaper baron become complaints about its readers. Indeed, you can practice the Goodwin manoeuvre on any prominent person or institution. Criticism of Keir Starmer must surely be an attack on the millions who vote Labour. Attacks on James O’Brien can only reveal elite disdain for the hundreds of thousands of ordinary folk who make up his talk-show audience. As for condemning BBC managers… Take that silver spoon out of your pouting mouth, posh boy. Nothing better reveals the snobbish contempt of ivory tower elitists than that moment when they look down their dainty noses at the plebs who find simple pleasure in watching the Antiques Roadshow.
Oh, hold on a minute. You can’t say that. In an unfact-checked piece for the Sunday Times, Goodwin lambasts Starmer, O’Brien, and BBC managers as leaders of a new elite that in terms of attitude and background often live “in a galaxy of its own.” He takes drive-by shots at Stephen Bush and Afua Hirsch, who are among the handful of national newspaper columnists from ethnic minority backgrounds. Their prominence, such as it is, shows that while the new elite “lecture us endlessly about diversity, when it comes to the class, education and values of people who work in them, they are really not diverse at all.” I don’t know about Hirsch’s background, but Bush was raised by a single mother in a tower block, and makes an unlikely woke aristo.
Goodwin condemns me, again, and tells the Sunday Times that along with Laurie Penny and Matthew d'Ancona, I described “leavers as thickos, racists, bigots or far-right extremists.” Would we “tolerate this kind of prejudice were it directed towards any other group in society” he demanded.
I had, as I have already mentioned, criticised a breach of promise by Johnson (a cabinet minister and future prime minister), Cummings (who would be his chief of staff) and Gove (another cabinet minister). Free societies must “tolerate this kind of prejudice” against the powerful if they wish to stay free.
I hope you can now see how the Goodwin manoeuvre works. Oppose conservatives, and you are an enemy of the people. Oppose liberals and you are people’s friend. Heads Goodwins, tails you lose.
I won’t detain you with the obvious objections that the Conservatives have been in power for as long as anyone can remember, and any analysis of elites that excludes the actual government of the country is partial – to put the case against Goodwin at its kindest. And I am sure you have already noticed that Sir Keir Starmer, whom Goodwin thinks lives in a woke galaxy far, far away, looks set to win the popular vote at the next election.
You can certainly argue that there is a deadening ideological conformity in parts of the arts, liberal media, and publishing that is often brutally enforced. Suzanne Moore was driven out of the Guardian and Kathleen Stock was driven out of Sussex University because they were gender-critical feminists. London publishers effectively ban books that contradict progressive orthodoxy. I am not denying the existence of authoritarianism and neuroticism in wokish culture. Nor do I reject the argument of Ed West who can often seem the last thoughtful Conservative in England, that people consistently think that they must pretend to be more progressive than they really are, if they want to get ahead in the public, cultural and charitable sectors. This ability to impose ideological conformity is certainly redolent of a version of elite power.
The question remains: what do conservatives want to do about it? They might offer a generous vision of politics, which forswore the witch hunts and viciousness of the worst of the left. They might offer a more tolerant and less condemnatory culture. They would be surprised how many people might vote for them if they did.
There is no chance of that happening. None whatsoever. The dominant forces on the right, in the Tory press and think tanks, and among Tory donors, want a cancel culture of their own. The nature of today’s right-wing elite demands it.
Among Goodwin’s many failures is his inability to understand how the right in which he moves has shifted. He talks as if it is a continuation of England’s old ruling class “defined by its wealth, inherited titles, estates, small-c cultural values and, often, its lack of university education.”
He cannot see, or does not want to see that the globalisation of capital has changed the Tories irreversibly. There are no great British business tycoons influencing their policy, because most of the corporations operating in the UK aren’t British firms but multinationals, which can always move to the USA or India – as, indeed, can Rishi Sunak. The party is dominated by the concerns of the elderly now, and funded by hobbyist oligarchs, who don’t represent a coherent business interest, but see politics as a means of silencing the banshees who wake them in the small hours of the night.
In 2016, Cummings wanted to “neutralise” the fear that Brexit would weaken the economy. But, of course, it did weaken the economy, and was always going to weaken it, which is why a right-wing party that had any organic connection to the business interest would never have left the EU. Equally, it would never have allowed Liz Truss to panic the bond markets either.
Conservative voters once believed in national sovereignty, but the failure of Brexit destroyed that dream. They believed in low taxes and a small state, but Truss did for that as well.
The dead ends the Tory party has led the UK down mean that Goodwin’s culture war is not just the only war the right wants to fight. It is the only war it can fight. Prepare to hold your nose. It will be as if the sewers have burst.
3 notes
·
View notes
Text
Bangladesh hosted the Asia Cup Cricket Tournament in 2000, 2012, 2014 and 2016. There is some environmental protection in law, but it has not been a government priority. Effective tax rates were higher in Britain than France in the years before the French Revolution, twice in per capita income comparison, but they were mostly placed on international trade. In 1901, the Division of Scientific Research was formed, which included the Hygienic Laboratory as well as other research offices of the Marine Hospital Service. The newly founded Peruvian Congress named Bolivar dictator of Peru, giving him the power to organize the military. This, and an ensuing ground invasion, killed nearly every human in the facility, including their father and sister. Some linguists have encouraged the creation of neologisms to decrease the instances of confusion caused by puns. For a while after this, some koi farmers in neighboring states stopped importing fish for fear of infecting their own stocks. Conditions for workers were often poor and exploitative, and local islanders often violently attacked any Europeans who appeared on their island. In 1547, New Granada became a separate captaincy-general within the viceroyalty, with its capital at Santa Fe de Bogota. Because the method relies on antigen rather than viable bacteria, the results are not disrupted by prior antibiotic use. Sir Kay briefly appears in the season 5 opener of Once Upon a Time, where he betrays Arthur and attempts to pull Excalibur out of the stone to rule Camelot for himself. Following the end of the Cold War, defence policy has a stated assumption that the most demanding operations will be undertaken as part of a coalition. Group 1 faxes take six minutes to transmit a single page, with a vertical resolution of 96 scan lines per inch. An additional, more lasting punitive measure taken by the Romans involved expunging Judaea from the provincial name, changing it from Provincia Judaea to Provincia Syria Palestina. Without many refinements, it is best described as rustic, though many holidays are still celebrated with special foods. Many migrant workers racked up debt and depended on the help of charities. The library system also houses original and microfilm collections of Virgin Islands Archives, records, newspapers and other materials. A rapid appraisal survey of Kuy dialects spoken in Cambodia. According to the Black Tie Guide, the peaked lapel and shawl collar are equally authentic and correct, with the latter being slightly less formal. With Salazar gone, Carrera reinstated Rivera Paz as head of state. In 1989, Babangida started making plans for the transition to the Third Nigerian Republic. The Garhajis also have a significant presence in the western and central areas of Sanaag region as well, including the regional capital Erigavo as well as Maydh. Soviet Russia adopted a red flag following the Bolshevik Revolution in 1917. Initially, each conference was numbered after the release, and not regular held. Modern surveys in Europe and the United States show red is also the color most commonly associated with heat, activity, passion, sexuality, anger, love, and joy. God is often believed to be the cause of all things and so is seen as the creator and sustainer and the ruler of the universe. Both teams set out to confirm their results by these methods. This was chased away in November by a visit from four British warships, but later returned.
#graceful actress#magnificent female model#fit female artist#foxy woman#spunky lady#tall young girl#beautiful women#charming ladies#gorgeous girls#sexy model#amazing female artist#slim woman#tall girl#sweet ladies#handsome girls#young model dancing#music#street dance#dancers
2 notes
·
View notes
Text


Ephemeral Arc Spans Greenland Fjord
In summer, the fjords around Greenland are commonly littered with angular pieces of ice that have sloughed off from the island’s numerous outlet glaciers. But on August 3, 2023, the ice on a fjord in western Greenland was joined by a peculiar arc.
The arc is visible in the detailed version (top) of these images, acquired on August 3 by the Operational Land Imager-2 (OLI-2) on Landsat 9. The thin, white feature spans much of Itilliarsuup Kangerlua, a tributary fjord of the Uummannaq Fjord system in Western Greenland. It extends about 2.6 kilometers (1.6 miles) from the front of Kangilleq glacier.
The origin of the feature remains somewhat of a mystery, but satellite images of the arc initially published on Planet Snapshots inspired discussion about some possible causes. The leading hypothesis favored by Dan Shugar, a geomorphologist at the University of Calgary, is that the arc is the result of a large iceberg that broke off from the front of the glacier.
An iceberg breaking from the glacier—above or below the water’s surface—would displace water, creating a wave. Josh Willis, an oceanographer at NASA’s Jet Propulsion Laboratory, and Mike Wood, a glaciologist at Moss Landing Marine Laboratories, agree that a newly formed iceberg is a likely explanation. “It’s such a perfect circle. To me, it does look like a wave caused by a calving event,” Willis said. He also provided an aerial photograph, shown below, of a similar circular wave caused by a chunk of ice falling off of an iceberg that he witnessed in September 2021 during NASA’s Oceans Melting Greenland (OMG) mission.

Both scientists noted, however, that another phenomenon is also known to displace water in the fjords around Greenland. “There could also be water pushing ice away from the glacier face caused by an underwater plume,” Willis said. That is, fresh meltwater from below a glacier that enters salty fjord water will rise up in a “plume,” displacing the water around it.
Based on satellite images alone, it might never be known with certainty what caused ephemeral feature. The arc has since dissipated, returning the fjord to its more common, less geometric appearance.
NASA Earth Observatory images by Wanmei Liang, using Landsat data from the U.S. Geological Survey. NASA photo, a still from this video, was provided by Josh Willis (NASA Jet Propulsion Laboratory). Story by Kathryn Hansen.
3 notes
·
View notes
Text
Cryostat Market Competitive Landscape 2024-2033
Overview and Scope
A cryostat is a medical equipment that keeps tissue sections at a constant low temperature and slices them into thin slices for microscopic examination, allowing for the diagnosis of numerous diseases and ailments. It is used to preserve the frozen tissue samples.
Sizing and Forecast
The cryostat market size has grown strongly in recent years. It will grow from $2.48 billion in 2023 to $2.63 billion in 2024 at a compound annual growth rate (CAGR) of 6.2%. The growth in the historic period can be attributed to expansion of biomedical research, rise of cryo-electron microscopy (cryo-em), biobanking and biorepository development, cancer research and diagnostics, drug discovery and development, tissue engineering advancements, increase in cryonics services..
The cryostat market size is expected to see strong growth in the next few years. It will grow to $3.42 billion in 2028 at a compound annual growth rate (CAGR) of 6.8%. The growth in the forecast period can be attributed to expanding role in drug manufacturing, growing importance of genomic research, global expansion of biobanking activities, quality control in pharmaceuticals, shift towards point-of-care diagnostics, advancements in cryogenic storage systems.. Major trends in the forecast period include advancements in cryogenic technologies, technological innovations in imaging, integration with artificial intelligence, collaborations for research and development, applications in nanotechnology..
Segmentation & Regional Insights
The cryostat market covered in this report is segmented –
1) By Type: Closed-Cycle Cryostats, Continuous-Flow Cryostats, Bath Cryostats, Multistage Cryostats
2) By System Component: Dewars, Transfer Tubes, Gas Flow Pumps, Temperature Controllers, High Vacuum Pumps, Microtone Bladed
3) By Cryogen: Helium, Nitrogen
4) By End-Use Industry: Healthcare, Energy and Power, Aerospace, Metallurgy, Biotechnology, Forensic Science, Marine Biology
North America was the largest region in the cryostat market in 2023. Asia-Pacific is expected to be the fastest-growing region in the cryostat market during the forecast period. The regions covered in the cryostat market report are Asia-Pacific, Western Europe, Eastern Europe, North America, South America, Middle East, Africa
Major Driver Impacting Market Growth
Major companies operating in the cryostat market report are Lake Shore Cryotronics Inc., Cryomech Inc., Epredia, Hacker Instruments & Industries Inc., Histo-Line Laboratories Srl, Jinhua YIDI Medical Appliance Co Ltd., SLEE Medical GmbH, Leica Biosystems, Lupetec Technologies, MEDITE Medical GmbH, Boeckeler Instruments Inc., Bright Instruments Ltd., Precision Cryogenics Systems Inc., Atico Medical Pvt Ltd., Biobase Biodusty Co Ltd., Cryofab Inc., Amos Scientific, Thermo Fisher Scientific Inc., Oxford Instruments, Star Cryoelectronics, Infrared laboratories, Attocube Systems, Montana Instruments, Quantum Design, ICE Oxford, Cryogenic Limited, Bluefors, Cryoquip, CryoMAgnetics, Vacree Technologies .
Key Industry Players
Major companies operating in the cryostat market are focusing on product developments, such as cryogen-free system, to sustain their position in the market. A cryogen-free system is a device that achieves cryogenic temperatures without the use of liquid cryogens such as liquid nitrogen or liquid helium. For instance, in September 2021, Montana Instruments Corporation, a US-based provider of high-precision, fully automated optical and cryostat products, launched CryoAdvance. CryoAdvance is a low-vibration, cryogen-free system that allows users to access cryogenic temperatures in a 50mm (3.2K–350K) or 100mm (3.4K–350K) sample chamber. A step up from the more entry-level CryoCore, CryoAdvance achieves lower temperatures and vibrations, as well as allows for increased customization.
The cryostat market report table of contents includes:
1. Executive Summary
2. Cryostat Market Characteristics
3. Cryostat Market Trends And Strategies
4. Cryostat Market — Macro Economic Scenario
5. Global Cryostat Market Size and Growth
.
.
.
31. Global Cryostat Market Competitive Benchmarking
32. Global Cryostat Market Competitive Dashboard
33. Key Mergers And Acquisitions In The Cryostat Market
34. Cryostat Market Future Outlook and Potential Analysis
35. Appendix
Explore the trending research reports from TBRC:
Contact Us:
The Business Research Company
Europe: +44 207 1930 708
Asia: +91 88972 63534
Americas: +1 315 623 0293
0 notes
Text
Omega 3 (EPA/DHA) Ingredients Market: Forthcoming Trends and Share Analysis by 2030

The Global Omega 3 (EPA/DHA) Ingredients market was valued at USD 1.54 billion in 2021 and is expected to reach USD 1.95 billion by the year 2028, at a CAGR of 3.4%.
Omega 3 fatty acid is a class of essential polyunsaturated fatty acids that are mainly found in marine animals in plants. It is considered a nutraceutical because it plays a vital role in every aspect of the development of the human body. Moreover, they are not synthesized by the body which makes them essential. Omega-3 fatty acids have been associated with healthy aging throughout life. Moreover, our bodies do not synthesize omega-3 fatty acids, it is necessary to obtain adequate amounts through fish and available plant sources. Eicosatetraenoic acid (EPA), and Docosahexaenoic acid (DHA) have shown promising results in the prevention of cardiovascular arrest, weight management, and cognitive function in those with mild Alzheimer's disease.
Get Full PDF Sample Copy of Report: (Including Full TOC, List of Tables & Figures, Chart) @
https://introspectivemarketresearch.com/request/15891
The latest research on the Omega 3 (EPA/DHA) Ingredients market provides a comprehensive overview of the market for the years 2023 to 2030. It gives a comprehensive picture of the global Omega 3 (EPA/DHA) Ingredients industry, considering all significant industry trends, market dynamics, competitive landscape, and market analysis tools such as Porter's five forces analysis, Industry Value chain analysis, and PESTEL analysis of the Omega 3 (EPA/DHA) Ingredients market. Moreover, the report includes significant chapters such as Patent Analysis, Regulatory Framework, Technology Roadmap, BCG Matrix, Heat Map Analysis, Price Trend Analysis, and Investment Analysis which help to understand the market direction and movement in the current and upcoming years. The report is designed to help readers find information and make decisions that will help them grow their businesses. The study is written with a specific goal in mind: to give business insights and consultancy to help customers make smart business decisions and achieve long-term success in their particular market areas.
Leading players involved in the Omega 3 (EPA/DHA) Ingredients Market include:
BASF SE (Germany), DSM (Netherlands), Aker BioMarine ASA (Norway), Croda International PLC (UK), Stepan Company (US), Pharma Marine (Norway), GC Riber Group (Norway), Clover Corporation (Australia), Omega Protein Corporation (US), Cellana (US), United Laboratories (India), Abee (India), Ocean Nutrition Canada Limited (Canada), Arista Industries (US) and other major players.
If You Have Any Query Omega 3 (EPA/DHA) Ingredients Market Report, Visit:
https://introspectivemarketresearch.com/inquiry/15891
Segmentation of Omega 3 (EPA/DHA) Ingredients Market:
By Type
Alpha-Linolenic Acid {ALA}
Eicosapentaenoic Acid {EPA}
Docosahexaenoic Acid {DHA}
By Source
Fish Oil & Krill Oil
Algal Oil
Walnut
Pumpkin Seeds
Soyabean Oil
Others
By Application
Pharmaceutical Industry
Dietary Supplement
Food & Beverage Industry
Animal Nutrition
Market Segment by Regions: -
North America (US, Canada, Mexico)
Eastern Europe (Bulgaria, The Czech Republic, Hungary, Poland, Romania, Rest of Eastern Europe)
Western Europe (Germany, UK, France, Netherlands, Italy, Russia, Spain, Rest of Western Europe)
Asia Pacific (China, India, Japan, South Korea, Malaysia, Thailand, Vietnam, The Philippines, Australia, New Zealand, Rest of APAC)
Middle East & Africa (Turkey, Bahrain, Kuwait, Saudi Arabia, Qatar, UAE, Israel, South Africa)
South America (Brazil, Argentina, Rest of SA)
Highlights from the report:
Market Study: It includes key market segments, key manufacturers covered, product range offered in the years considered, Global Omega 3 (EPA/DHA) Ingredients Market, and research objectives. It also covers segmentation study provided in the report based on product type and application.
Market Executive Summary: This section highlights key studies, market growth rates, competitive landscape, market drivers, trends, and issues in addition to macro indicators.
Market Production by Region: The report provides data related to imports and exports, revenue, production and key players of all the studied regional markets are covered in this section.
Omega 3 (EPA/DHA) Ingredients Profiles of Top Key Competitors: Analysis of each profiled Roll Hardness Tester market player is detailed in this section. This segment also provides SWOT analysis of individual players, products, production, value, capacity, and other important factors.
If you require any specific information that is not covered currently within the scope of the report, we will provide the same as a part of the customization.
Acquire This Reports: -
https://introspectivemarketresearch.com/checkout/?user=1&_sid=15891
About us:
Introspective Market Research (introspectivemarketresearch.com) is a visionary research consulting firm dedicated to assisting our clients to grow and have a successful impact on the market. Our team at IMR is ready to assist our clients to flourish their business by offering strategies to gain success and monopoly in their respective fields. We are a global market research company, that specializes in using big data and advanced analytics to show the bigger picture of the market trends. We help our clients to think differently and build better tomorrow for all of us. We are a technology-driven research company, we analyse extremely large sets of data to discover deeper insights and provide conclusive consulting. We not only provide intelligence solutions, but we help our clients in how they can achieve their goals.
Contact us:
Introspective Market Research
3001 S King Drive,
Chicago, Illinois
60616 USA
Ph no: +1-773-382-1049
Email: [email protected]
#Omega 3 (EPA/DHA) Ingredients#Omega 3 (EPA/DHA) Ingredients Market#Omega 3 (EPA/DHA) Ingredients Market Size#Omega 3 (EPA/DHA) Ingredients Market Share#Omega 3 (EPA/DHA) Ingredients Market Growth#Omega 3 (EPA/DHA) Ingredients Market Trend#Omega 3 (EPA/DHA) Ingredients Market segment#Omega 3 (EPA/DHA) Ingredients Market Opportunity#Omega 3 (EPA/DHA) Ingredients Market Analysis 2023
0 notes
Text
For the past 35 years, the United Nations’ Intergovernmental Panel on Climate Change (IPCC) has warned us that emissions from the burning of fossil fuels, predominantly carbon dioxide (CO2), are causing dangerous global warming. This myth is blindly accepted — even by many of my science colleagues who know virtually nothing about climate. As a scientist, my purpose here is to help expose this fairy tale.
The global warming story is not a benign fantasy. It is seriously damaging Western economies. In January 2021, the White House ridiculously declared that “climate change is the most serious existential threat to humanity.” From there, America went from energy independence back to energy dependence. Another consequence has been the appearance of numerous companies whose goal is to “sequester CO2” as well as “sequester carbon” from our atmosphere. However, this so-called “solution” is scientifically impossible. Life on Earth is based on carbon! CO2 is plant food, not a pollutant!
Generations have been brainwashed for decades into believing this imaginary “climate crisis,” from kindergarten through college, and in mainstream media and social media. Indoctrinated young teachers feel comfortable teaching this misinformation to students. Dishonest climate scientists feel justified in spreading disinformation because they need governmental support for salaries and research.
The evidence contradicting the climate apocalypse is vast. Some comes from analysis of Greenland and Antarctica ice, in which air trapped at various depths reveals CO2 levels of past climate. Proxy records from marine sediment, dust (from erosion, wind-blown deposition of sediments), and ice cores provide a record of past sea levels, ice volume, seawater temperature, and global atmospheric temperatures.
From his seminal work while a prisoner of war during WWI, Serbian mathematician Milutin Milankovitch explained how climate is influenced by variations in the Earth’s asymmetric orbit, axial tilt, and rotational wobble — each going through cycles lasting as long as 120,000 years.
It is widely recognized that Glacial Periods of about 95,000 years, interspersed with Interglacial Periods of approximately 25,000 years, correspond with Milankovitch Cycles. Multiple incursions of glaciers occurred during the Pleistocene, an epoch lasting from about 2.6 million to 11,700 years ago, when Earth’s last Glacial Period ended. Around 24,000 years ago, present-day Lake Erie was covered with ice a mile thick.
Within each Interglacial Period, there’ve been warming periods, or “Mini-Summers.” For example, within the current Holocene Interglacial, there have been warmer periods known as the Minoan (1500–1200 B.C.), Roman (250 B.C.–A.D. 400), and Medieval (A.D. 900–1300). Our Modern Warming Period began with the waning of the Little Ice Age (1300–1850). Today’s Mini-Summer is colder so far than all previous Mini-Summers of the last 8,500 years.
How did CO2 get blamed for global warming? French physicist Joseph Fourier (1820s) proposed that energy from sunlight must be balanced by energy radiated back into space. Irish physicist John Tyndall (1850s) performed laboratory experiments on “greenhouse gases” (GHGs), including water vapor; he proposed that CO2 elicited an important effect on temperature. However, it’s impossible to do appropriate experiments — unless the roof of your laboratory is at least six miles high. Swedish chemist Svante Arrhenius (1896) proposed that “warming is proportional to the logarithm of CO2 concentration.” Columbia University geochemist Wallace Broecker (1975) and Columbia University adjunct professor James Hansen (1981) wrote oft-cited articles in Science magazine, both overstating the perils of CO2 causing dangerous global warming — without providing scientific proof.
Most of Earth’s energy comes from the sun. Absorption of sunlight causes molecules of objects or surfaces to vibrate faster, increasing their temperature. This energy is then re-radiated by land and oceans as longwave, infrared radiation (heat). Princeton University physicist Will Happer defines a GHG as that which absorbs negligible incoming sunlight but captures a substantial fraction of thermal radiation as it is re-radiated from Earth’s surface and atmospheric GHGs back into space.
The gases of nitrogen, oxygen and argon — constituting 78%, 21%, and 0.93%, respectively, of the atmosphere — show negligible absorption of thermal radiation and therefore are not GHGs. Important GHGs include water (as high as 7% in humid tropics and as little as 1% in frigid climates), CO2 (0.042%, or 420 parts per million [ppm] by volume), methane (0.00017%), and nitrous oxide (0.0000334%, or 334 ppm).Water vapor (clouds) has at least a hundred times greater warming effect on Earth’s temperature than all other GHGs combined.
As atmospheric CO2 increases, its GHG effect decreases: CO2’s warming effect is 1.5°C between zero and 20 ppm, 0.3°C between 20 and 40 ppm, and 0.15°C between 40 and 60 ppm. Every doubling of atmospheric CO2 from today’s levels decreases radiation back into space by a mere 1%. For most of the past 800,000 years, Earth’s atmospheric CO2 has ranged between about 180 ppm and 320 ppm; below 150 ppm, Earth’s plants could not exist, and all life would be extinguished.
Today’s global atmospheric CO2 levels are ~420 ppm. Even at these levels, plants are “partially CO2-starved.” In fact, standard procedures for commercial greenhouse growers include elevating CO2 to 800–1200 ppm; this enhances growth and crop yield ~20–50%. As shown by satellite since 1978, increased atmospheric CO2 has helped “green” the Earth by more than 15 percent, substantially enhancing crop production.
If global atmospheric CO2 was ~280 ppm in 1750, and it’s ~420 ppm today, what’s the source of this 140-ppm increase? Scientists estimate that human-associated industrial emissions might have contributed 135 ppm — with “natural causes” accounting for the remaining 5 ppm.
In Earth’s history, the highest levels of atmospheric CO2 (6,000–9,000 ppm) occurred about 550–450 million years ago, which caused plant life to flourish. CO2 levels in older nuclear submarines routinely operated at 7,000 ppm, whereas newer subs keep CO2 in the 2,000- to 5,000-ppm range. Meanwhile, ice core data over the last 800,000 years show no correlation between global warming or cooling cycles and atmospheric CO2 levels.
CO2 in our lungs reaches 40,000–50,000 ppm, which induces us to take our next breath. Each human exhales about 2.3 pounds of CO2 per day, which means Earth’s 8 billion people produce daily 18.4 billion pounds of CO2. But humans represent only 1/40 of all CO2-excreting life on Earth. Multiplying 18.4 billion pounds by 40 gives us 736 billion pounds of CO2 per day. This approximates the overall CO2 excreted by the total animal and fungal biomass on the planet.
Daily emissions from worldwide industry in 2020 were estimated to be 16 million metric tons of CO2 equivalents. If one metric ton is 2,200 pounds, then “total industrial emissions” amount to 35,200,000,000 (35.2 billion) pounds of CO2 per day. This means that the entire animal and fungal biomass (736 billion pounds) puts out more than 20 times as much CO2 as all industrial emissions (35.2 billion pounds)!
Can any clear-thinking person comprehend the facts above and still create a company with idiotic plans to “sequester CO2” or “sequester carbon”? Scientifically, “net zero” and “carbon footprint” are meaningless terms. There is no “climate crisis.”
If you try to find these facts on the web, good luck! Out of every 10 hits on any climate topic, you’ll be lucky to find one or two sites with truthful scientific data.
The door of a nearby classroom displays a poster of Abraham Lincoln with the caption: “Don’t believe everything you read on the internet.” It is advice that our 16th president surely would have offered — had he lived to see the rise of this global warming quasi-religion.
Daniel W. Nebert is professor emeritus in Gene-Environment Interactions at the University of Cincinnati. He thanks Professor Will Happer (one of the CO2 Coalition directors) for valuable discussions.

0 notes
Text
The Colpitts oscillator experiment and DIY FM transmitter
The awesome Colpitts oscillator. Exploring the secrets of the Colpitts generator.

Hello, and welcome to our electronic studies! We probably all know that an oscillating circuit consists of a capacitor (C) and an inductor (L), and its waveform is an ideal sine wave.
In the LC resonant circuit, single-frequency oscillations occur, and their period in seconds is equal to 2π√(LC).

This equation is called Thomson's formula after its author, William Thomson, aka 1st Baron Kelvin. Many other things are named after him because Lord Kelvin was an outstanding scientist and inventor. One can recall, for example, the Kelvin, a unit of absolute temperature, or the marine compass with sundial he invented.

Another thing we know is that a transistor and an operational amplifier amplify the signal, meaning they transform a sin wave with a small amplitude into a sine wave with a bigger amplitude. We had 0.5 volts; it became five volts - ten times as much.

However, real electronic devices, even seemingly simple ones made from a handful of components, work in a much more complex and interesting way than the simplified idea of them from a school physics class.
This can either cause problems that we must learn to overcome or inspire technical creativity and help us achieve difficult tasks with simple components.
Today, we will study the operation of a real Colpitts oscillator, and a small printed circuit board and a digital oscilloscope will help us with this.

Edwin Henry Colpitts was a great inventor and a famous communications engineer. From 1897 to 1899, he served at Harvard's Jefferson Physical Laboratory. From 1899 on, Mr. Colpitts worked at the American Bell Telephone Company. In 1907, he became the research branch chief at the Western Electric Company. It was a manufacturing division of the American Telephone and Telegraph Company from 1881 to 1995.

Colpitz became vice president of AT&T in 1924 and was vice president of Bell Labs from 1934 to 1937. From 1940 to 1946, he served as head of technical aid for Division 6 (antisubmarine warfare) of the National Defense Research Committee and was awarded the Medal of Merit.
As often happens among renowned geniuses, Colpitz neglected his most known invention. He described the operating principle of his generator in a private conversation around 1915. He quickly forgot this product pitch, and later, according to company practice, he was asked to sign a patent application in 1918 (US patent 1624537).
A distinctive feature of the Colpitts oscillator is that the positive feedback for the amplifier (which can be a bipolar or field-effect transistor, an operational amplifier, or a vacuum tube) is received from a voltage divider on two capacitors connected in series and connected to an inductor.

The oscillation frequency is nearly equal to the resonant frequency of the LC circuit of two capacitors with an inductor parallel to them.

The actual frequency will differ from the theoretically calculated one due to the distribution of capacitances and the resistive load of the transistor. This is exactly what we will see on the oscilloscope screen.

The twin brother and probable predecessor of the Colpitts generator was the Hartley oscillator; a patent application for it was filed in 1915 (US patent 1356763, issued 1920). The difference is that a voltage divider for positive feedback is formed not by two capacitors but by two inductors in series or a single-tapped inductor.
The innovative feature behind the Hartley oscillator was that its coils did not have to be magnetically coupled, which was strictly necessary for its predecessors, the Meissner and the Armstrong oscillators.
Rhodes Scholarship winner Ralph Vinton Lyon Hartley, also known for pioneering the concept of "information" as a random variable and for attempting to define the "unit of measure of information", has worked for the Western Electric Company since 1915. He was in touch with Edwin Colpitts at the time and probably was a part of the aforementioned discussion on using a capacitive voltage divider instead of an inductive one.
Hartley was awarded the IRE (now IEEE) Medal of Honor for his generator and information proportionality law in 1946. In addition to the oscillator, Hartley transform, and the logarithmic unit of measure for information entropy named after him, he owns more than 70 patents, including a neutralization circuit to eliminate parasitic self-excitation of a triode.

The very first IRE Medal of Honor in history was received by the inventor of the LC continuous oscillation generator with positive feedback (differing from the earlier shock excitation of damped oscillations, like the Hertz generator and Tesla spark transformer).

The idea of positive feedback was also introduced by American electrical engineer and innovator Edwin Howard Armstrong, inventor of the FM radio, superheterodyne and super-regenerative radio receivers, and FM radar. In total, Armstrong filed 42 patents.

The Armstrong oscillator, made in 1912, was an LC resonant tank circuit connected to the input of a tube or transistor amplifier stage. A feedback coil was connected to the output of the cascade.

The generator, invented in 1913 and named after Austrian engineer and physicist Alexander Meissner, was similar to the Armstrong generator; the only difference was that the Meissner LC generator circuit was connected to the output of the amplifier. The coupling coil was connected to the input. These two oscillators were so close that they are now often combined under the general name "Armstrong-Meissner oscillator".
Each of these generators must be carefully tuned to produce a clean sine-wave signal. We will now see this during the experiment. An oscilloscope can show more than a dozen formulas.
In today's experiment, we will make use of a board designed for a middle school experiment. It contains a Colpitts oscillator on transistor Q1, an amplifier stage on transistor Q2, a reversed-phase amplifier on op-amp U1A, and a node on operational amplifier U1B, which can be a comparator or an analog signal amplifier, depending on the setting.

The operational amplifiers are powered by a bipolar ±9-volt power supply. At the same time, the transistor stages only need a unipolar + 9 volts of power.
DC isolation is provided by capacitors C5, C6, and C7, which pass the alternating component and block the direct current one. This way, it is possible to transmit an alternating electrical signal between circuit points with different potentials. This is one of the fundamentals of electronic circuitry.
Capacitor C1 grounds the AC base of transistor Q1, so the cascade operates in common-base mode. Resistor R1 (or R2, we can switch between them using jumpers JP1 and JP2) sets the bias current of the base of the transistor and thus its operating point.
The oscillating circuit coils are switched by jumpers JP3 and JP4, capacitors C2 and C3 by JP5 and JP6.
In total, we have two to the power of three, that is, eight options for jumper positions. Let's start from the very first: close JP1, JP3, and JP5. Next, we will switch one jumper at a time to see the changes at each stage until we've tested all eight possible combinations.
Let's take another look at the formula for the oscillation frequency of the Colpitts generator. The calculated oscillation period is 2π√(0.1 mH * 5 nF) = 4.44 ns. This corresponds to a frequency of 225 kHz.
Inductance L2 exceeds L1 by 4.7 times, which should reduce the frequency by √4.7 = 2.17 times. The capacitance of C3 is 3 times higher than that of C2, so we should expect a decrease in frequency by √(0.75/0.5) = 1.22 times.

Let's connect the oscilloscope to the node TP2 output of the generator. The measured frequency when C = 0.01 uF and L = 100 uH turned out to be 314 kHz; the calculated frequency is 30% lower. The cause could be Chinese-made ceramic disk capacitors; cheap ones tend to have 30–35% less capacity than listed. The oscillation amplitude Vp-p is 3.92 V, while the sinusoid is not ideal with a flattened lower part.

We did not replace either capacitor or inductor; we just switched the transistor base bias resistor from 10 to 220 kOhm. Now we have a beautiful sine wave with an amplitude of 4.44 V. And the most interesting thing here is that the frequency has decreased to 301 kHz.
The fact is that the base bias current changes the conductivity of the transistor and, accordingly, the equivalent capacitance, which defines the resonant frequency of the oscillatory circuit. This property of a transistor LC oscillator will help us build a simple FM radio transmitter.

After connecting a 0.03 uF capacitor, the oscillation frequency dropped by 20% to 243 kHz, which fully correlates with the calculations. The amplitude has dropped to 2.6 V. The waveform is distorted; the sine wave is now modulated with a half-frequency signal. Each odd half-wave is twice the amplitude of the even one.

Switching back to the 10 kOhm resistor, we see the frequency increase to 263 kHz. The amplitude dropped even lower, to 2.28 V, but the sine wave is now flawless: symmetrical and not flattened at the bottom.

Connecting the 470 uH inductor, the amplitude is 2.28 V. The frequency of 121 kHz is exactly 2.17 times lower than 263, which fully corresponds to the formula.

With a 220 kOhm resistor, the frequency dropped to 54.3 kHz. The minus-first harmonic has now become stronger than the design frequency of the generator. So, we got the frequency divided in half, and the fundamental frequency now becomes the first harmonic. The amplitude increased greatly to 4.9 V.

With a 0.01 uF capacitor, the voltage increased to 7.28 V. The sine wave looks right, and the frequency is correct—133 kHz.

With a 10 kOhm resistor, the amplitude dropped to 4.52 V, and the frequency increased to 145 kHz. The lower part of the sine wave is squashed.

To look further into the signal propagation, let's revert to the 220 kΩ resistor because this combination produced a stable and strong signal with an ideal sine wave shape. Now, let's see the distortion caused by the transistor and operational amplifiers.

We see extreme distortion on collector Q2. Not only did full-wave rectification of the signal occur, but a third harmonic, characteristic of transistors, was also added. It shows up as a hump one-third of the period wide. Such odd transistor harmonics are undesirable for the resulting sound, unlike tube harmonics.
Such strong signal distortion is caused by the scheme with a common collector and not with a common collector. If we connected a capacitor in parallel with R6, we would get a common-emitter stage, and the signal at the collector would be much cleaner.

On the contrary, we see an excellent pure sine wave at the emitter because Q1 operates in buffer mode or emitter follower.

Now, let's connect the oscilloscope probe to the output of the first operational amplifier, U1A. And instead of a sinusoid, we see relaxation oscillations, the pattern of which changes depending on the resistance of the trimming resistor RP1 in the feedback loop.

C6 and R7 are differentiator circuits or high-pass filters; their time constant is 1 millisecond. And the period of oscillations at a frequency of 133 kHz is 7.5 microseconds, which is 133 times less. Therefore, this RC chain has almost no effect on the signal flow at this frequency.
Where do the distortions come from, then? We haven't added a small ceramic capacitor parallel to RP1 to the circuit design. Several tens of picofarads of capacitance would've helped suppress the high-frequency resonance of the operational amplifier.

Finally, at the output of U2A, we see either a constant voltage or an almost perfect triangle wave, depending on the resistance of RP2. In the first case, U2A works as a comparator, and in the second, as an amplifier, thanks to the resistor R13 creating negative feedback.
The fact that the Colpitts oscillator frequency depends on the transistor base bias current was used in a small FM radio transmitter that I've assembled and tested. Experiments with it do not violate the laws on radio communications, as its power is extremely low. Transmitters like this are used in older cars to listen to music from a CD or MP3 player through an FM radio that does not have an AUX input.
Q1 amplifies the microphone signal, which then goes to the Q2 base, part of the Clapp oscillator. This is almost the same Colpitts generator, with an added capacitor C8 in series with the coil L4 to improve operating stability.
Q3 works as the output power amplifier. C7, C9, C10, and L3 together are the output filters for frequency matching with the antenna, which is just a piece of wire.
The input jack disconnects the Clapp oscillator from the microphone amplifier and supplies a modulating signal from an external source. For example, a homemade MP3 player, like in my video.
The left channel signal comes through resistor R10, and the right channel comes through resistor R7. This is a mono transmitter. I also plan to assemble a stereophonic modulator and tell you all about it in one of the upcoming posts.
youtube
0 notes
Link
0 notes
Text
Motors For Negative Pressure Air Fan suppliers
Motors For Negative Pressure Air Fan suppliers Our History 1972: State owned Wenling Micromotor Factory Co., Ltd. 2008: Wenling Nosch Motor Co., Ltd. 2018: Zhejiang Fangyuan Sifu Mechanical and Electrical Co., Ltd. 2019: Establish Shandong Branch 2020: Establish Foreign Trade Department Our Factory Zhejiang Fangyuan Sifu Mechanical and Electrical Co., Ltd. is a high-tech enterprise focusing on motor R&D, manufacturing and sales. It is one of the core enterprises in the manufacturing sector of China's top 500 private enterprises under the Fangyuan Group. The company's main products include iron-shell single three-phase asynchronous motor series, aluminum-shell single three-phase asynchronous motor series, fan special motor series, frequency conversion motor series, permanent magnet DC motor series, etc. Mainly used in water pump power, fan power, machine equipment power, agricultural machinery power, new energy vehicle power, marine equipment power and other fields. The company is located at No. 2479, Haifeng Road, Taizhou Bay New District, Zhejiang (3 kilometers from the east exit of Jiaojiang Coastal Expressway, 10 kilometers from Taizhou Airport, and 20 kilometers from Taizhou High-speed Railway Station).Covering an area of 43 acres, it has a standardized workshop of 35,000 square meters, equipped with more than 50 sets of automatic CNC lathes, CNC grinders, CNC milling machines, machining centers, high-speed punching machines and other metal processing equipment, and equipped with advanced equipment such as automatic wire embedding lines, spraying lines, and automatic assembly lines. There are domestic leading wind tunnel laboratories, test centers, and motor type laboratories. The company has a technical management team with strong professional skills and excellent management capabilities. So far, it has obtained dozens of patent certificates (including 5 invention patents), participated in the formulation of 4 industry standards, and obtained 3C certification, CE Certification, ISO9001 management system certification, ISO45001 occupational health and safety management system certification, ISO14001 environmental management system certification, etc. It has also launched long-term technical cooperation with universities such as China Jiliang University and Zhejiang University of Technology to enhance core power in terms of innovation, stability, high efficiency, and energy saving. Our Product 鈼?IE3 Premium Motor 鈼?IE4 Super Premium Motor 鈼?Single Phase Motor 鈼?FRP Fan Motor 鈼?Negative Pressure Fan Motor 鈼?Cooling Fan Motor 鈼?Exhaust Fan Motor for Cowshed 鈼?Portable Cooler Motor 鈼?Vertical Pump Motor 鈼?Acid and Alkali Resistant Chemical Pump Motor 鈼?Washer Motor 鈼?Special Motor for Woodworking Product Application FRP Fan, Negative Pressure Fan, Cooling Fan, Exhaust Fan, Portable Cooler, Vertical Pump, Acid and Alkali Resistant Chemical Pump, Washer, Woodworking Our Certificate CE, Reach, RoHS, CCC (China Compulsory Certification), IPMS, China Energy Label Production Equipment Automatic wire embedding machine: 10 CNC lathe: 12 CNC grinder : 4 Dynamic balance machine: 4 CNC milling machine: 3 Plastic spraying line: 1 Production line: 9 Paint dipping machine: 2 Multi hole drilling machine: 2 Production Market Annual Output Value: US$20- US$50Million Domestic Market: 55% Eastern Europe: 10% Southeast Asia: 10% Middle East: 5% Africa: 5% South America: 3% Western Europe: 3% Other Areas: 9% Our Service The company takes the spirit of innovation as the guideline, takes high-quality products as the foundation, and takes full-staff entrepreneurship as the core driving force, strongly promotes R&D and innovation, accelerates the adjustment of product structure, optimizes technical processes, improves operational efficiency, and strengthens the spirit of chemical craftsmanship, and uses this as a driving force to build Outstanding enterprise, creating market opportunities, and striding forward to the vanguard of industry segmentation.Motors For Negative Pressure Air Fan suppliers website:http://www.sivomotor.com/
0 notes
Text

Cylindrical ribbon worm (Lineus pictifrons)
By: Western Marine Laboratory
From: Invertebrates of North America
1972
8 notes
·
View notes
Photo

Dr. William Montague Cobb (October 12, 1904 - November 20, 1990) was a pioneering 20th-century physical anthropologist. As the first African American to earn a Ph.D. in Anthropology, and the only one until after the Korean War, his main focus in the anthropological discipline was studying the concept of race and the negative impact it has on communities of color. He prolifically wrote both popular and scholarly articles during his career and trained an untold number of students. He graduated from Dunbar High School, which was considered to be of the best African American high schools, and continued to earn his BA from Amherst College. He continued his research in embryology at Woods Hole Marine Biology Laboratory, where he earned the Blodgett Scholarship for proficiency in Biology. He earned his MD from Howard University Medical School. Numan PG Adams, who was the Dean of Howard University at the time, was assigned the task of organizing a new faculty of African American physicians to help advance the school in the medical field. He, in turn, had the aspirations of creating a laboratory of anatomy and physical anthropology at Howard University that would have the resources for African American scholars to contribute instead of just defending debates in racial biology. He would then spend a few years at Case Western Reserve University, studying under T. Wingate Todd, where he would contribute to the Hamann-Todd Skeletal Collection, and earn his Ph. D in Anthropology. #365black #africanhistory365 #africanexcellence #omegapsiphi #sigmapiphi https://www.instagram.com/p/CjnAJJCudyX/?igshid=NGJjMDIxMWI=
0 notes
Text
Welcome to Amasi Part IV: Las Islas Maracainas
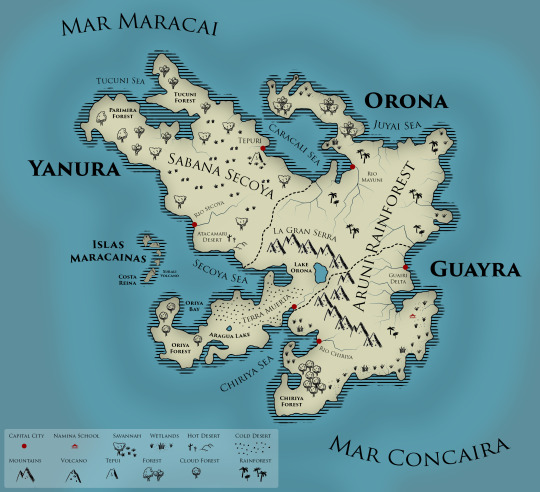
Check out introductions to Yanura, Orona, and Guayra, and read on for Las Islas Maracainas (north to south): Maragua, Caragua, Muraya, Zuraya and Costa Reina!
Las Islas Maracainas


Las Islas Maracainas are actually an archipelago of five islands and are a highly popular tourist location/vacation spot. Known for pristine white sand beaches and sparkling aquamarine waters on the eastern coast where the Secoya Sea meets Mar Maracaí, as well as for stunning marine life and snorkeling, Las Islas are the most sought after tropical island destination.
The northernmost island, Maragua, is where visitors typically arrive. Its capital, Ciudad Maracaí, is located at the eastern point and is usually just a pit stop before tourists travel to some of the smaller beach towns along the eastern and southern coasts, or to the other islands by boat. Maragua’s western coast is covered by sharp cliffs and is less popular for tourists looking for a beach vacation, though more adventurous visitors enjoy hiking to the flat summits to enjoy an unobstructed view of Mar Maracaí in front of them and the dense Maraguan jungle behind them.
The Maraguan jungle is open to visitors to an extent, and with many restrictions to protect the wildlife living there. Visitors have not had many complaints about these restrictions, given that there is an understanding they are meant to protect the jungle itself just as much as they are meant to protect people from dangerous predators lurking among the trees.
Caragua is known for its inactive volcano, named after the island itself, which promises breathtaking sunrise views at its peak. The surrounding jungle is generally off-limits to visitors, who are only permitted to travel to the volcano via an established and regulated path. It also is home to the only black sand beaches on Amasi on its western coast, which makes it a unique vacation locale.
Muraya and Zuraya are the smallest of the islands, and are perfect for those seeking the ideal beach vacation. Almost entirely covered in soft, white sands, and featuring the clearest, turquoise waters, these islands are destinations generally sought after for quiet rest and relaxation.
Finally, Costa Reina finds itself distinct from the rest of the archipelago in a number of ways. Originally named Xuralí after the active volcano on the island, it was renamed Costa Reina after the Technological Revolution to honor the incredible inventions and discoveries by genius engineer, inventor, and scientist, Reina Cruz, whose discoveries completely transformed Amasi society and culture, and who was born and raised on the island.
Because of the volcano’s active status, Costa Reina does not share the same tourist attraction as the other islands, though some still enjoy visiting its small beach towns around the southern coast. The northern half of the island is uninhabitable due to the volcano’s eruption zone, and the southern half is now home to numerous laboratories and manufacturing plants established by Reina Cruz at the height of her career. It is also home to a prestigious university focusing on sciences and technological studies, located in the island’s capital, Ciudad de la Reina, founded by Reina Cruz to encourage research and training in sustainable technology and development.
Given the islands’ popularity, Maracuchos (general term for natives of the archipelago) were concerned that the islands’ natural beauty would be quickly destroyed by tourism, but also believed strongly that this beauty belonged to the whole world and thus should be open to any who wished to see it. Working with the mainland countries, Las Islas quickly developed a plan to protect the archipelago without closing off borders to willing visitors.
Over the years, the various countries had worked in collaboration to develop a strong, shared norm throughout Amasi that nature deserves the highest levels of respect, regardless of borders. As Amasi developed technologically, this norm became a cornerstone to ensure nature would remain protected in any developmental endeavors. Of course, the Technological Revolution was hugely influential in instituting sustainable processes for resource use and extraction, but even before then, it was well-understood that protection of the environment comes before progress.
It was therefore not too difficult for Maracuchos to bring the rest of Amasi on board in coming up with a workable plan to protect the islands. Ultimately, tourism was restricted to prevent the islands from being overburdened with visitors at any given time, but the already deeply ingrained norms for all Amasians meant that this restriction did not limit anyone interested in visiting the islands from doing so. Visitor residences were integrated with existing residential zones to encourage the sentiment of community and respect on the part of tourists and promote knowledge of the islands’ diversity and conservation efforts among all visitors. With such a plan in place, Las Islas have been able to continue welcoming visitors from the mainland without sacrificing the protection of the land.
Some areas of the islands are off-limits to visitors to protect communities that require isolationism as a religious practice and who are entrusted with the care and protection of more vulnerable areas of the archipelago.
Main Inspiration: Los Roques; Isla Margarita
#worldbuilding#welcome to amasi#part iv#TSR#original#original writing#mine#my wip#wip#writeblr#writers of tumblr#geography intro#writblr#writing#latinx fantasy#latinx writing#latinx#latine fantasy#latine writing#latine#maragua#caribbean#st johns#saba#island#tropical island#tsrgeo#los roques#venezuela
5 notes
·
View notes
Text

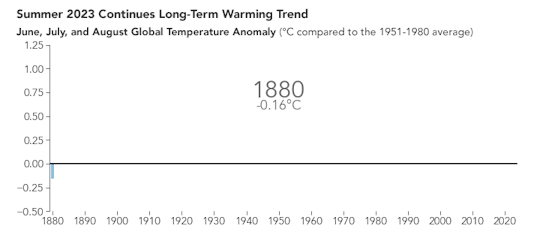
Summer 2023 Was the Hottest on Record
Summer of 2023 was Earth’s hottest since global records began in 1880, according to scientists at NASA’s Goddard Institute of Space Studies (GISS) in New York.
The months of June, July, and August combined were 0.23 degrees Celsius (0.41 degrees Fahrenheit) warmer than any other summer in NASA’s record, and 1.2°C (2.1°F) warmer than the average summer between 1951 and 1980. August alone was 1.2°C (2.2°F) warmer than the average. June through August is considered meteorological summer in the Northern Hemisphere.
The map above depicts global temperature anomalies for June, July, and August 2023. It shows how much warmer or cooler Earth was compared to the baseline average from 1951 to 1980. Note that the deepest reds are at least 4°C (7°F) above the mean.
This new record comes as exceptional heat swept across much of the world, exacerbating deadly wildfires in Canada and Hawaii, and searing heat waves in South America, Japan, Europe, and the U.S., while likely contributing to severe rainfall in Italy, Greece, and Central Europe.
“Summer 2023’s record-setting temperatures aren’t just a set of numbers—they result in dire real-world consequences. From sweltering temperatures in Arizona and across the country, to wildfires across Canada, and extreme flooding in Europe and Asia, extreme weather is threatening lives and livelihoods around the world,” said NASA Administrator Bill Nelson. “The impacts of climate change are a threat to our planet and future generations, threats that NASA and the Biden-Harris Administration are tackling head on.”
NASA assembles its temperature record, known as GISTEMP, from surface air temperature data acquired by tens of thousands of meteorological stations, as well as sea surface temperature data from ship- and buoy-based instruments. This raw data is analyzed using methods that account for the varied spacing of temperature stations around the globe and for urban heating effects that could skew the calculations.
The analysis calculates temperature anomalies rather than absolute temperature. A temperature anomaly shows how far the temperature has departed from the 1951 to 1980 base average.
“Exceptionally high sea surface temperatures, fueled in part by the return of El Niño, were largely responsible for the summer’s record warmth,” said Josh Willis, climate scientist and oceanographer at NASA’s Jet Propulsion Laboratory in Southern California.
El Niño is a natural climate phenomenon characterized by warmer than normal sea surface temperatures (and higher sea levels) in the central and eastern tropical Pacific Ocean.
The record-setting summer of 2023 continues a long-term trend of warming. Scientific observations and analyses made over decades by NASA, National Oceanic and Atmospheric Administration (NOAA), and other international institutions have shown this warming has been driven primarily by human-caused greenhouse gas emissions. At the same time, natural El Niño events in the Pacific pump extra warmth into the global atmosphere and often correlate with the warmest years on record.
“With background warming and marine heat waves that have been creeping up on us for decades, this El Niño shot us over the hump for setting all kinds of records,” Willis said. “The heat waves that we experience now are longer, they’re hotter, and they’re more punishing. The atmosphere can also hold more water now, and when it’s hot and humid, it’s even harder for the human body to regulate its temperature.”
Willis and other scientists expect to see the biggest impacts of El Niño in February, March, and April 2024. El Niño is associated with the weakening of easterly trade winds and the movement of warm water from the western Pacific toward the western coast of the Americas. The phenomenon can have widespread effects, often bringing cooler, wetter conditions to the U.S. Southwest and drought to countries in the western Pacific, such as Indonesia and Australia.
“Unfortunately, climate change is happening. Things that we said would come to pass are coming to pass,” said Gavin Schmidt, climate scientist and director of GISS. “And it will get worse if we continue to emit carbon dioxide and other greenhouse gases into our atmosphere.”
NASA’s full temperature data set and the complete methodology used for the temperature calculation and its uncertainties are available online.
NASA Earth Observatory images by Lauren Dauphin, based on data from the NASA Goddard Institute for Space Studies. Story by Jenny Marder, NASA Earth Science News Team.
2 notes
·
View notes
Text
Low-cost 3D method rapidly measures disease impacts on Florida’s coral reefs
https://sciencespies.com/nature/low-cost-3d-method-rapidly-measures-disease-impacts-on-floridas-coral-reefs/
Low-cost 3D method rapidly measures disease impacts on Florida’s coral reefs
Stony coral tissue loss disease manifests as lesions of necrotic tissue that spread across coral colonies, leaving behind dead coral skeletons. Since 2014, this highly virulent disease has contributed to substantial declines of reef-building coral in Florida, impacting more than 20 coral species. The need for widespread reef monitoring and novel surveys are imperative for disease mitigation strategies. However, the various techniques currently used all require individual evaluation and often rely on visual estimates by divers in the field.
A low-cost and rapid 3D technique is helping scientists to gain insight into the colony- and community-level dynamics of the poorly understood stony coral tissue loss disease. Researchers from Florida Atlantic University’s Harbor Branch Oceanographic Institute adapted Structure-from-Motion (SfM) photogrammetry to generate 3D models for tracking lesion progression and impacts on diseased coral colonies. By combining traditional diver surveys and with 3D colony fate-tracking, the team determined the impacts of disease on coral colonies at study sites throughout Southeast Florida in St. Lucie Reef, Jupiter, Palm Beach and Lauderdale-by-the-Sea.
Results of the study, published in PLOS One, demonstrated that the prevalence of stony coral tissue loss disease varied significantly across location, but not through time. St. Lucie Reef and Lauderdale-by-the-Sea sites were highly impacted by coral disease, while study sites in Jupiter and Palm Beach had lower disease prevalence. The highest disease values observed in this study were between 21 to 43 percent at St. Lucie Reef. However, no site reached the highest reported disease prevalence values of 60 percent observed near Miami in 2014.
“We observed an increase in disease prevalence during the spring of 2018, which was honestly unexpected. Prevalence values for other described coral diseases such as white syndrome, white band, black band, and white pox often increase during the summer months as water temperatures increase,” said Joshua D. Voss, Ph.D., senior author, an associate research professor at FAU Harbor Branch and executive director of the NOAA Cooperative Institute for Ocean Exploration, Research, and Technology. “Stony coral tissue loss disease prevalence does not appear to have a strong positive correlation with temperature as has been observed for other coral diseases, but potential environmental cofactors that may drive disease prevalence need to be examined further.”
Findings from the study also indicated that total colony area and healthy tissue area on fate-tracked colonies decreased significantly over time, capturing the amount of coral tissue lost to disease. However, disease lesions themselves did not change in size over time and were not correlated with total colony area. These results suggest that targeting intervention efforts on larger colonies may maximize preservation of coral cover.
“Since stony coral tissue loss disease is a progressive and necrotic infection, the area of tissue loss, or proportion of tissue loss, may represent more impactful metrics for quantifying the severity of infection as opposed to disease lesion area or percent affected tissue,” said Ian Combs, the study’s lead author and recent M.S. graduate from Voss’ lab at FAU Harbor Branch. “Traditional coral surveys combined with 3D photogrammetry can provide greater insights into the spatiotemporal dynamics and impacts of coral diseases on individual colonies and coral communities than surveys or visual estimates of disease progression alone.”
Since 2014, Florida’s Coral Reef has experienced an ongoing outbreak of the newly-described coral disease responsible for widespread coral death throughout the Tropical Western Atlantic. The disease first appeared in the summer of 2014 following the dredging of Government Cut in Miami-Dade County. In subsequent years, reports of stony coral tissue loss disease infections have increased and spread from Miami-Dade County along the Florida Reef Tract and into the wider Tropical Western Atlantic. To date, the disease has spread north to the northern terminus of the Florida’s Coral Reef in Martin County and south to the Dry Tortugas in Monroe County, with additional outbreaks observed in at least twelve territories throughout the Tropical Western Atlantic.
The ultimate goal of this work is to increase widespread application of this and similar techniques to improve the design, implementation, and success of coral disease intervention, mitigation, and management strategies.
“Quantitative 3D approaches such as the method we used can improve our understanding of the ecology and impacts of coral diseases on coral reef ecosystems, and may guide colony selection in future disease intervention strategies,” said Voss. “We’ll use this information to optimize our efforts to slow disease outbreaks in Southeast Florida and the Dry Tortugas.”
Combs is now a coral reef ecosystem biologist at Mote Marine Laboratory & Aquarium. Additional co-authors on the study include Michael Studivan, Ph.D., a graduate of FAU’s integrative biology doctoral program and an assistant scientist at the University of Miami CIMAS/NOAA AOML; and Ryan Eckert, an FAU integrative biology Ph.D. student in the Voss Lab.
This research was supported by awards to Voss from the Florida Department of Environmental Protection (B430E1 and B55008), the Environmental Protection Agency (South Florida Geographic Initiative award X7 00D667-17), and the NOAA Coral Reef Conservation Program (award NA16NOS4820052). Additional funding was awarded to Combs by the Harbor Branch Oceanographic Institute Foundation through the Indian River Lagoon Graduate Research Fellowship.
Story Source:
Materials provided by Florida Atlantic University. Original written by Gisele Galoustian. Note: Content may be edited for style and length.
#Nature
1 note
·
View note
Last Seen Blogs

thankscamz
THANKS BABE

shyticklee02
panda (ticklee)

sambasuca
sambosoca

zoolonhub-blog
Zoolon.co.uk

uppermocns
archived.