#members of congress
Text
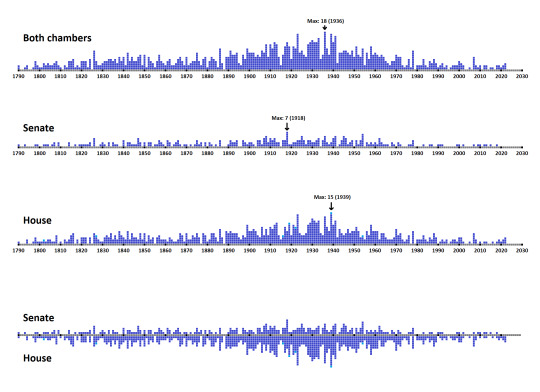
Members of Congress who died in office (1790 - 2022)
Total deaths: 1133
Senate: 302
House of Representatives: 831
Average per year: 4.862660944
Senate: 1.296137339
House: 3.566523605
Year of most deaths: 1936 (18 total)
Senate: 1918 (7)
House: 1939 (15; 14 representatives, 1 resident commissioner from Puerto Rico)
Deaths in both chambers, 1790 - 2022
2,0,0,1,2,0,0,1,4,2,1,1,3,2,3,2,2,3,4,2,1,0,2,1,4,4,5,1,2,1,4,4,4,1,5,0,9,4,2,2,3,4,4,5,5,4,5,3,6,4,6,2,8,4,6,4,4,6,7,2,7,1,6,4,3,1,4,7,4,3,2,4,5,2,2,3,5,6,4,2,6,2,3,4,4,8,4,2,5,6,1,4,6,5,4,1,10,3,0,6,6,9,7,7,8,3,2,7,5,10,8,8,8,6,7,6,9,8,12,6,12,10,13,12,6,2,7,11,13,11,5,11,10,17,8,9,7,6,12,13,14,13,13,15,5,7,18,10,7,17,13,16,3,8,8,9,9,8,7,9,6,11,7,6,10,2,8,5,11,7,8,7,6,7,6,4,3,2,4,4,7,6,6,2,1,2,5,1,9,0,2,2,2,5,2,1,4,3,5,3,1,2,3,1,2,0,1,2,2,2,4,3,2,0,0,1,0,6,2,1,2,0,2,2,0,1,1,0,2,2,1,2,3
Mean: 4.82660944206
Median: 4
Mode: 2 (42 times)
Range: 0 - 18
Deaths in the Senate, 1790 - 2022
1,0,0,1,0,0,0,0,1,1,0,0,1,1,1,0,1,2,0,2,0,0,0,0,2,0,0,1,0,1,1,1,1,1,2,0,4,0,0,1,2,1,0,2,0,2,1,1,0,0,3,0,2,2,1,1,1,4,2,0,2,0,2,2,0,1,1,3,2,1,0,3,2,0,1,2,3,1,0,1,1,0,1,0,1,3,1,2,0,2,0,2,1,0,1,0,3,0,0,0,1,3,2,2,3,0,0,3,2,1,2,2,1,0,3,3,1,4,5,2,4,3,4,2,2,0,3,3,7,1,1,2,2,3,3,5,3,1,3,3,2,2,3,4,0,3,5,2,1,2,4,5,0,1,3,5,4,1,2,3,0,3,1,3,6,0,2,1,2,1,2,1,4,2,1,1,1,0,2,1,0,2,1,0,0,0,1,1,3,0,0,0,0,1,0,0,1,1,0,0,1,1,1,0,0,0,0,0,0,1,1,0,1,0,0,0,0,1,0,1,1,0,1,1,0,1,0,0,1,0,0,0,0
Mean: 1.2961373390558
Median: 1
Mode: 0 (81 times)
Range: 0 - 7
Deaths in the House, 1790 - 2022
1,0,0,0,2,0,0,1,3,1,1,1,2,1,2,2,1,1,4,0,1,0,2,1,2,4,5,0,2,0,3,3,3,0,3,0,5,4,2,1,1,3,4,3,5,2,4,2,6,4,3,2,6,2,5,3,3,2,5,2,5,1,4,2,3,0,3,4,2,2,2,1,3,2,1,1,2,5,4,1,5,2,2,4,3,5,3,0,5,4,1,2,5,5,3,1,7,3,0,6,5,6,5,5,5,3,2,4,3,9,6,6,7,6,4,3,8,4,7,4,8,7,9,10,4,2,4,8,6,10,4,9,8,14,5,4,4,5,9,10,12,11,10,11,5,4,13,8,6,15,9,11,3,7,5,4,5,7,5,6,6,8,6,3,4,2,6,4,9,6,6,6,2,5,5,3,2,2,2,3,7,4,5,2,1,2,4,0,6,0,2,2,2,4,2,1,3,2,5,3,0,1,2,1,2,0,1,2,2,1,3,3,1,0,0,1,0,5,2,0,1,0,1,1,0,0,1,0,1,2,1,2,3
Mean: 3.5665236051502
Median: 3
Mode: 2 (44 times)
Range: 0 - 15
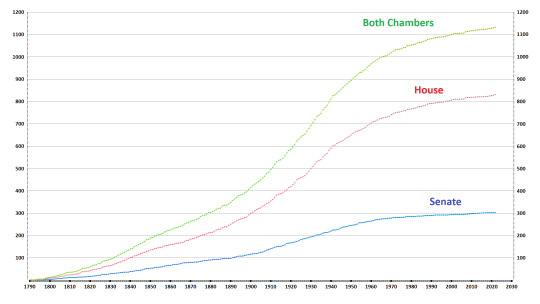
Cumulative deaths, line of best fit (x = year)
Total: y = 5.903216x - 10704.294079
Senate: y = 1.578283x - 2857.541287
House: y = 4.325016x - 7846.905813

When the y-axes are all scaled the same, the graphs are nearly identical, which shows that the number of deaths in the two chambers are roughly correlated (they have similar peaks and troughs, a spike in one usually sees a spike in the other)
Broken down by decade
1790s: 12 deaths, 4 in the senate, 8 in the house (33.3%-66.7%)
1800s: 23 deaths, 8 senate, 15 house (34.8%-65.2%)
1810s: 21, 4, 17 (19.0%-81.0%)
1820s: 35, 11, 24 (31.4%-68.6%)
1830s: 43, 9, 34 (20.9%-79.1%)
1840s: 49, 16, 33 (32.7%-67.3%)
1850s: 40, 14, 26 (35.0%-65.0%)
1860s: 35, 13, 22 (37.1%-62.9%)
1870s: 44, 11, 33 (25.0%-75.0%)
1880s: 40, 7, 33 (17.5%-82.5%)
1890s: 64, 17, 47 (26.6%-73.4%)
1900s: 78, 23, 55 (29.5%-70.5%)
1910s: 97, 29, 68 (29.9%-70.1%)
1920s: 98, 26, 72 (26.5%-73.5%)
1930s: 119, 24, 95 (20.2%-79.8%)
1940s: 90, 28, 62 (31.1%-68.9%)
1950s: 73, 19, 54 (26.0%-74.0%)
1960s: 51, 15, 36 (29.4%-70.6%)
1970s: 39, 8, 31 (20.5%-79.5%)
1980s: 29, 3, 26 (10.3%-89.7%)
1990s: 16, 4, 12 (25.0%-75.0%)
2000s: 19, 4, 15 (21.1%-78.9%)
2010s: 12, 5, 7 (41.7%-58.3%)
2020s: 6, 0, 6 (0.0%-100.0% ongoing)
Cumulative, by decade
1790s: 12, 4, 8 (33.3%-66.7%)
1800s: 35, 12, 23 (34.3%-65.7%)
1810s: 56, 16, 40 (28.6%-71.4%)
1820s: 91, 27, 64 (29.7%-70.3%)
1830s: 134, 36, 98 (26.9%-73.1%)
1840s: 183, 52, 131 (28.4%-71.6%)
1850s: 223, 66, 157 (29.6%-70.4%)
1860s: 258, 79, 179 (30.6%-69.4%)
1870s: 302, 90, 212 (29.8%-70.2%)
1880s: 342, 97, 245 (28.4%-71.6%)
1890s: 406, 114, 292 (28.1%-71.9%)
1900s: 484, 137, 347 (28.3%-71.7%)
1910s: 581, 166, 415 (28.6%-71.4%)
1920s: 679, 192, 487 (28.3%-71.7%)
1930s: 798, 216, 582 (27.1%-72.9%)
1940s: 888, 244, 644 (27.5%-72.5%)
1950s: 961, 263, 698 (27.4%-72.6%)
1960s: 1012, 278, 734 (27.5%-72.5%)
1970s: 1051, 286, 765 (27.2%-72.8%)
1980s: 1080, 289, 791 (26.8%-73.2%)
1990s: 1096, 293, 803 (26.7%-73.3%)
2000s: 1115, 297, 818 (26.6%-73.4%)
2010s: 1127, 302, 825 (26.8%-73.2%)
2020s: 1133, 302, 831 (26.7%-73.3%, ongoing)
The number of senators and representatives has grown significantly over the centuries. In 1790 there were only 26 senators and 65 representatives (28.6%-71.4%), but since 1963 there have been 100 senators and 435 representatives (18.7%-81.3%). The proportion of deaths has remained steady at the pre-1963 levels, so even though there are proportionally fewer senators, that chamber seems to have a higher death rate. Let's see how we can account for that
Cumulative, since 1960
1960s: 51, 15, 36 (29.4%-70.6%)
1970s: 90, 23, 67 (25.6%-74.4%)
1980s: 119, 26, 96 (21.8%-78.2%)
1990s: 135, 30, 105 (22.2%-77.8%)
2000s: 154, 34, 120 (22.1%-77.9%)
2010s: 166, 39, 127 (23.5%-76.5%)
2020s: 172, 39, 133 (22.7%-77.3%)
That's much closer to the 19%-81% we'd expect today, it'll just take a few decades for the total number of deaths to reflect the now standard 100-435 congress (the senate grows by 2 every time we admit a new state, the last of which was in 1959, but the house stopped growing in the 1920s because rural conservatives didn't want urban areas to gain more seats, so we've been stuck at 435 for a century; we briefly had 437 from 1959 to 1963 because congress only redraws the maps after the census and didn't want to take seats away from other states mid-decade. They just added two until the 1962 redistricting cycle could bring it back down to 435)
Only 15 of the last 233 years have seen zero congressional deaths; 1791, 1792, 1795, 1796, 1811, 1825, 1888, 1979, 1995, 2003, 2004, 2006, 2011, 2014, and 2017
Deaths peaked in the early 20th century and have plateaued to near zero in the last 30 years. I don't know why, but if I had to guess I'd say members of congress have had access to better healthcare post-World War II.
13 members of Congress were killed in office. 4 of them died in duels, 1 died in battle during the Civil War, 1 was killed by the Jonestown cultists in Guyana, 1 had his plane shot down by the Soviets (nearly causing WWIII), and of the remaining 6 only 2 were particularly noteworthy, Huey Long and Bobby Kennedy, both of whom were running for president to the left of an incumbent they famously butted heads with (funny how that works out).
Google says there have been 12421 total members of congress since the legislative branch first convened in 1789. 1133 out of 12421 is about 9.1%, and 13 of 12421 is 0.1%, which means congress is significantly safer than the presidency; 8 out of 46 presidents have died in office (17.4%), 4 by assassination (8.7%)
The most recent Senator to die was John McCain of Arizona in 2018, after which his seat saw an appointment, a resignation, another appointment, a special election, and just this month a general election to finalize his successor for the next full term.
The most recent Representative to die was Don Young of Alaska back in March. Incumbent Democrat Nick Begich's airplane disappeared in the Alaskan wilderness one month before the 1972 election, but he still posthumously defeated Young; Young would go on to win the special election to fill his vacancy the following year. He was the last sitting member of congress elected during the Nixon administration, and his seat flipped blue just this summer in a three-way special election between Democrat Mary Peltola and Republicans Sarah Palin and Nick Begich III (the latter two are COMPLETELY FUCKING INSANE). There was a three-way rematch in the general election this month, and while Peltola has pulled way ahead, the seat hasn't been called yet because she didn't get 50% in the first round. Unlike in Georgia where they hold an entirely new runoff election, Alaska has a ranked-choice system where the first and second place finishers advance and all the other losers' votes are redistributed to the winners until someone reaches 50%, "if my guy doesn't win, then I want this guy to win instead. If neither of them win, then this guy," and so on and so forth.
I've gotten off topic.
My point is that the House and Senate are both as close to being deadlocked 50-50 as they have ever been in their entire history. A tie in the House is impossible because there are an odd number of seats, but the number of vacancies that open up each year has fluctuated well beyond what would be needed to flip the current and incoming Houses to the other side. Republicans are gonna win a slim majority, 220-215, give or take, so if 3 or more republican representatives from competitive districts died, then the House could flip for the Democrats. This is HIGHLY UNLIKELY, but it would be SO FUCKING SATISFYING to see Kevin McCarthy be Speaker for less than a year. The House has never been as competitive as the Senate, but if enough vacancies opened up in 2023 they would be nationally televised races. 2007 saw four Republican deaths, 1988 saw four Democratic deaths, so it could go either way.
I haven't broken down any of the charts by party because the ideological shifts of the 20th century make it difficult to tell who was on which side (Democrats dominated both chambers from the 1930s to the 1990s, but a lot of them were conservative Dixiecrats who supported Republican presidents, so the party lines were blurred until Gingrich's revolution solidified the modern red states and blue states)
1918 saw SEVEN senator deaths! Can you imagine the historical impact if we had 7 special elections in quick succession today? It would be insane! They would be the most expensive races ever run, they would be thermonuclear, no holds barred, no pulled punches, tooth and nail fights to the death when the fate of the judiciary hangs in the balance (as long as Democrats hold it, Biden gets to fill vacancies as fast as they come open, but if Republicans flip it then he gets none, zero, zilch, nada, and all those openings will be held for federalist society nazis the moment Republicans win back the presidency)
#hsitory#american history#congress#house of representatives#senate#politicians#members of congress#death#deaths#stats#statistics#charts#graphs#data#2022#numbers#data visualization
14 notes
·
View notes
Text


Imagine cutting humanitarian aid to any country around the world without batting an eyelash. People at their most vulnerable -who are being massively ethnically cleansed and displaced -who are being permanently disabled because of destructive bombings and with whom will probably have little to no resources to help them manage these disabilities their entire lives, who have been and are at the brink of starvation and death... this is what these western/European countries are doing instead of the bare minimum which is a ceasefire.
Albeit it's not a surprise to me (or most of us) since settler-colonial and imperial countries like the US, Canada, Australia, and the UK have notorious histories of genocides against Indigenous people and have been (and currently are) perpetrators of imperial violence.
The United Nations Relief and Works Agency provides basic assistance for people -and to deny that life-saving help to Palestinian people (because we know what this is about) is aligning with IOF terrorism -and it undeniably makes these governments all equally complicit.
My MP's office is closed on weekends but I'll be calling and emailing her, and then emailing genocidal apologist Trudeau. Call and/or email your representatives. This is beyond heinous. I truly don't think these governments could sink any lower -be any more evil, and then they do and it's beyond disgraceful.
#feminist#social justice#free palestine#palestine#freepalastine🇵🇸#free gaza#settler violence#settler colonialism#current events#current news#imperialism#colonialism#member of parliament#us congress#united nations#unrwa#genocide#international court of justice#canada#united states#australia#united kingdom#italy#finland#austria#world news#world politics#war on gaza#end the occupation#ceasefire now
15K notes
·
View notes
Text
Call Your MoC: Pass a Clean Continuing Resolution & Why the Freedumb Cockus is Damn Dumb
Recharge your batteries, top up your phone, it's time to call your members of Congress. We need a clean continuing resolution and we need it now. Then we need the GOP to comply with their budget agreement. Calling works. Here's how.
SUMMARY: This urgent post highlights the impending government shutdown and the severe consequences it holds. It sheds light on the historical ineffectiveness of government shutdowns and their exorbitant costs. It emphasizes the detrimental impact on government employees and businesses depending on government contracts. The author passionately calls on readers to take action by contacting their…

View On WordPress
#Call Congress#Continuing Resolution#Executive Dysfunction#Freedom Caucus#Government Shut Down#Malignant#Marjorie Taylor Greene#Members of Congress#Narcissism#Narcissistic Delusion#Overproduced Elites#Republicans#Trump#Unproductive
0 notes
Text

Irit Tratt - Assisting Several Members of Congress
Irit Tratt is an alum of The George Washington University, where she received a Master’s in International Affairs with a focus on the Middle East. Since 2021, she has served as the Executive Vice President of The Young Israel in Scarsdale. She currently serves on the Board of the Jerusalem Center for Public Affairs.
0 notes
Photo
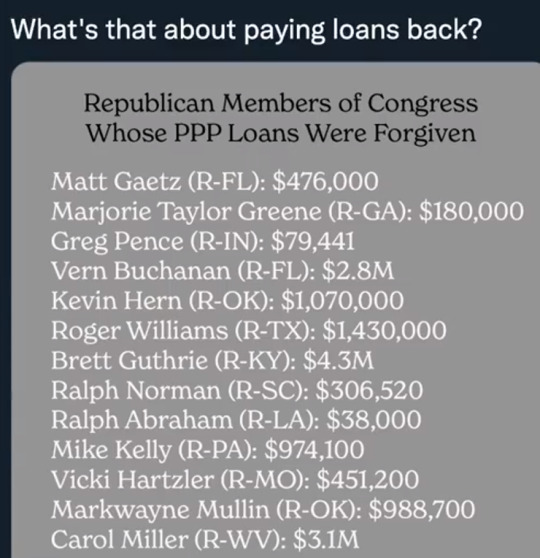
What? These lazy politicians can’t pay their loans back? Wow, look at the size of their forgiven loans!! Members of Congress, complaining. They think that they are privileged and it’s not about making anybody else’s life easier.
#ppp loans forgiven#members of congress#republican members of congress#people that think they are privileged#and they're not about making anybody else's life easier
0 notes
Text
37 members of Congress send letter urging investigation into Boston BDS map
37 members of Congress send letter urging investigation into Boston BDS map
The bipartisan effort against anti-Semitism was led by Reps. Josh Gottheimer (D-N.J.) and Don Bacon (R-Neb.), joined by 35 colleagues.
(June 22, 2022 / JNS) A bipartisan group from the U.S. House of Representatives is calling for the federal government to investigate the use of the Boston “BDS Map” by violent extremists and terrorists, and boost security for the organizations listed.
Sent to…

View On WordPress
1 note
·
View note
Text
andrew’s definitely gotten in trouble with his pr manager for tweeting things along the lines of:
“no mania inducing medication will compare to the euphoria i will feel the day donald trump drops dead”
#pr manager is like: andrew… this is the last time i’m gonna tell you#andrew: whats the point of democracy if i can’t exercise freedom of speech#pr manager: andrew it’s no longer about your image#at this point we are concerned the fbi is going to show up#andrew: neil has connections. i’m fine#they thought marketing andrew on social media would be good#they were sooooo wrong#because now andrew has a place to share every insane thing he’s ever thought#for instance—a tweet that just says ‘an alien googling: human clothes’#he’s on there advocating for lgbtq+ youth you KNOW HE IS#he’s cursing and mildly threatening members of congress for imposing these disgusting bills#one day he tweeted ‘does mitch mcconnell know he’s dead yet’#when mitch mcconnell stepped down from senate andrew tweeted ‘hopefully next he steps down from life’#unsurprisingly: this endears him to some people and makes others fucking hate him#and he’s such a shit. he does not care either way#he’s kind of just like: pr manager. you gave me a twitter and told me to tweet. i’m just doing what you asked me#they’ve threatened to change his password so many times#they actually did once but andrew reported the account so many times for defamation and fraud that it got suspended#and he made a new account out of pure spite#his pr manager is like: andrew nobody is going to want to sign you because of your public image#and andrew is like: ?? ok. they can lose every game then#(he knows he’s the best goalie)#ok i think that’s enough for now. however i will probably be back#andrew minyard#aftg#tfc#trk#tkm#the foxhole court#all for the game
314 notes
·
View notes
Text

Tommy Tuberville
#suitdaddy#suiteddaddy#suit and tie#men in suits#suited daddy#suited grandpa#suitedman#suit daddy#silverfox#suitfetish#buisness suit#suited men#suited man#suitedmen#americans#republicans#us senate#alabama#Tommy Tuberville#Member Of Congress
229 notes
·
View notes
Text
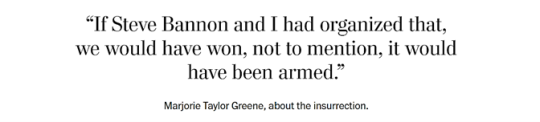
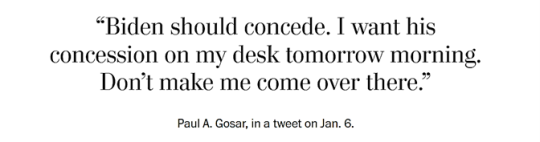
These politicians denied democracy on Jan. 6. Now, they want your vote.

This is a brilliant editorial by Washington Post cartoonist Steve Brodner. This is a gift🎁link, so anyone who uses it can read the entire article, even if they don't subscribe to the Post. Below are a few highlights, focused on the chief congressional players in the failed coup.
While the violent mob swarmed the U.S. Capitol on Jan. 6, 2021, aiming to subvert democracy and keep President Donald Trump in power, another group was already working on the same project inside. In an unsuccessful bid to prevent Congress from certifying the results of the 2020 presidential election, 147 Republicans formally supported objection to counting Joe Biden’s electoral votes.
Some have already left office. But as many as 117 members of Congress are running for reelection in 2024. Here they are, drawn together; a collection of American politicians engaged in using democracy in order to attain the power to subvert it. [color emphasis added]

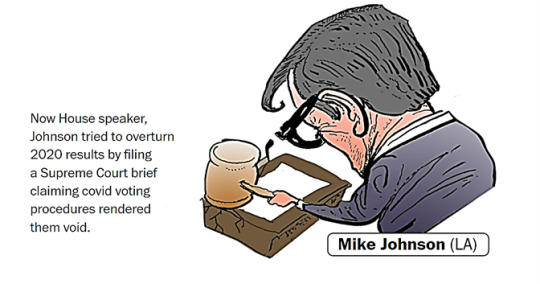


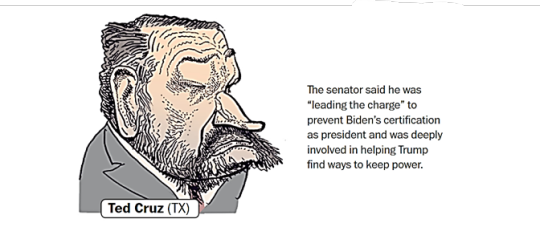

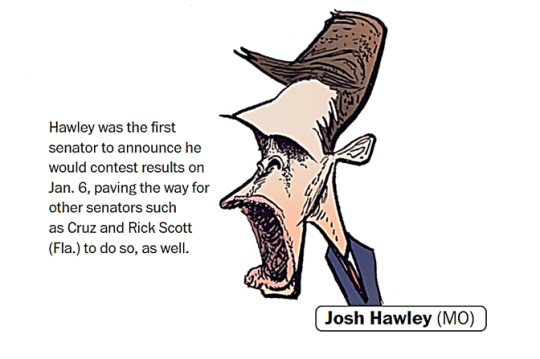


I encourage people to use the gift link above to see the minor GOP Congress members who aided and abetted Trump's attempted coup and now will likely be campaigning for reelection.
________________
NOTE: The order and arrangement of the congressional players above has been modified from the original editorial.
#jan 6th#117 seditious congress members up for reelection#insurrection#cartoon editorial#14th amendment section 3#steve brodner#the washington post
232 notes
·
View notes
Text

#a sitting member of congress just said that christian nationalism#is the only way to stop school shootings and '''''sexual immorality'''''' and you KNOW what that means#i am so afraid#vent
750 notes
·
View notes
Text
balls to the walls crazy that congress members can publicly call to have gaza flattened but as soon as they say hey you guys maybe palestinians are people too they get censured
#rashida tlaib#palestine#gaza#israel#free palestine#congress member 1: we should wipe gaza from the face of the earth and kill all palestinians because they're dirty terrorist animals#congress member 2: palestinians should be free and we should stop killing them#congress member 1: YOURE CALLING FOR A GENOCIDE!!!!!!!!#like girl what.#democracy!!!!#you can publicly call for the genocide of palestinians and suffer no consequences#but if you want a ceasefire and for your people to stop being oppressed and killed you're an anti-semite and a terrorist
33 notes
·
View notes
Text

#Will Rogers#Politics#Humor#Political Humor#Oklahoma#Cherokee#Comedian#Democrat#Congress#Populist I deny being a member..
13 notes
·
View notes
Text
Postcards from Ukraine to members of Congress – a suggestion 💡 🇺🇦 🇺🇸 📮
It's clear that House Speaker Mike Johnson is acting on orders from Donald Trump to prevent a Senate bill which includes aid to Ukraine from getting a vote in the House of Representatives. Johnson is a craven careerist who would sell his mother into slavery to please Trump.
The Senate bill ("Emergency National Security Supplemental Appropriations Act") could still be taken up – and would almost certainly pass – if just a handful of Republicans from moderate districts decided to support a parliamentary procedure called a "discharge petition" in order to bypass Speaker Johnson.
There are 17 Republicans in the House of Representatives in 2022 who won in congressional districts where Joe Biden had beaten Donald Trump in 2020. These Republicans from moderate districts would be a good grouping to entreat to support the discharge petition. A number of them have already expressed support for Ukraine in the past. It's a matter of getting them to put conscience ahead of their fear of Trump.
Below is a list of addresses of the district offices of those 17 Republican Representatives. If you are in Ukraine, buy a postcard and clearly write a short message which tells how you love freedom and how Putin's illegal war has affected you. It can be in English or Ukrainian. Use a Ukrainian stamp for postage and mail it as soon as possible.
Individuals need pick just 1 of the 17. But schools, businesses, clubs, and military units with at least 17 people can arrange to send one to each of the listed Representatives.
Be polite but urgent. Perhaps remind them that Ronald Reagan understood the dangers of Russian imperialism.
Rep. David Schweikert
14500 N. Northsight Blvd., Suite 221
Scottsdale, AZ 85260
USA
Rep. Juan Ciscomani
1636 N. Swan Road, Suite 200
Tucson, AZ 85712
USA
Rep. John Duarte
90 S. First Street
Turlock, CA 95380
USA
Rep. David Valadeo
2700 M Street, Suite 250B
Bakersfield, CA 93301
USA
Rep. Mike Garcia
27200 Tourney Rd., Suite 300
Santa Clarita, CA 91355
USA
Rep. Young Kim
180 N. Riverview Dr., Suite 150
Anaheim, CA 92808
USA
Rep. Michelle Steel
10805 Holder St., Suite 225
Cypress, CA 90630
USA
Rep. Don Bacon
13906 Gold Circle, Suite 101
Omaha, NE 68144
USA
Rep. Tom Kean
Hopatcong Borough Municipal Building
111 River Styx Road
Hopatcong, NJ 07843
USA
Rep. Nick Lalota
515 Hauppauge Road, Suite 3B
Hauppauge, NY 11788
USA
Rep. Anthony D'Esposito
229 7th Street, Suite 102
Garden City, NY 11530
USA
Rep. Mike Lawler
60 McAlpin Ave
Mahopac, NY 10541
USA
Rep. Marc Molinaro
49 Court Street, Suite 210
Binghamton, NY 13901
USA
Rep. Brandon Williams
421 Broad Street, Suite 7
Utica, NY 13501
USA
Rep. Lori Chavez-DeRemer
621 High Street
Oregon City, OR 97045
USA
Rep. Brian Fitzpatrick
1717 Langhorne Newtown Rd., Suite 225
Langhorne, PA 19047
USA
Rep. Jen Kiggans
283 Constitution Drive
Virginia Beach, VA 23462
USA
FAQ
Why physical mail instead of email or phone calls?
There's an enormous chance that your email would end up in a spam folder. Also, the Congressional email system tends to prioritize email originating from the districts of each individual House member.
Phone calls from outside the US are likely to be filtered out.
Unlike email or phone calls, a physical piece of mail has a real world presence. The recipient has to do something with it. You can't simply press DELETE to get rid of it.
Why postcards and not letters?
For security reasons. It takes less time and effort to inspect a postcard than a letter or parcel. Your mail will arrive sooner.
Why use postage stamps instead of a postage meter?
You want the recipient to know that you are REALLY from Ukraine. Using official Ukrainian stamps is a simple way to do that. When people see Україна or Ukraina on the stamp then they will know it originated in Free Ukraine. FYI: the letter Ї does not exist in Russian, recipients should look for this on the stamp.
Also, your stamp automatically turns the postcard into a collector's item. It is more likely to be saved and to serve as a continuing reminder of your urgent request.
Why send the postcards to district offices instead of offices in Washington?
Postcards from Ukraine will get more attention locally by local staff; if a sizable number arrive, it might even get mentioned in local media. In Washington, people tend to be more blasé about such things.
What is the proper form of address for House members?
Rep. or Representative before the surname – no distinction based on gender.
FOR REFERENCE: Here are electoral stats for the districts. The column marked R margin indicates the size of each Representative's winning margin in 2022. Rep. Duarte, for example, beat his Democratic opponent by a very narrow 0.4%

#invasion of ukraine#ukraine#stand with ukraine#ukrainian tumblr#український тумблр#ukraine aid now#aid to ukraine#us house of representatives#house members#листівки#118th congress#“maga mike” johnson#donald trump#trump is a stooge of putin and johnson is a stooge of trump#конгресс сша#дональд трамп#вторгнення оркостану в україну#деокупація#написати депутатам#добей путина#россия - террористическая страна#слава україні!#героям слава!#разом – до перемоги!
9 notes
·
View notes
Text
SAN FRANCISCO (Reuters) - U.S. Senator Michael Bennet on Tuesday sought information on how tech giants Meta, X, TikTok and Google were trying to stop the spread of false and misleading content about the Israel-Hamas conflict on their platforms.
"Deceptive content has ricocheted across social media sites since the conflict began, sometimes receiving millions of views," Bennet, a Democrat, said in the letter addressed to the company chiefs.
Visuals from older conflicts, video game footage, and altered documents are among misleading content that has flooded social media platforms since Hamas militants attacked Israeli civilians on Oct. 7.
"In many cases, your platforms’ algorithms have amplified this content, contributing to a dangerous cycle of outrage, engagement, and redistribution,” Bennet said.
The Senator's comments come after European Union industry chief Thierry Breton blasted the companies, demanding they take stricter steps to battle disinformation amid the escalating conflict.
In his letter, Bennet has posed a series of questions to the companies seeking details on their content moderation practices and sought answers by Oct. 31.
The social media firms have outlined some steps they've taken in recent days in response to the conflict. The short video app TikTok said it had hired more Arabic and Hebrew-speaking content moderators. Meta, which owns Facebook and Instagram, said it had removed or marked as disturbing more than 795,000 pieces of content in Hebrew or Arabic in the first three days since the Hamas attack. X and Google-owned YouTube both said they had also taken down harmful content.
But Bennet said those actions were not enough.
"The mountain of false content clearly demonstrates that your current policies and protocols are inadequate," he said in the letter.
Bennet also slammed the four companies for having laid off staff from their trust and safety teams in the past year that were in charge of monitoring for false and misleading content.
Twitter shelved 15% of its trust and safety staff and dissolved a related council in Nov. 2022 after Elon Musk acquired the company, cutting more staff last month, Bennet noted. Meta reduced 100 similar positions in January, while Google reduced by a third a team creating tools to counter online hate speech and disinformation, Bennet said.
"These decisions contribute to a cascade of violence, paranoia, and distrust around the world," he said.
"Your platforms are helping produce an information ecosystem in which basic facts are increasingly in dispute, while untrustworthy sources are repeatedly designated as authoritative."
17 notes
·
View notes
Text
So I called my representative and senators about the TikTok ban, like you do, and I got not a voicemail but a person for my representative which is not normal except for her office, its a nice touch.
Then the lady noting my complaint also asked me "is there anything else?" and I just said "I want the military to declare war on climate change, we declared war on a concept before we can declare war on the weather"
And you fucking know what? Its a good idea. We did declare a war on terrorism, a fucking concept, so yeah we can declare a war on weather. Climate change is a threat to the nation and extremes of hot and cold kill Americans. So fuck it LET'S DECLARE A WAR ON CLIMATE CHANGE.
The army corps of engineers can start making projects to deal with climate change and the regular troops can be physical labor to plant trees and dig canals. The military industrial complex can get behind it selling the armed forces all sorts of new toys that move earth, spread seeds, and monitor it all in real time.
Republicans want to support our troops and raise the military budget? GOOD it was a really bad heat wave and I want them to deal with that. Lets see the AirF...err Space Force put a solar array in space. It can filter out 5% of sunlight AND power everything on earth beaming down microwaves. 874 billion dollars? Awesome pass another spending package and lets give them a cool trillion dollars. I want all the microplastics out of the oceans. I want the Marines threatening people with unspeakable acts when they dump industrial waste.
All the ravenous rabid Right wingers are going to have to start being anti military OR get on board with saving the god damned planet and the human race!
#politics#ecology#climate change#climate#I'm not kidding call your members of Congress and demand we declare war on the climate#congress#senator#house of representatives
49 notes
·
View notes
Text
youtube
youtube
everyone on this website needs to watch these videos right now because no one seems to realize the implications of donald trump saying he would encourage russia to attack nato allies less than 2 days after one of his maga flunkies interviewed putin. an interview in which putin not only blamed Poland for world war 2, but mentioned Poland over thirty times in that interview, using the same line of "reasoning" he used to invade ukraine.
poland is a member of nato. if russia attacks poland, the three dozen other members of nato would be required to come to its defense.
this is not a joke. this should be terrifying to everyone.
#us politics#donald trump#politics discourse#it's not a coincidence that the media is fixating on biden's age#it's not a coincidence that not only are they not covering this shit but GOP members of congress are SHRUGGING IT OFF#it's insane. this is insane.#Youtube
12 notes
·
View notes
Last Seen Blogs

hellsbells-77
Hells Bells

kymbawee
Kymbawee


ocarina-of-memes
Yahaha!

macabrecabra
MACABRECABRA IS MAKING SILLY THINGS