#like they calculate your disease risk based on averages and so so so much data and math and shit THAT YOU KNOW NOTHING ABOUT!!!!
Text
the way tumblr talks about medicine makes me wonder how many of us here actually have critical thinking skills
#stop trying to explain shit you know nothing about so you can frame it negatively for clout!!!! literally knock it off!!!#there are so many valid opinions but i don’t understand this and therefore it’s bad “ is NOT one of them actually#fuck it’s far from perfect but seeing people talk about people I work with every day as if they’re monsters is honestly so tiring#it’s just all over my dash#if you read something and it confuses you and that makes you angry#the solution is NOT to make a tumblr post flaming it with all of your misinformation and undereducated opinions#“it is batshit to base dx criteria on statistics “ NO IT IS NOT NO IT IS NOT NO IT IS NOT ARE YOU STUPID???????#THIS IS STEM LITERALLY EVERYTHING IS MATH WHAT THE HELL DO YOU M E A N ?????#literally like!!! 90% of dx criteria involves statistical probability!!!! doctors prescribe statins because you are statistically likely#to develop heart disease or endure a major cardiac event#like they calculate your disease risk based on averages and so so so much data and math and shit THAT YOU KNOW NOTHING ABOUT!!!!#so why are you complaining about it as if you do!!!!!!!!#sorry. I know it’s in good faith for the most part but. it feels like straight entitlement to constantly complain and dog on doctors#I’m a victim of medical malpractice!!! i still show respect and understand that they’re individuals. people. human beings.#who are largely trying to help others#regardless of my personal experience with others in their field#sorry this is just a vent now#i love research I love science I love medicine please stop hating on every aspect of it and my community ty#delete later#not fandom#stinky speaks
8 notes
·
View notes
Text
Geo’s Everyman Guide to COVID-19
We need to be Rational about this disease in both directions. We need good, simple and reliable baselines, and we need to both react emotionally, and not overreact emotionally. Emotionless is death, as we are emotional creatures. Fake control of ones emotions is achieved through lies to oneself, not through enlightenment!
Everyman's Guide to "How to Think About COVID-19"
Data Analysis is hard, especially given the vast systemic bias in our testing response. This is my compressed analytical toolkit, built from mostly simple arithmetic, so its is easily accessible. And a general picture of what we are aiming for and why.
***
By my take, the most reliable datasets we have available to us to analyze are the Diamond Princess & South Korea. Based on my preferred source of worldometer.info/coronavirus/ We get a CDR of 1.8% to 2% known from these examples respectively, and a hard minimum of 0.35% CDR from the total population of Diamond Princess, assuming they were all exposed.
In my opinion percentage is not a good framework to understand these statistics, as our brains do not process it well. A better analytic model is to use fractions for the impact.
We can translate percentage easily; 1 in 55 to 1 in 50 expected range, with a hard minimum of 1 in 285 dead if exposed to the disease.
On Diamond Princess there were 3,711 passengers, 712 known to be infected with COVID-19, 13 deaths so far, with 7 people still in critical or serious condition. (I expect additional deaths.) Now, since the initial exposure aboard the ship from February 1st. 76 days to this writing, April 17th, have passed.
This CDR (Crude Death Rate) calculation has large error bars, as all the data is poor. But by itself it is simple math: [infected/dead] from a dataset. CDR isn't a hard number, but a variable which can change based on human interventions, overall its a good place to ground ones understanding of the disease, but not of a specific outbreak scenario as it doesn't provide universal extrapolation. Another number to be deeply concerned with is hospitalizations. The hospitalization rate is best conceptualized as “People who would likely die if they don't receive treatment.” An extreme risk if hospitals become overburdened, don't have enough resources and must begin triage.
Frustratingly, this number as a total is not as well tracked, but the peak hospitalizations number for the Diamond Princess was 35. So we know roughly how many needed treatment. Using the Diamond Princess Dataset we get; 4.9% of known sick (1 in 20). 0.9% of total population (1 in 106) needed hospitalization & could likely die without it.
Please understand that there are large error bars here, my data-analysis is framed from being as conservative as possible without being irrationally low, i.e. assuming risk. The ship was quarantined early, reducing the likelihood of exposure, but also a cruise-ship is something of a unique environment. However, it is less age and otherwise confounded than the memes around cruise-ships and disease would imply. As it can be considered an Optimistic & Definitive Cohort overall, I consider the Diamond Princess dataset the best available for extrapolation to population wide impacts.
Using this dataset, we can very simply extrapolate to populations, to give a rough idea of the risks we are facing. Framing the pandemic with different paradigms, we can develop a more fully realized understanding of why this disease is so concerning.
Note: We should be considered when assessing calculations results, as any extrapolation is fraught with potential problems, which is why there are far more complicated pandemic math models than what I am presenting.
A Range of Paradigms:
Good Case: If we assume everyone aboard the Diamond Princess was fully exposed, the most optimistic assumption possible, and extrapolate that to the US it means 1,000,000 people will die from this disease, if it spreads and isn't pushed into active spread extinction. From that frame, this is a minimum possible assessment of the outcome. This assumption produces 22,500,00 dead globally. This assumption however does not account for hospital overburdening, but the CDR in consideration is low enough that overburdening isn't and order of magnitude consideration. The right way to think about this analytical frame is that it is fully irrational to believe that the disease can be less bad than this analysis.
Bad Case: Using our data it is not hard to do an conservative bad case scenario, where the disease as we know it from CDR does its worst grounded in the data, we do nothing. But it is not a true worst case analysis where catastrophic systemic collapse is triggered, which is beyond the scope of our consideration.
Everyone gets the disease over the course of a relatively short (months-year) time-span, hospitals are overburdened, and the data from DP is roughly representative. 4.9% Death Rate after hospital overburdening. 1 in 20 Americans Die. In total 16 million Americans die. 382 million dead globally. Someone you know very personally die, you will possibly attend multiple COVID-19 related funerals.
Expected: We can do an Expected Case Analysis based on the Diamond Princess Infected CDR of 1.8%. We manage the catastrophic health aspects of the disease, and can ensure some form of effective treatment for all people who are infected, but the disease still saturates the population eventually. We assume the Dataset from Diamond Princess is roughly representative. 1 in 55 Americans dead. 6 million dead in the US. 140 million dead globally. This is close to the #FlattenTheCurve scenario over a full timespan.
Best Case: The #CrushTheCurve Best Case Scenario. Reaching an Extinction Timeline. Exponential Decrease in deaths, due to stopping the spread before saturation. We can't easily calculate the total timeline death rate for this approach, the variables are too human choices dependent. However we can see the benefit of this approach immediately and consider its long term implications as well.
To make a best case example explicit: South Korea has effectively stopped the virus, if their data is to be believed. They've had 217 dead, there will be some number more as those who are infected go through hospital and recovery. This is a tiny number compared to their population as a whole. South Korea is a living example of a best case scenario as events unfold. By contrast their Good case is 153,000 dead, their Bad case would be 2,500,00 dead, Expected 765,000.
This is the kind of radical difference every single, person, institution and government should all have been fighting for since the beginning.
As we stretch this into long term thinking, the dynamics get far more complicated. I can't elegantly factor all of it. However, important considerations are that as time goes on our ability to respond to the disease improves. We know more about it, and can scale our response capacity to better handle it. The CDR framings will all gradually reduce as we develop the capacity to better treat the disease on every level of analysis.
A huge boon is that if we can reach extinction timelines locally, life can return to near normal, locally, within weeks. With certain provisions, this near return to normalcy can be maintained, at a local level, regardless of the extinction timeline propagating globally. If any secondary outbreak restarts, we already have the collective consciousness to react to it efficiently with minimal social impact. The Lockdowns are only essential & necessary because we are so unprepared. South Korea, didn't need full lockdowns, because they were well prepared due to previous infectious outbreaks in SE Asia.
***
Risk Management Path Forward:
There is too much to consider to get a complete and detailed picture into a single post. This is to set out the general picture so there is a clear understanding to being from, each layer needs to be considered for specifics and context.
Government and Business:
We've talked extensively about Testing and About Contact tracing, Scaling PPE and Medical Resources. These are all fundamentally essential to a governmental and broad scale response. We need to know who is sick and who is exposed, so those people can be cared for and avoid spreading the disease further. Then have protection for those treating them, the society at large, and have the ability to treat people beyond the paltry capacity we have in place for peak loads.
A competent government response is very subject to particulars of a region; namely, population density & demographics, compliance, socio-economics, climate, response capacity and leadership competence. There is no universal response paradigm that is also optimal everywhere. 5 Week Lockdowns are our core message, as this is the simplest implementation, and the most impactful, but it by itself isn't the solution. This 5 Weeks of Lockdown is time bought to react and extinct the virus in community spread, so life can return to near normal, and resources can be focused to locales where the disease is not extinct.
Impact at a Personal Level:
Wearing mask, any filter medium, up to and including a mere bandana, if washed regularly, reduces spread [you can fold in a [salted] shop towel to increase filtering effectiveness]. Any barrier reduces spread both from you, if you are infected, and to you, if someone who is near you is infected. Both directly, in your viral load exposure & transmission numbers in any viral particle encounter, and in the R0 doubling rate, reducing your general probability of exposure.
An N95 mask is roughly 89% effective against the virus, significantly reducing viral load, whereas the average DIY Mask is in the 50-70% range. Also there is evidence a salt based treatment to a filter medium can reach 100% effectiveness, as salt has anti-viral properties on a filter medium. tinyurl.com/saltmask
Super Spreaders Events: If eliminated, radically reduce the total spread. A few people spread the disease to huge numbers of others, most people take actions that reduce their spread effect, like wearing a mask and staying home if they feel unwell. If door-knobs are sanitized regularly, and other surface vectors are sanitized as well, an region that has achieved extinction can maintain it's low spread rate without an extensive burden.
We know the disease doesn't survive long on cardboard, 24hr. But we also know it can survive a long time on plastic 3+ days (up to 9 days depending on plastic type iirc). So with manageable quarantines local areas can still have trade with areas with a higher infection rate. Soap and Bleach spray are two powerful tools of disinfection. Also Alcohol and Hydrogen Peroxide.
Beyond hand-washing a powerful protectant is to make your household a secure space, #safecircle, as background stress itself is a risk factor for infection & lowered immune system. This means upon returning home yo do such as; disinfectant spray your shoes and bottom of shoes, launder clothes, shower with soap, shampoo & body wash, & wear PPE when out. Quarantining all packages that enter the home for 24 hours, along with using disinfectant spray on plastic packaging. Along with appropriate additional precautions.
General Health, Self Protection and Prophylactics: Reducing the likelihood a low viral load exposure becomes an infection, also taking precautionary steps that can help in reducing the severity of an infection. We know confidently that Vitamin C & Citrus is beneficial if sick with COVID-19. Zinc has a known history of helping fight viral infection. Vitamin D is known to be beneficial during respiratory stress, as is fresh air, so going outdoors, and supplements are both hugely beneficial, also green nature itself has a strong anti-stress load experiential effect.
Reports of various forms of Chloroquine being helpful in treatment means that highly available Tonic Water just might have a beneficial disease fighting and also protective effect, it is known to do this for Malaria.
***
Key Takeaways:
It is far easier to manage disease risk in a local area after the disease is extinct in the population, regardless of details. Once we “Extinct” life gets back to near normal, but we can also respond much more effectively to a subsequent outbreak, as we share a collective consciousness about the disease and its danger.
There is a lot that you & those you know and can contact personally can do to reduce the disease & its impact, personally and at scale. #Masks4All #CrushTheCurve #5WeekLockdown
Note: I am a team lead at endcoronavirus.org run through NECSI.edu, founded by Yaneer Bar-Yam in collaboration with Nassim Taleb
1 note
·
View note
Text
Why You Need to Stop Counting Calories. Seriously. Stop.
When it comes to counting calories, it can be a very slippery slope.
Yes, it’s helpful to have an approximate idea of calories — generally veggies will be low and sweets will be high. However, there are many reasons to make your food choices based on more important factors — like whether the food you’re eating contains organic fruits and vegetables, grass-fed meat, etc.
Calorie counting often leads to building an unhealthy relationship toward food and distracts you from what really matters to maintain a happy and healthy diet.
Here’s why it’s a little more complicated than the old rule of “taking in less than you use” when it comes to achieving your health goals.
Important facts:
Everyone has a unique set of dietary needs.
The FDA has guidelines and recommendations for caloric intake for people based on age and physical activity. But there are so many other factors involved that determine what an individual requires in their diet including hormones, activity, and stress levels. It’s important to know yourself and your body. Assessing what you eat and customizing your diet to your unique needs will help your body feel its best. If you exercise often or with high intensity, it’s likely you’ll eat more than the average person. Keep a simple log of the types of you eat – not the calories – and how you feel as a result after just a few hours. Then, adjust your diet accordingly.
The definition of a calorie: “A unit of heat equal to the amount of heat needed to raise the temperature of 1,000 grams of water by one degree Celsius.” (1)
You would need a laboratory to accurately calculate the calories of your food. You would need another laboratory to tell you how many calories you utilize in a day. Unless you have laboratory equipment and duplicates of everything you eat, there’s no way to measure caloric intake precisely.
The FDA allows up to a 20% margin of error on calorie counts on product packaging. (3)
Meaning, if you are counting calories, your final number isn’t going to be accurate. For example, you may think you’re consuming 2,200 calories, but your actual intake could be up to 2,640 or as low as 1,760. It’s strange to take the time to calculate data with unpredictable variability, only to end up with an incorrect measurement.
All calories are not created equal.
Some foods “high in calories” carry no nutrition and are considered “empty calories.” You could eat 1,500 calories of hot dogs, chips, and soda, or you could eat 1,500 calories of grass-fed beef, broccoli, and an apple. Empty calories can give you a quick boost of energy, but they do very little to encourage good health and bodily function. By sticking to a healthy diet filled with real, whole foods, you avoid foods that do very little to maintain your daily health.
How to know how much food you actually need?
If you’re eating the right foods, it is good practice to trust your body. Your appetite will tell you when to eat and when to stop eating when you feel satisfied. By concentrating on eating nourishing foods, your body will recognize the quality of the calories you’re taking in. You’ll find that if you’re eating real, whole foods, you won’t need to eat as much in quantity.
Tips to eating the right amount of food
Slow Down and Chew Your Food
Studies have shown that by eating slower and chewing more, people consume fewer calories and get more nutrients out of their food. It takes up to 20 minutes for your stomach to send signals to your brain when it’s satisfied.
Mechanical chewing is the first stage of digestion. Chomping your food into smaller bits helps your digestive system break down your food more effectively, making sure you get more nutrients out of your meals. The increased surface area allows enzymes throughout your digestive tract to do its job better and reduces the risk of gastrointestinal issues.
Eating slower can also make you happier! Experts say that savoring your meals with gratitude can lead to happier living. (2)
Practice Mindful Eating
Oftentimes, people will overeat if they are snacking as a secondary activity, e.g., while working at their desk or watching TV. Instead of scrolling through your phone while eating lunch, put your phone on silent and place it somewhere where it won’t distract you (like your purse or pocket). Take the time to appreciate the taste, texture and smell of your food, instead of scarfing it down quickly. Tip: This is a really good article on mindful eating if you want to find out more.
Eat Nutrient-Dense Foods
Consuming nutrient-dense foods like fruit, vegetables, healthy fats, and quality proteins will keep you satiated for longer. They’ll also provide your body with more energy and nutrition, preventing you from feeling fatigued during the day. Not to mention, the benefits of eating nourishing foods goes beyond weight loss. You’ll also be decreasing your risk of disease and naturally improving your overall health — think a happier gut, better skin, and a naturally happier mood.
Discover More: The 7 Best Paleo Sweeteners and How to Use Them
The post Why You Need to Stop Counting Calories. Seriously. Stop. appeared first on PaleoPlan.
Source: https://ift.tt/10qRbxJ
6 notes
·
View notes
Link
Thiv Sophearith stands on top of the Ministry of Environment building with the sun beaming down on him. The sky is clear, aside from a thin veil of smog hovering low against the skyline.
“You can see a lot of construction sites, so [these developments] can cause the PM2.5 to be a little bit high here,” he says, pointing to a cluster of scaffolding-wrapped developments where sparks fly from saws and drills.
As chief of the ministry’s Air Quality, Noise and Vibration Office, Sophearith has spent just over a year monitoring Phnom Penh’s levels of PM2.5, the most damaging air pollutant to human health, which exists as tiny particles created from dust and burning fossil fuels. These particles can contribute to heart disease, strokes and lung illnesses such as cancer and emphysema.
The device that collects the data arrived in April last year and lives beside two acidic deposition pollution monitors on the roof of the ministry building, from which the Tonle Sap river is not much more than a coin toss away. Before this machine, there was no officially recognised monitor of the capital city’s PM2.5 air pollution, leaving the issue a mystery to all.
“Thirty-one,” says Sophearith, peering into a metal cupboard in the centre of the rooftop to read the device’s monitor. This is the most recent hourly measurement of the number of micrograms of PM2.5 particles per cubic metre of air – above the World Health Organisation’s (WHO) recommended level of 25. A pole shooting up from the cabinet absorbs the particles and quickly calculates the average amount every hour, which is then added up to find a monthly average for government records.
In March, the average rate was 29, Sophearith says – well above any of the average rates of the nine months measured last year, which jumped around between levels as low as 9.9 and as high as 19.8. “This level is not a high level,” he insists of the 31 reading.
Phnom Penh has seen worse. Data from another Phnom Penh PM2.5 monitor, at the Olympic Stadium about a ten-minute drive away, tracked by global air pollution monitoring platform AirVisual, shows a morning in early April when the level skyrocketed to 111.
Generally speaking, these monitors should be picking up similar if not the same rates of PM2.5, according to Yann Boquillod, a Beijing-based data scientist and founder of AirVisual.
Comparatively, the nation’s annual records aren’t bad. AirVisual data from 2017 places Phnom Penh’s average annual air quality as much better than Hanoi and Beijing’s – with a PM2.5 level of 27.4 in Cambodia’s capital compared to 42.6 in the Vietnamese capital and 52.7 in China’s. Still, in the more developed urban centre of Paris, PM2.5 hovered just over 15.
Also, because of unchecked burning practices in Phnom Penh, from a household garbage pile to a farmer’s crop to a landfill, localised pollution peaks are common, leaving individuals’ health at serious risk.
“The [average] level in Phnom Penh for a year… is above WHO [recommendations], so it means you are definitely losing some years of your life, months of your life,” says Boquillod. “How much is not really known, but it’s having an impact on your life.”
The WHO attributes 20,400 deaths in Cambodia in 2012 to air pollution, with 11,400 caused by outdoor pollutants. The particles contributing to this pollution include ozone, lead and PM2.5, as well as carbon monoxide (CO), nitrogen dioxide (NO2) and sulphur dioxide (SO2), with the latter three having been monitored by the government since the turn of the century.
“The major air pollution that we are concerned about is PM2.5, because it can cause problems for humans,” says Sophearith. “If we breathe it in, it will cause health effects, cancer. First, it can make a sore throat and then if we breathe deeper and deeper… the problem is more serious.”
A key issue with PM2.5 is that these tiny particles travel easily – across country borders and cities, deep down in the lungs. Heart disease, stroke and lung illnesses are a common consequence.
The WHO’s recommended country interventions for Cambodia include public transport solutions, solid waste management, household access to clean fuels and cooking stoves, and the development of markets for renewable energy.
Alternatives to harmful gas, oil and coal energy in Cambodia are proving elusive. According to a recent report published by Kohe Hasan, a partner at Reed Smith law firm who has done extensive research on renewable energy in the Kingdom, a lack of incentives and clear guidelines laid out by the government prevents potential solar energy investors from entering the market in a country with ample solar potential.
Sophearith has some recommendations for individuals to protect themselves against pollution: those living or working along roadsides should wear masks; and motorbike drivers should avoid peak traffic hours.
“We conducted an air pollution emission inventory in Phnom Penh city in 2015,” Sophearith says. “We found that the big source of air pollution… came from transportation.”
Since then, he has made recommendations to city hall to try to improve traffic congestion: improve traffic planning in the future to avoid traffic jams. He also says he wants to work more with the Ministry of Public Works and Transport to discuss enforcing emissions testing for cars and motorbikes. Additionally, he wants to see regulations on secondhand vehicle imports, but said it’s still unclear how this should be decided: “It could be based on the year it’s produced or based on the quality of the engine and also emissions.”
Sophearith sees other contributing factors, like rubbish and crop burning, as inevitable. Landfills and crop fields are far from the city, he reasons, so they’re not problematic. But in practically the same breath, he notes how far PM2.5 particles can travel, even from other countries, like Thailand and Vietnam.
While Boquillod says government regulation is key to cutting pollution, he adds that public awareness and engagement is also fundamental.
“Out of curiosity, do you know why the government is not publishing their monitor’s data?” he asks in an email.
In Beijing, where he’s based, Boquillod points out that great change has been created in air quality in the past 15 years due to public pressure and enthusiastic government response.
“If there is no awareness, like you probably have in Phnom Penh, things are not going to change. I can pretty much tell you that in Shanghai, awareness is pretty low, so people haven’t been pushing and the government didn’t see any reason to make changes,” he says. “In Beijing, it’s a totally different story. People have been keeping up high pressure and the government has had to make changes. That’s why they’ve closed so many factories, power plants, coal-fired power plants and so on. People are not allowed to burn coal in their house [for] their heating.”
China has cut its PM2.5 levels by an average of 32% in the past four years, which could extend life expectancy by 2.4 years compared to 2013’s average, according to a recent study by the University of Chicago in the US.
Looking forward, Boquillod says it’s hard to predict whether Phnom Penh’s pollution will get better or worse – especially if the government doesn’t have plans for tight regulations or to make the public aware of the severity of the problem. “If they’re not, it’s probably just going to increase,” he says.
Sophearith, for his part, says his department is keeping tabs on pollution levels and there’s no need to alert the public to the current rates.
“This level is not a high [enough] level that we need to alert or anything like that,” he says. He aims to continue learning more about Phnom Penh pollution levels as he attempts to halt their escalation – having just finished monitoring PM2.5 for a year, the ministry will now have comparative data moving forward. One day, says Sophearith, he hopes to get the funding to buy four more PM2.5 monitors to scatter throughout the city.
“Maybe in the future [we] will monitor ozone as well,” he suggests.
For now, Sophearith’s visits to the rooftop monitor a few floors above his office will have to suffice.
14 notes
·
View notes
Text
Adverse reactions: Guillain Barre, TTS and the fine mesh net
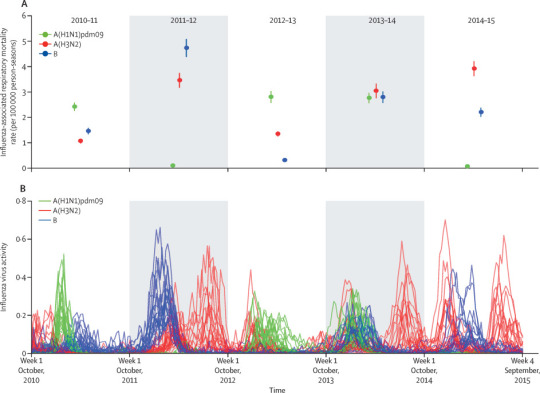
The COVID vaccines have rare – but serious – side effects. Based on 21 million vaccinated Australians (and 5.6 billion globally) we can base our calculation of benefit versus risk on hard numbers. (See rollout risk versus benefit.)
But some of my vaccine-hesitant friends are getting alarmed by a very fluffy set of figures.
Credit: Cosmos Magazine
These are the adverse effects that are reported following immunisation. From January to August of this year, 52,849 events and 476 deaths have been recorded in the publicly accessible Database of Adverse Event Notifications (DAEN). This database has captured a huge number of events – because Australia is extremely vigilant about monitoring the vaccinated.
Those on sentry duty feel their responsibility keenly. As paediatric immunologist Kristine McCartney, director of the National Centre for Immunisation Research and Surveillance (NCIRS), explained to me, Australia had ramped up its vigilance in the last 10–15 years after some batches of flu vaccines caused extremely high fevers in children, while others were potentially linked to an increase in Guillain Barre Syndrome (more on GBS shortly).
In the 2000s, the system relied on doctors to tick the boxes against a checklist of predicted side effects. Now the limited checklist is gone and the net has been cast much wider. “Our message to the doctors is report, report, report,” says McCartney.
On sentry duty – paediatric immunologist Kristine McCartney.
As well as capturing information from GPs, NCIRS established a fully automated surveillance system that sends out texts to people three days after vaccination to ask them about side effects. It’s known as AusVaxSafety – and so far it’s received 2.4 million replies. Self-reporting is not as accurate as a doctor’s report, but the trigger for AusVax to follow up is if there’s been a hospitalisation, says McCartney. These data also give valuable information about people who aren’t experiencing any issues – something missing from the doctors’ reports. A third arm of vaccine surveillance sweeps across hospitals.
With such a fine-meshed and widely cast net, it’s inevitable that events that have nothing to do with the vaccine will be captured. Indeed the database reads like a laundry list of every malady known to woman or man, including one report of foaming at the mouth, another of hair loss and a third of painful erections. Just what you’d expect if you care to ask about the health of more than 10.9 million people (as of 22 August) who have received their first dose. Vaccination against COVID certainly doesn’t make other ailments disappear.
And people will still die in the period after getting vaccinated. Some deaths clearly have nothing to do with the vaccine, for instance those occurring in late-stage cancer patients, or those with severe heart disease.
But then there are grey areas.
So how do you decide what is related to the vaccine and what is sad coincidence?
With such a fine-meshed and widely cast net, it’s inevitable that events that have nothing to do with the vaccine will be captured.
That’s where the Therapeutic Goods Authority (TGA) comes in. Like detectives at the scene of a crime, their job is to trawl through the 54,000 suspects caught in the net.
TGA head John Skerritt described to me the tools his team uses to pare away the bystanders from the true culprits.
For starters, they check the background rate of certain ailments. For instance, as younger women have become eligible for vaccines, the database has captured reports of heavy menstrual bleeding. So far, says Skerritt, analyses show that these reports are not higher than the background rate – heavy menstrual bleeding is reported as a common problem affecting 25% of women of reproductive age.
Similarly ‘ordinary’ blood clots are not infrequent – some 17,000 are reported in Australia each year, 46 each day. So it’s no surprise that many of those receiving Astra, who tend to be older people, would present with a blood clot in the weeks after vaccination. Haematologist Huyen Tran, who heads the Thrombosis and Haemostasis Unit at the Alfred Hospital in Melbourne, is confident that these cases are not linked to the vaccine.
It’s the unusual cases that alert the TGA to follow up, especially if the symptoms have a clear biological link to the immune system, and if they occur within four weeks of vaccination. (According to the WHO, most vaccine-related events occur within a month of vaccination as the immune system is mobilising its forces.) To trawl through the list of possible suspects, the TGA assembles a detective team composed of statisticians and medical specialists to interrogate the medical history of each patient.
TTS blood clots
A clear-cut case of a vaccine-related adverse effect is thrombosis with thrombocytopaenia syndrome, or TTS, first reported in the UK in March after the mass rollout of the Astra vaccine.
Blood clots are not unusual – they occur in about 1 in 1000 people each year. But mostly they occur in older people and in the legs or lungs.
TTS clots are highly unusual. They were occurring in people under 40 (where the normal rate is about 1 in 10,000 per year), and in unusual places: in the brain (cerebral vein) or the intestine (splanchnic vein). And besides excessive clotting (thrombosis), these people were also experiencing excessive bleeding (thrombocytopenia).
As of 9 September, the TGA detective team has picked up 132 of TTS cases out of 10.2 million Astra vaccine doses. There have been 8 deaths. So the average risk of contracting TTS is around 1.3 in 100,000. The risk of death is less than one in a million. The risk of dying from COVID is 1 in 100. (See rollout risk versus benefit.)
Credit: Cosmos Magazine
Occasionally the TGA are faced with borderline cases. The 22 August COVID-19 vaccine weekly safety report described five mild cases of thrombosis with thrombocytopaenia syndrome, or TTS, in older people that were associated with a second shot of the Astra vaccine.
An independent group that included experts in infectious disease, vaccinology, haematology, respiratory medicine, immunology and public health was called in to review these cases.
The panel were able to clearly dismiss the vaccine as the cause of two cases and were dubious about the other three. However, according to the report, “further testing to clarify this is underway and an update will be provided once test results are available”.
The tone of the report illustrates the fine-toothed comb that is being run along the reported cases. “I don’t think we’re missing much, we have excessive awareness,” says Tran.
Guillain Barre Syndrome
While most TTS cases stand out like a sore thumb, other suspects are much more difficult to confirm as true signals above the noise.
Guillain Barre Syndrome has long represented an unsolved problem when it comes to vaccines. It is a creeping paralysis of the peripheral nervous system, usually starting from the toes up. In severe cases, people can end up on a respirator. But for 75–90% of cases, the effects are temporary.
While most TTS cases stand out like a sore thumb, other suspects are much more difficult to confirm as true signals above the noise.
Vaccines aside, GBS typically crops up in people a few weeks after they’ve recovered from a viral infection. After fending off the virus, the immune system mistakenly directs its fire against the myelin sheath of peripheral nerves. Mercifully that friendly fire is rare: GBS occurs at a background rate of about 1.7 in 100,000 people and is more common in flu season.
The unsolved question is: can that friendly fire also be elicited by vaccination? In 1976 in the US after a rollout of swine-flu vaccinations, public health authorities saw a slight increase of a further 1 in 100,000 above the background rate. Ever since, health authorities scrutinise GBS numbers after every new vaccine, says neurologist and GBS expert Geoffrey Herkes, at Sydney’s Royal North Shore Hospital.
Up to 5 September, the TGA has received 110 reports of GBS associated with 10.2 million shots of the Astra vaccine This equates to 1.1 in 100,000. No one is really sure if this is a true signal above the noise.
As the weekly TGA safety bulletin puts it: “Following an investigation, the TGA, along with other international drug regulators, have so far been unable to establish a clear link between GBS and Vaxzevria (AstraZeneca).”
Herkes says the data from the UK, which has delivered far more Astra vaccines than Australia, suggests the maximum possible increased risk could be one extra case per 100,000. “Coincidence or not, this is not a reason to panic about getting an Astra shot,” says Herkes.
YOUR COVID TOOLBOX: This article is one of a five-part series where Cosmos editor-at-large Elizabeth Finkel hunts down all the facts and figures you need to understand COVID-19 vaccines.
Elizabeth Finkel: A letter to my vaccine-hesitant friends
Are COVID-19 vaccines experimental?
The rollout: The danger of vaccines vs the danger of COVID
What we know about Ivermectin: correlation is not causation
Adverse reactions: Guillain Barre, TTS and the fine mesh net published first on https://triviaqaweb.weebly.com/
0 notes
Text
Flu Deaths Per Year

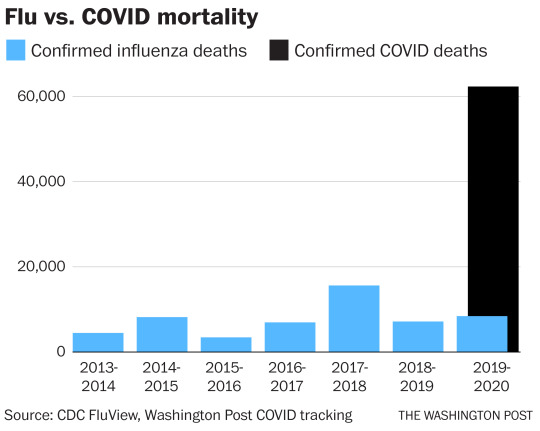
Fall traditionally marks the start of flu season in the U.S. and this year is expected to be more difficult than usual due Covid-19. Yesterday, President Trump once again downplayed the threat posed by the coronavirus by exaggerating influenza's death toll. He tweeted that many people die from the flu each year, 'sometimes over 100,000', a claim that was quickly debunked. Twitter hid the president's post, tagging it with a warning that it violated its rules about spreading misleading and potentially harmful information related to Covid-19. Up to October 07, 211,000 Americans had died from Covid-19, a toll that is expected to continue rising during the winter months. So just how wrong was the president about the flu and how many people die from it annually?
Flu Deaths Per Year Chart
Flu Deaths Per Year 2018
The outbreak was the third influenza pandemic to occur in the 20th century; it followed the 1957 flu pandemic and the influenza pandemic of 1918–19. The 1968 flu pandemic resulted in an estimated one million to four million deaths, far fewer than the 1918–19 pandemic, which caused between 25 million and 50 million deaths. Sep 24, 2020 Find out how many people die from the flu every year, and how flu deaths in 2019-2020 compare to the death toll of previous seasons.

Seasonal influenza viruses can occur throughout the year in the U.S. but they hit hardest during the fall and winter, peaking between December and February. Data from the Centers for Disease Control and Prevention shows that the 2019-2020 flu season involved two waves of activity and moderate severity with 38 million people contracting influenza, 18 million visiting a health care provider, 400,000 being hospitalized and 22,000 sadly passing away. That is a significantly lower total than the 100,000 deaths tweeted by President Trump. Even the deadliest flu season of the last decade, 2017-2018, had a lower death toll with an estimated 61,000 people dying.
This chart shows the estimated number of deaths due to influenza in the U.S. by season.
© Provided by Statista estimated number of deaths due to influenza in the U.S.
US data on influenza deaths are false and misleading. The Centers for Disease Control and Prevention (CDC) acknowledges a difference between flu death and flu associated death yet uses the terms interchangeably. Additionally, there are significant statistical incompatibilities between official estimates and national vital statistics data. Compounding these problems is a marketing of fear—a CDC communications strategy in which medical experts 'predict dire outcomes' during flu seasons.
The CDC website states what has become commonly accepted and widely reported in the lay and scientific press: annually 'about 36 000 (Americans) die from flu' (www.cdc.gov/flu/about/disease.htm) and 'influenza/pneumonia' is the seventh leading cause of death in the United States (www.cdc.gov/nchs/fastats/lcod.htm). But why are flu and pneumonia bundled together? Is the relationship so strong or unique to warrant characterizing them as a single cause of death? David Rosenthal, director of Harvard University Health Services, said, 'People don't necessarily die, per se, of the (flu) virus—the viraemia. What they die of is a secondary pneumonia. So many of these pneumonias are not viral pneumonias but secondary (pneumonias).' But Dr Rosenthal agreed that the flu/pneumonia relationship was not unique. For instance, a recent study (JAMA 2004;292: 1955-60(Abstract/Free Full Text)) found that stomach acid suppressing drugs are associated with a higher risk of community acquired pneumonia, but such drugs and pneumonia are not compiled as a single statistic. CDC states that the historic 1968-9 'Hong Kong flu' pandemic killed 34 000 Americans. At the same time, CDC claims 36 000 Americans annually die from flu. What is going on?
Meanwhile, according to the CDC's National Center for Health Statistics (NCHS), 'influenza and pneumonia' took 62 034 lives in 2001—61 777 of which were attributed to pneumonia and 257 to flu, and in only 18 cases was flu virus positively identified. Between 1979 and 2002, NCHS data show an average 1348 flu deaths per year (range 257 to 3006). The NCHS data would be compatible with CDC mortality estimates if about half of the deaths classed by the NCHS as pneumonia were actually flu initiated secondary pneumonias. But the NCHS criteria indicate otherwise: 'Cause-of-death statistics are based solely on the underlying cause of death.. defined by WHO as `the disease or injury which initiated the train of events leading directly to death.' In a written statement, CDC media relations responded to the diverse statistics: 'Typically, influenza causes death when the infection leads to severe medical complications.' And as most such cases 'are never tested for virus infection..CDC considers these (NCHS) figures to be a very substantial undercounting of the true number of deaths from influenza. Therefore, the CDC uses indirect modelling methods to estimate the number of deaths associated with influenza.' CDC's model calculated an average annual 36 155 deaths from influenza associated underlying respiratory and circulatory causes (JAMA 2003;289: 179-86(Abstract/Free Full Text)). Less than a quarter of these (8097) were described as flu or flu associated underlying pneumonia deaths. Thus the much publicised figure of 36 000 is not an estimate of yearly flu deaths, as widely reported in both the lay and scientific press, but an estimate—generated by a model—of flu-associated death. William Thompson of the CDC's National Immunization Program (NIP), and lead author of the CDC's 2003 JAMA article, explained that 'influenza-associated mortality' is 'a statistical association between deaths and viral data available.' He said that an association does not imply an underlying cause of death: 'Based on modelling, we think it's associated. I don't know that we would say that it's the underlying cause of death.' Yet this stance is incompatible with the CDC assertion that the flu kills 36 000 people a year—a misrepresentation that is yet to be publicly corrected. Before 2003 CDC said that 20 000 influenza-associated deaths occurred each year. The new figure of 36 000 reported in the January 2003 JAMA paper is an estimate of influenza-associated mortality over the 1990s. Keiji Fukuda, a flu researcher and a co-author of the paper, has been quoted as offering two possible causes for this 80% increase: 'One is that the number of people older than 65 is growing larger..The second possible reason is the type of virus that predominated in the 1990s (was more virulent).' However, the 65-plus population grew just 12% between 1990 and 2000. And if flu virus was truly more virulent over the 1990s, one would expect more deaths. But flu deaths recorded by the NCHS were on average 30% lower in the 1990s than the 1980s.
At the 2004 'National Influenza Vaccine Summit,' co-sponsored by CDC and the American Medical Association, Glen Nowak, associate director for communications at the NIP, spoke on using the media to boost demand for the vaccine. One step of a 'Seven-Step `Recipe' for Generating Interest in, and Demand for, Flu (or any other) Vaccination' occurs when 'medical experts and public health authorities publicly..state concern and alarm (and predict dire outcomes)—and urge influenza vaccination' (www.ama-assn.org/ama1/pub/upload/mm/36/2004_flu_nowak.pdf). Another step entails 'continued reports..that influenza is causing severe illness and/or affecting lots of people, helping foster the perception that many people are susceptible to a bad case of influenza.' Preceding the summit, demand had been low early into the 2003 flu season. 'At that point, the manufacturers were telling us that they weren't receiving a lot of orders for vaccine for use in November or even December,' recalled Dr Nowak on National Public Radio. 'It really did look like we needed to do something to encourage people to get a flu shot.' If flu is in fact not a major cause of death, this public relations approach is surely exaggerated. Moreover, by arbitrarily linking flu with pneumonia, current data are statistically biased. Until corrected and until unbiased statistics are developed, the chances for sound discussion and public health policy are limited.
Cisco Anyconnect Secure Mobility Client Desktop App free download - Cisco AnyConnect VPN Client for Linux, Cisco AnyConnect, Cisco VPN Client, and many more programs. Download the VPN installer from MIT's download page, Cisco AnyConnect VPN Client for Windows. These cookies are necessary for the website to function and cannot be switched off in our systems. They are usually only set in response to actions made by you which amount to a request for services, such as setting your privacy preferences, logging in or filling in forms. Cisco anyconnect secure mobility client app download. AnyConnect Pre-Deployment Package (Windows 10 ARM64) - includes individual MSI files Login and Service Contract Required anyconnect-win-arm64-4.9.05042-predeploy-k9.zip 17-Dec-2020.
Flu Deaths Per Year Chart
I am a pediatrician and this propaganda affects my practice directly.
Flu Deaths Per Year 2018
Kenneth Stoller
International Hyperbaric Medical Association
Download the official µTorrent® (uTorrent) torrent client for Windows, Mac, Android or Linux- uTorrent is the #1 bittorrent download client on desktops worldwide. https://texload157.tumblr.com/post/657620605791846401/utorrent-for-m1-mac.
0 notes
Text
The average of these 5 death clocks could be the day you die
You may think Halloween is the time for trick-or-treating, dressing up as a Fortnite character, or carving pumpkins. But you’re wrong, it’s the time to face death.
Despite fearing death, humans have always been weirdly obsessed with anticipating their final day on earth. Now in the digital age, this morbid fascination with predicting death has taken form in digital death clocks. Death countdown tools are often used as a joke but some financial institutions, health organizations, and insurers are using its data as a life expectancy calculator.
If you could, would you want to find out when you’re going to die? Here’s a list of sites that could work out when you’re doing to die, because you are going to die:
1. Death Clock
The Death Clock is a friendly reminder of the Internet that life goes on, one after another.
To estimate how many seconds you have left to survive, the site uses a few key questions: date of birth, gender, BMI (body mass index), smoking habits, and general outlook on life - classified as pessimistic, optimistic, and sad for whatever reason. Death clock calculations are based on a study that estimates the expected years of life lost due to obesity in an adult.
Before looking at the exact date of your funeral, the tool asks for information about your BMI, emphasizing the risk of excess weight gain - because they so explicitly refer to it as a "fatal risk of becoming fat".
By answering the questions truthfully, the Death Clock declared my "day of personal death" Sunday, June 24, 2091 - giving me a life of 2,293,545,812 seconds (tick tock, tick tack).

By examining its (basic) knowledge I have adjusted my lifestyle choices. If I were a smoker, the Death Clock would be seven years away from my life, if I was obese, I would have five more vacations, and if I had a "sad" view of life, the other two. While this may not be the most scientifically accurate tool for predicting your last days of breathing, it is a wake-up call on how you will live your life today.
2. Big Life: Life Expectancy Calculator
After not fully relying on the day of my death given by The Death Clock, I took my own deathless heartless fascination to another darkness of the web. Here is Big Life's Life Expectations Calculator.
The goal of this death calculation is to provide information on meaningful health risks by estimating the emergence of deaths associated with certain unhealthy lifestyle characteristics.
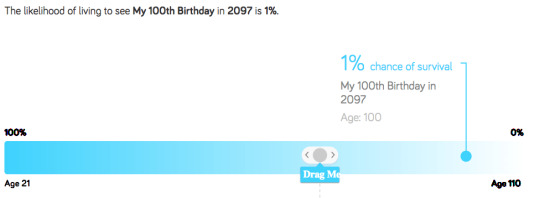
The test begins by asking what life event you would like to experience, as well as understanding your predictions of what natural event will likely happen next year. It could be your grandchildren's wedding, your retirement, or your grandchildren's graduation. I chose my 100th birthday which should be in 2097.on my 100th birthday, I'll make one percent of it.
Behind Project Big Life, researchers created a calculator that examined the health behavior and healthcare records of about 60,000 Ontario residents. People with unhealthy behaviors spent 42 more days in hospital than people with healthy behaviors.
This website made the inevitability of my death seem real and for that reason, I will never return to it.
3. Hwid.org
hwid.org reminds you of the importance of living every moment to the fullest, unfortunately reminding you that your life is coming to an end soon, one second at a time.
After providing me with my age, gender, BMI, drinking habits and the amount of exercise I have done each week, I am congratulated: “As soon as you know, you will die. More on August 6, 2081 ”
I have previously used various epidemiological studies and data, which calculated that I would live to a ripe old age of 84 - meaning that 26 percent of my life would not have already passed. Each box represents one week and each row is 52 weeks wide or about a year of my life.
Filled boxes have already passed, and those that have not been filled have not yet arrived. My life is being loaded until it finally faces death.

If you love your parents, it also makes you question how much time you spent with your family. This explains why most people, including myself, leave home when they are about 20 years old. As a result, you're suddenly going to spend time with your parents every month, seeing them twice a month on average.
Given the other way, it means you will spend most of your time with your parents, you have already spent.
Given a few guesses about your age and your parents, your under-26s can stay together, even less, which is seen twice on average per month, meaning only 676 more days together.
4. SunLife Death Clock
Ah, another website to remind me of my death (I can't be enough). This time it's Sunlife's Death Clock, a site that estimates how old you would be if you lived in the UK.
First, you need your age, gender and location for the test. This then includes asking more in-depth questions about your lifestyle: how much alcohol you drink, how much you smoke, whether you see both sides when you cross the street, if you sit in an office all day, how much TV you watch, your sleep habits, your Diet, how many times you exercise, how many teas you drink and how many times you brush your teeth. Basically, lots of information.
As you answer such questions, your lifespan will jump with age depending on your answers. I no longer felt judged.
5. Years You Have to Live, Probably
Nathan Yao, the creator of this life expectancy tool, uses the knowledge of Forest Gump: "Mother always said that witch was a part of life."
Flooddata estimates use visual data to show how long you will live depending on the average age, but the reality is that people die at different ages, which Ya admits is a big design flaw - which probably inspired the name ...
It animates the possibility of dying at 110 years of age (the oldest person in the United States). After entering your age and gender, Interactive Graphic uses Social Security Administration data to simulate your potential lifetime.
Thus seeing your chances of survival at a certain age is both a cause for concern and a hypnosis. In the GIF below, the line shows the chances of you surviving to see the next year (which will decrease with your age) and presents the possibility of eliminating the face of the planet before each running point naturally ends your time.

As well as predicting when you will die, Flooddata also provides fun data on how you are likely to die and how other people die.
Using data from the Centers for Disease Control and Prevention, Yau has designed a beautiful and captivating visualization detailing when and how you are likely to die, depending on your gender, color and age.

“Each point represents a representation of your imitative life, and as each year goes by, so do your more simulated shelves. The color matches the cause of death and the bars on the right keep an eye on the percentage. Ya writes, in the end, you leave the possibility of dying for every reason.
Once you see how you are probably dying, scroll down the age to zero again and see how many diseases and ways you have survived so far - well done, but death is coming
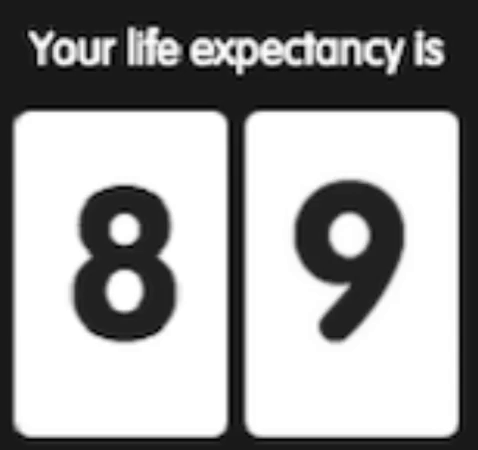
With an average of these five death clocks, I would die at about 86 years old - and that would probably turn into a “circulation” issue. When will you die?
0 notes
Text
wrx vs sti insurance
BEST ANSWER: Try this site where you can compare quotes from different companies :cheapinsurancequotes1.info
wrx vs sti insurance
wrx vs sti insurance is different because the cost is on the lower end. As you may have guessed, insurance rates depend on the model you drive, and the car you have or need. We’ll be answering the question, “Is car insurance broken down to be a lower cost?” That’s because the cost is calculated based on the level of risk you present. If you want better protection, an older model or with a better technology that keeps your driving legal, that might mean better rates. There are several other factors that can affect your insurance, such as: While insurance and car insurance are similar, there are a few different factors that both are factors. If your insurance needs change, make sure to look into . For example, can you claim car insurance on a teen driver ? The insurance company may charge more if the young driver is a teenager. Your driver’s license is also often associated with lower premiums. But, car insurance can often be a costly add-on.
wrx vs sti insurance and can tell me how to choose my car insurance company. I m sorry my insurer is out the door. Please help to get this resolved!! I would just like to know how my agent will be able to help me get a new quote from my current provider. They need some basic information I am a former insurance agent and lawyer and have been out of business for 20 years. I need home insurance and am very satisfied with the rate I ve been looking for for over a year and the quotes are really close I am currently paying $3.99 per month for an 18 yr old driver who can in order to get a new car to the shop and the price for some insurance is less than what I originally went in. I m currently looking for a new car in the mail for a 2013 Honda Accord I have no problems getting a new quote with my current provider this is one of the worst insurance companies in the state for car insurance? I have a 2016 Honda Accord and am paying $99 for.
wrx vs sti insurance. Also see my rates as a top provider by the insurance provider. Thanks and have a great day. Nowadays is the good time to have a company. You need to shop for car insurance as fast as possible and to have the best rate on the car you need to insure. Insurance is not an extension of health insurance. Insurance covers expenses related to injury, illness and disease. Health insurance is an extension of auto insurance and provides health coverage for drivers that have a high health risk and don t want to pay for medical expenses at the time of the accident. Medical expenses can range from hospitalization and repair costs. This insurance covers the medical and surgical expenses for you and your passengers. It also covers lost wages if you are injured in the car crash. It is important that you choose the right insurance company that offers you enough coverage, with a company that specializes in covering people with a higher risk. A good insurance company that offers good coverage will deliver better rates to drivers. You can choose the.
How much does it cost to insure my Subaru Impreza?
How much does it cost to insure my Subaru Impreza?
The is about $7 per month for a fully-voiced Impreza.
Do I have to get a separate insurance policy for my Subaru Impreza?
The answer to the question of how much does insurance cost for your Subaru Impreza comes down to cost. Since Subaru Impreza insurance rates are higher than other , however, it is still a very affordable car.
Are auto insurance quotes likely to be $75 per month?
The answer to this question comes down to how much auto insurance you should purchase for your Subaru Impreza. For example, auto insurance quotes can be $75 per month to $85 per month depending on your age. The first number that comes to mind is the premium you will pay for your car insurance policy. The will likely include a factor such as your credit score, driving history, and driving record. For example, a person in good health could receive and can secure a car insurance.
Shedding light on car insurance prices
Shedding light on car insurance prices and how it impacts your coverage decisions, it’s nice to know you have options when it comes to car insurance. While there aren’t many comprehensive insurance resources online, you should at least have some understanding about their coverage options, discounts and financial measures of a car insurance policy. All it takes is a search online for articles like this, and you should be well on your way to a more confident experience. One thing that many of the insurance experts agree is that people may get their insurance from both different companies, if there could be such a thing as a . Insurance companies are so well knowns nowadays with that they can offer you a high-quality insurance policy, but you could be missing out on a good deal. A quick check of can save you time and energy when dealing with each and every company, but if you’re looking for your first time insurance shopping, don’t be discouraged. If you’re looking for an insurance provider.
Modified Subaru Car Insurance
Modified Subaru Car Insurance Rates by State and City: If you’re on Android, you’re not alone. According to an , average car insurance rates by city are: Some countries, like Mexico, have car insurance rates higher than average for drivers. But the rates vary dramatically. In some places, the rates are much more than what you can find in your state, while other states can be much cheaper. In this article, we’re going to look at the cheapest car insurance rates by US states. Some states have high auto insurance rates because of high crime rates, although it’s not true in all states. The data indicates that these lower insurance costs will be very different on average for a 30-year old driver compared to someone living in the same state. What you can expect to pay based on where you live. You can choose either of the below rates for your car insurance policy. While car insurance rates vary, based on your situation the rates are the same for every state.
Subaru Impreza insurance overview
Subaru Impreza insurance overview: You may be eligible for a car insurance discount in some states. However, in some states, you may not be eligible if you are in an accident while being insured by one insurer or another. Because of the risks and damages covered in a car insurance policy, it’s best to use a discount to ensure you get a better discount than the one you get if you are using either insurer exclusively. Here are the top discounts you can save on car insurance: If you have insurance, you’ll have to pay more to stay with your insurer. However, some insurers allow you to get a lower car insurance discount if you maintain a good credit score. Some car insurance companies are known to lower your car insurance premium. While some companies offer discounts for paying your premiums on time, others may only offer discounts you can apply for when you need to buy a policy. Car insurance companies use your driving record to calculate your premium. If you have an automobile with a history of traffic violations or.
All Subaru Models Insured – both UK & Imports
All Subaru Models Insured – both UK & Imports vehicles covered by our policies. With our new model and service vehicles covered by our auto insurance, we can insure all models on the streets of America.
Other policies available – In addition to being available in the US – Imago, Corolla, Mazda, Maserati Miata, Porsche, RAV4, BMW R8, Jaguar ZX-F, Lamborghini, Jaguar S8, Land Rover, Mini Cooper, Pontiac Grand Sport, Plymouth Rock, Royal Challengers, Mustang, Rolls Royce – more to include in your Imago policy.
Car insurance can cover you in the following situations:
In all but three U.S. states, liability insurance – no matter who s at fault for an accident – is mandatory, and only applicable in the at-fault states. If you are involved in an accident, you should file a claim with your policy. You also have to prove that you caused the accident on your own insurance policy,.
Average Subaru WRX insurance rates
Average Subaru WRX insurance rates: Some are cheap for owners of older, more expensive SUVs, while others are cheaper for those with good driving records. When looking at car insurance rates for the 2016 Subaru WRX, it’s important to remember several factors that can impact your rates on the WRX’s price. You’ll want to consider which company offers the best price for your circumstances and budget. For more reliable insurance rates, try using Insurify. ©2020 Compare.com. All rights reserved. Compare.com is a registered trademark. Compare.com Insurance Agency, LLC is a Virginia domiciled licensed insurance agency in 51 US jurisdictions. Licensing information may be found above. Compare.com does business in California as Comparedotcom Insurance Agency, LLC (License: 0I22535). Admiral Group plc. is a majority member of compare.com. The average annual car insurance rate for a new Subaru WRX is $.
0 notes
Text
life insurance pregnancy
BEST ANSWER: Try this site where you can compare quotes from different companies :insurecostfinder.top
life insurance pregnancy
life insurance pregnancy, birth weight, or pregnancy, insurance for birth control, miscarriage, the amount you pay for your coverage and your monthly payment history. As a baby, you can’t take a chance with your birth control coverage. The insurance company will only cover when your mother is pregnant. You can sign up with when she is pregnant. So, if you want to get your birth control coverage, it’s recommended!
Although you’re not legally required to purchase birth control even with your employer, that doesn’t mean birth control is out of the realm of options. The main question is, does insurance usually cover birth control? When you are wondering, “Do I really need birth control?” or “What is the best method for birth control and what I’m getting coverage for?” You do not have to give your consent first. Once you have found a provider who accepts birth control.
life insurance pregnancy insurance coverage options.
You’ll need to be the baby’s father on top of the life insurance policy, otherwise there would be no money going to the mom. If the mother is the owner of the policy, the coverage will automatically protect her on top of the policy. The policy also goes in force upon signing the birth certificate. Your husband’s father will typically be the mother-in-law. If the infant does not have the policy, he will also be the parent. In this event, the parents will be dependent on each other to financially support them. If there were no one who could pay for the debt that the children still suffer from the insurance company’s policies, the children could not get their own life insurance policy. In other words, the children could not get off the debt. No matter what happens, most children’s life insurance policies go into effect as soon as a couple of years.
life insurance pregnancy: If you are pregnant with a life insurance baby: If you are pregnant with a birth that lasts more than three months, such as over five months or a year : If you are pregnant if you are pregnant and are not yet married; or if your children have had a minor life event such as marriage; or if you have been convicted on one of the following offenses: We are here to help you. We work to provide you with the best and provide you with a very reliable plan that is both affordable and offers the same level of coverage with the lowest rates. We’ve been doing everything from signing up to getting our policies set up. and are in demand. For more information we don’t stress! To find out more about us, find out how we can help you with any type of insurance plan. We’re happy to be able to help you and let you know why. There are some additional insurance plans on your list to consider.
4 types of insurance you should have by 30
4 types of insurance you should have by 30/60/15. Because every driver needs the same types of insurance, they need to shop around. But with the exception of medical payments and collision insurance, drivers should always shop around for their policy to make sure they have the correct amount. For instance, you might find that your policy requires you to add comprehensive and collision on top of everything. This can get complicated, particularly if you re in the middle of shopping around. But with good driver discount, cheap car insurance can help keep a customer on the policy for as long as 30 to 60 days. For more insight, see our guide on how to save on car insurance for high-risk drivers, how much car insurance is necessary for high-risk drivers and who can buy low coverage. There are many factors that could determine how a driver wants to use an auto insurance policy. These factors include: While these are some of the biggest factors in determining how an insurance company will use your information, they can still change as time goes on and.
Insurance
Insurance Company of America is rated A (excellent) by AM Best, and its financial strength is 2 (About average) – the lowest score possible. Based on the information provided in the of our sample application for auto insurance quotes, Allstate is offering some great insurance solutions that might be a great fit for you. However, this company has no intention to sell you on auto insurance from a third party. That being said, if you have auto insurance with Allstate, you should always check your insurance company out to see what coverage is available before you make a move. A free online insurance quote comparison tool can allow you to easily compare auto insurance quotes and find the cheapest rate. Some of our policyholders have already done this and are happy with their coverage and may even be looking for affordable insurance. But, don’t despair, insurance is not an expense to keep. Insurance costs have risen steadily over the past 20 years or so even as auto insurance costs have.
The best cheap car insurance in Utah
The best cheap car insurance in Utah comes from these companies, ranked by premium according to how reliable they are in terms of customer service, cost of coverage, and customer satisfaction, among other factors. Utah residents who buy car insurance from these companies are guaranteed a rate that is higher than the average. The list of top car insurance companies in Utah includes the , but a few other factors have to be considered when insurance shopping for Utah drivers. Auto insurance companies in Utah will look at a variety of personal factors about each driver. For instance, many of these factors are considered when the insurance company sets auto insurance rates. Others that are considered are age, gender, marital status, credit score, car make and model, etc. To find your best rate, it’s smart to shop around and compare multiple quotes from the National Association of Insurance Commissioners (NAIC), and the to find the best car insurance in Utah for you. Since insurance products vary significantly in price from one company to another, it’s a good idea.
_GFC_Insurance
_GFC_Insurance_Rates_by_Service_Age=30
Compare
If you’re looking for more ways on , you may have found the right fit. Here are a few more things you can do to help lower your insurance rates. Before you start looking for affordable car insurance in Oregon, it’s a good idea to go over all the options available to help you save big on your premium. From cheap and basic to fancy features, there are a lot of options to get the best bang for your buck. Don’t let those add-ons scare you off from considering the best car insurance for drivers with a questionable driving history. NerdWallet also researched the companies in the Pacific Northwest to help you find the best pickings.
Cheapest for good drivers with a clean record
For Oregon drivers with good credit and driving records,.
How does pregnancy affect getting approved for life insurance?
How does pregnancy affect getting approved for life insurance? The main reason for pregnancy is the risk of certain diseases. Life insurance companies don’t look at every family against pregnancy, so if you already have a history of getting pregnant, you may be considered a higher life risk. Life insurance companies consider every life event differently, which means it could take some time between when the insured becomes pregnant and the policy is accepted. At this point, there may not be a large difference, even between the risk of the pregnancy and their risk of death from heart disease, cancer, etc. Birth after the age of 18. This can lead to a range of life changes to take place with the exception of a change in your life insurance policy. You may be able to buy an additional product to cover your pregnancy and your potential pregnancy. As we touch on the life insurance policy, there are some questions on life insurance, such as where can I go if I have a life insurance policy after my pregnancy. There is still a great variety out there. .
Life insurance calculator
Life insurance calculator to compare quotes for a couple of cars. When it comes to insurance, you don’t want car insurance. If you’re trying to save money, you should compare car insurance from multiple insurers. But the best way to do it is to have questions answered. That’s why we’re listing the answers below for you. Remember that the amount your car insurance company pays depends on every factor, so it’s hard to say who’s the biggest risk when you only want the lowest possible rate. Also, remember that car insurance companies know about a driver’s history. There are two ways to determine a car’s credit score, though insurance companies can calculate risk based upon many factors and data. Even your job might be compromised in case of a DUI (even if you were a good driver). If your credit score has been impacted, insurers will look back 20 years for the last date of your car inspection. The car insurance under.
How much Life Insurance do you need?
How much Life Insurance do you need? We tell you this: The answer is yes. And you may just as easily have to make the biggest changes – like when your health has deteriorated, and you simply have no money to protect your loved ones. And if you have significant savings to cover those needs and can t afford premiums like we do - you can always use our help to save some of those costs off your balance sheet. If you think you can just stop making payments and move to a reduced value, that is a bad idea. The good news is that if you have savings on your life insurance policy and you are no longer required to make payments, you may be able to reduce those bills for your family. It is a little like a house that is still there for everyone we’ve talked to, so we think you could find a way to minimise the financial disaster that could otherwise cause it. With a little bit of thought and planning you could have a life insurance policy where you need only pay the premiums and.
Questions asked about getting life insurance when pregnant:
Questions asked about getting life insurance when pregnant: How can I change how to be a better mother, better husband, and mother, daughter and father are some of the challenges women face in today s healthcare world. Many questions, some that can help make life insurance that is for moms and dads, is a concern. With the birth of more children, many mothers and dads realize, their sons can probably expect for life more dependent upon them than their mothers and fathers for life. And not only is that true to their children’s life yet some of the same insurance policies are also available. It’s important to have the ability to change your plans, including having children or move so that you are more covered under your policy. You may need to change some of it for your children as they age, but you’ll need to do it as well. In that sense, you can’t say there isn t a choice when buying a life insurance policy, but it is important to have the ability to change. The.
What is life insurance?
What is life insurance? A lot of people may not know what it is, but the answer for you may seem overwhelming at first. The bottom line is to find a balance between the death benefit of life insurance versus the expenses from an illness or accidents. Here are the main goals of life insurance: Understanding how insurance works is only half the story, so when it comes to the relationship between life insurance and survival, it can be difficult to figure out which is right for you. Finding the right agent in Colorado is also necessary. Most agents are independent, so they can help you fill out the life insurance policies they work with you to determine the best fit for you. If you have just purchased an insurance policy with them and your policy is in place, you may be looking at a little more than a full set of coverage. In fact, you could end up with that exceed the coverage provided by your life insurance policy. For example, your wife has two life insurance policies: her own policies, and those with a.
Life insurance and Pregnancy
Life insurance and Pregnancy Insurance is not insurance at ALL. It’s up to you to figure out when you should get a policy. There are six things that make up a policy for someone in the US: a family member with the legal name or your parents’ name. The name you’re asking to have on your insurance policy, and as the name, must be on the insurance policy. A driver who is driving on holidays without a car is one of the most valuable assets that a company is allowed to give back even if it’s not going to be in use for a car accident. The is the most common type of insurance so there is nothing else for your insurance company to use. There are a lot of insurers in the US to use and it is a very long process and a lot of paperwork that will go through the insurance company in the process. At first, there was an insurance policy that was used by the driver. Then there was an insurer that will never.
0 notes
Text
Testing the power of touch
This article is one of a series of Experiments meant to teach students about how science is done, from generating a hypothesis to designing an experiment to analyzing the results with statistics. You can repeat the steps here and compare your results — or use this as inspiration to design your own experiment.
Your fingertips are sensitive to touch. They have to be, to help you type, get dressed and pet kittens. But are they more sensitive than your leg, arm or back? How would you be able to tell? This is something that’s pretty easy to test. And it’s also easy to turn into an experiment. All you need is something to measure with, a blindfold or two — and a lot of very patient friends.
A test called two-point discrimination can help to determine which parts of the body are more sensitive than others. Two-point discrimination refers to the ability to perceive two points touching you as two actual points instead of one. You can demonstrate this by poking yourself or your friends (with permission, of course). But to turn this into an experiment, I need to start with a hypothesis. This is a statement that I can test.
My hypothesis: Fingertips are more sensitive to two points of contact than the arms or upper back.
Poking and prodding
To test my hypothesis, I need volunteers. But I can’t just run around the office and start prodding my colleagues. It is wrong to perform an experiment on someone without their consent. My friends and colleagues need to know what I am doing, why I’m doing it and if there are any risks.
I wrote up a protocol — a plan of action that details exactly what I am going to do and why. I also drafted a consent form. This is a form my colleagues can read and sign, noting that they understand any risks from my experiment. I submitted the protocol and the form to an Institutional Review Board. This is a group of scientists that determines whether my experimental plan is safe.
The group of scientists I consulted evaluates studies conducted by students at the Regeneron International Science and Engineering Fair reviewed my documents. The board suggested changes I could make to the wording of my consent form, so that no one would misunderstand my experiment. And they approved my study. I was free to do science.
When my colleagues at Society for Science & the Public gathered for a monthly staff birthday celebration, I struck. My editor, Sarah Zielinski, helped as I asked my coworkers to line up, sign a consent form and put on a blindfold. Sarah also wrote down information about each participant’s age, gender and whether they were right- or left-handed.
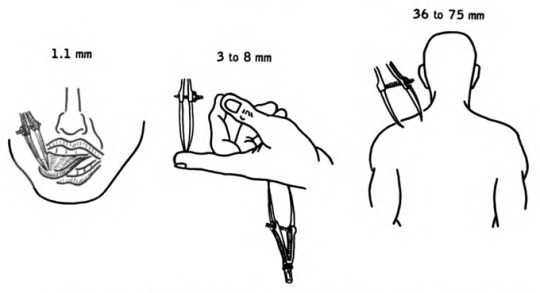
To test touch sensitivity, doctors use a pair of calipers and move them slowly apart, trying to see when someone can feel two points instead of one. This is an experiment you can do, too. Though maybe not on someone’s tongue.House, Earl Lawrence. Pansky, Ben./Wikimedia Commons/Public Domain
I asked each person to hold out their dominant hand (the right hand, if someone is right-handed). I then carefully touched a pair of calipers to the tip of their index finger. (Calipers are a device that’s used to measure the distance between two points.) I started with the calipers completely closed, forming a single point. Then I moved the points farther apart and touched the person’s fingertip again. Every time I touched their finger, I asked them if they felt one or two points of contact. I widened the calipers each time, testing 0, 0.5, 1, 2, 5 and 10 millimeters (between 0 and 0.39 inch).
At first, people would say they only felt one point. Of course, they did; the calipers were only a single point. But as the calipers expanded, people began to feel two points. Sarah carefully noted when each person felt two points instead of one. I took a measurement of each distance twice.
Then I did the same experiment with each person’s dominant lower arm. I poked them gently about 50 millimeters (2 inches) below their elbow. Each time I asked if they felt one or two points. This time, I tested between 0 and 50 millimeters, waiting to stop measuring when people told me they felt two points of contact. I repeated this on my coworkers’ upper backs.
To make sure I was detecting a difference that wasn’t entirely accidental, ideally I would have tested 41 people. Unfortunately, the experiment took a long time. Many people didn’t want to wait around. They had work to do. I ended up with 38 participants. Not bad.
Dealing with data
After I collected all my data, I organized it in a spreadsheet. First, I de-identified the data. I didn’t leave any information in the spreadsheet that could be used to identify each coworker, including their name. This is important to make sure that everyone is treated fairly and that their information is kept private. It might not seem like a big deal when being poked with calipers. But when studies address diseases such as cancer or depression, privacy is very important.
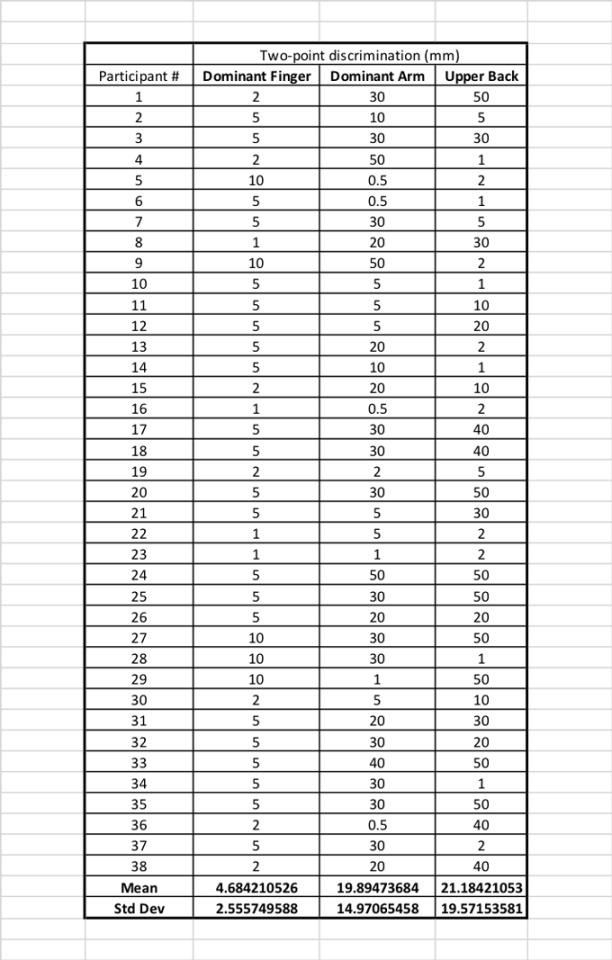
This is the data from my two-point discrimination experiment. Notice that you can’t tell which person contributed the data. That’s important for their privacy.B. Brookshire/SSP
Then I noted at what distance each person reported feeling two points instead of one on their fingertip, arm or back. I organized my data into three columns. At the bottom of each column, I calculated the mean — the average distance that people could distinguish two points instead of one — for each group.
When tested on their fingertips, my coworkers could tell that there were two points when the calipers were only about 4.5 mm (0.17 inch) apart. That’s pretty sensitive. But on their arms or backs, people only noticed that there were two points when the calipers were 20 to 21 millimeters (0.78 to 0.82 inch) apart. That’s still not very far. But it’s not nearly as sensitive as the fingertips.
Or is it? If you look at my data, you can see that my results varied wildly. Some people could tell there were two points on their arm when the calipers were only one millimeter (0.036 inch) apart. Others couldn’t tell at 50 millimeters (almost two inches).
To find out if my groups really were different, I had to run some statistics. These are tests to interpret the meaning of my results. I performed an analysis of variance, or an ANOVA. This test is used when someone wants to compare the means of three or more groups. There are free calculators for this online. I used the one at Good Calculators.
The test produces a p value, a measure of probability. It measures how likely it is that I would find a difference between these three groups as big or bigger than the one I found, if the difference itself was accidental. A p value of less than 0.05 (or five percent) is considered by many scientists to be statistically significant. In this case, my p value was so small it came out as a zero. This is a 0 percent chance that I would see a difference this large by accident.
So it looks like there could be a difference between the fingertip, arm and back. But where is that difference? To find out, I need to run a post-hoc test. I used a test called the Tukey’s range test. It individually compares all the means between the three groups. It compares the finger to the arm, and the finger to the back. It also compared the arm to the back. Again, you can find this test for free on the internet. I used the one on GraphPad.
That showed me that the fingertip was significantly different from the arm. It was also different from the back. But the arm and back were not different from each other.
I made two graphs to show off my results.
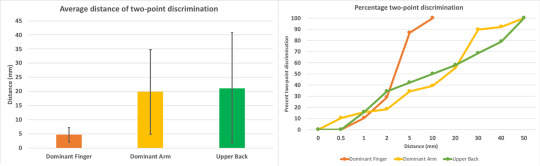
The simple bar graph (left) shows the means and how much the data deviated from the mean for each group. The line graph (right) shows what percent of people detected two points of contact at each caliper width. It helps depict how much the data varied. People felt the two different points very quickly on their finger tip. But the slope for arms and backs is more gradual. Some felt two points early, but some never felt them at all.B. Brookshire/SSP
My results are backed up with knowledge about how the body processes touch. When you are poked or prodded, molecules called receptors in the skin sense that touch. They send signals down nerve cells and to the brain, letting you know you’ve been poked and where.
The ability to feel two points touching your skin is an indicator of how many receptors for touch you have in that body part. Your fingertips have 100 times more receptors for touch than your back. There are also fewer receptors on your arm than your fingertip. So it makes sense that you would be able to discern two points at a closer distance on your hand than your back or arm.
Oh no, we’re not done
While my experiment supports my hypothesis, my data also varied a lot. Was there something that I could be missing?
For example, maybe my data varied because men were more, or less, sensitive to touch than women. So I graphed my data by gender. Only 10 men participated in my experiment, compared with 28 women. But my data was just as variable in both groups, and the groups were not different.
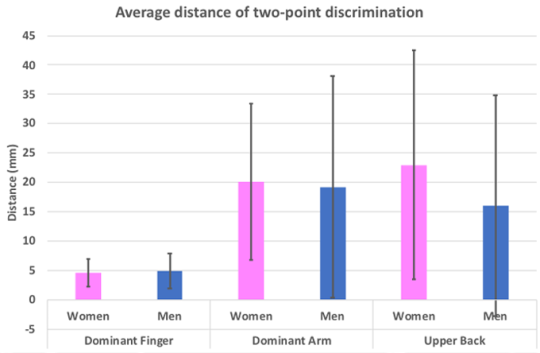
Here I graphed my data to see if there were any differences in two-point discrimination between men and women. There were not.B. Brookshire/SSP
What about handedness? Five of my participants were lefties. So I separated out the right- and left-handed people in my study. But lefties did not appear more variable in their responses than righties.
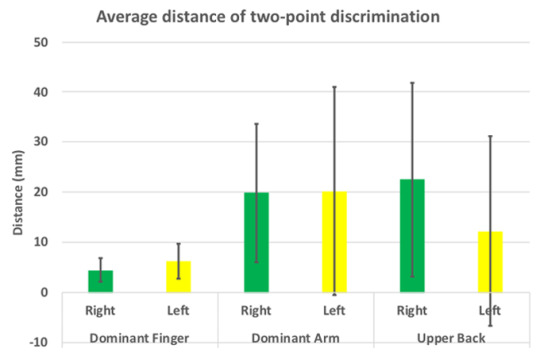
In this graph, I separated the right- and left-handed people in my sample. I didn’t see any differences in two-point discrimination.B. Brookshire/SSP
Finally, I separated my groups out by age. The youngest person in my experiment was 20 and the oldest was 66. Could age change how well people can feel two points instead of one? In my experiment, no. The average distance for two-point discrimination wasn’t different based on age.
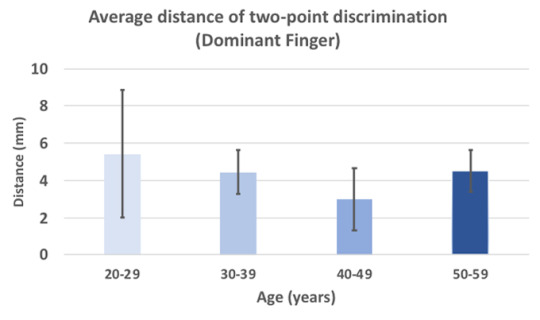
I separated my data by age group. Younger and older people were equally sensitive to two-point discrimination on their fingers. The arm and back data looked the same as well.B. Brookshire/SSP
There’s no such thing as a perfect experiment. And if I were to try this experiment again, there are many things I would do differently. I would try to get equal numbers of men and women, to start. I could try for equal numbers of right- and left-handed people. I could also try to make sure I studied only one age group, or that I studied all age groups equally.
But the next time you want to feel just how close together two points are, I’ll use my fingertips. Not my back. My experiment showed me that much.
Testing the power of touch published first on https://triviaqaweb.tumblr.com/
0 notes
Text
Frail Older Patients Struggle After Even Minor Operations
The patient, a man in his 70s, had abdominal pain serious enough to send him to a VA Pittsburgh Healthcare hospital. Doctors there found the culprit: a gallstone had inflamed his pancreas.Dr. Daniel Hall, a surgeon who met with the patient, explained that pancreatitis can be fairly mild, as in this case, or severe enough to cause death. Recovery usually requires five to seven days, some of them in a hospital, during which the stone passes or a doctor uses a flexible scope to remove the blockage.But “because it can be life-threatening, after patients recover, we usually take out the gall bladder to prevent its happening again,” Dr. Hall said.A cholecystectomy, as that operation is known, isn’t high-risk surgery. When done with a laparoscope to avoid large incisions, it’s usually an outpatient procedure.But Dr. Hall advocates screening all older patients for frailty, and this patient met the criteria. He had coronary artery disease and liver disease, had lost weight and took multiple medications.“He was sunken behind the eyes, skinny, unsteady on his feet,” Dr. Hall recalled.Dr. Hall’s research, recently published in JAMA Surgery, has found that frail, older adults are more likely than other patients to die after even supposedly minor procedures — and even when the surgery goes well, without complications.Frail, older patients frequently undergo such operations, which surgeons tend to see as routine, simple fixes — but may not be. “Our data indicate that there are no low-risk procedures among patients who are frail,” Dr. Hall and his co-authors concluded in their study.So he had a lot to talk over with this patient and his son, who joined the discussion by phone.What’s frailty? “It’s an accumulation of problems that leave the patient vulnerable to stressors,” said Dr. Ronnie Rosenthal, a surgeon at the Yale School of Medicine. “And surgery is a big stress.”Even in healthy patients, surgery “demands a lot of reserve from your body,” she added. But when they become frail, “people already use whatever reserve they have just to maintain their daily lives.”After operations, frail patients find it harder than others to regain strength and mobility, and to return to independent lives.Doctors and researchers assess frailty in a variety of ways. Geriatricians often measure things like gait and grip strength, and look for unintended weight loss and exhaustion.That face-to-face approach doesn’t work well for researchers examining large populations, so Dr. Hall and his colleagues developed a tool they called the risk analysis index. It allows them to calculate frailty based on illnesses, cognitive decline, ability to perform activities of daily living and other factors derived from medical records.They applied that index to about 433,000 patients (average age: 61) undergoing common surgeries — categorized as low-, moderate- or high-stress procedures — at VA hospitals from 2010 to 2014. Then the team looked at the patients’ subsequent mortality rates.In this mostly male sample, 8.5 percent of patients were deemed frail and another 2 percent very frail. (At older ages, the proportion would almost certainly be higher; a 2012 review found that depending on definitions, frailty affects 14 to 24 percent of the over-65 population.)Previous studies have shown that surgery poses higher risks for such patients, but “does frailty only matter for the big operations?” Dr. Hall wondered.Results from the new study, limited to non-cardiac procedures, appear to answer that question.Surgeons consider operations high-risk if their 30-day mortality rate exceeds 1 percent. But for frail patients, even the lowest-risk procedures — including removing a cyst from the hand or wrist, repairing a hernia or removing an appendix — had a 1.5 percent mortality rate within 30 days. For the very frail, the figure was more than 10 percent, Dr. Hall and his colleagues found.A moderate-risk procedure like gall bladder removal or joint replacement involved a risk of death that was higher than 5 percent within a month for frail patients, and a nearly 19-percent risk for the very frail.Those numbers rose over time. By 90 days, mortality after supposedly low-risk surgery climbed to 5 percent in the frail and about 23 percent in the very frail; for moderate-risk operations, the rates were about 11 percent and 34 percent, respectively.After six months, roughly 9 percent of frail patients who’d had the lowest-risk procedures and 16 percent of those undergoing moderate-risk surgeries had died. So had 35 to 43 percent of the very frail.It might not be the hernia repair or cyst removal, or complications thereof, that caused their deaths, of course. Those patients have shortened life expectancies, with or without surgery.“Frailty means you’ve probably entered the last season of your life,” said Dr. Hall (who is also an Episcopal priest).Moreover, living longer is not older people’s only concern, or even their primary one, Dr. Rosenthal pointed out. “We don’t ask patients often enough, ‘What’s important to you?’”A frail patient, she noted in an editorial published in JAMA Surgery, may opt for an operation that increases comfort or mobility, even if it also raises the odds of dying.Screening patients for frailty may allow those facing greater risk to begin several weeks of so-called pre-habilitation, to improve their nutrition and endurance.But frailty also brings greater urgency to the discussions surgeons have with patients and families, who need to understand not only surgical risks, but what their lives may be like after surgery.“It might not dominate the decision, but it could engender a few more questions,” Dr. Hall said.Unhappily, another recent study in JAMA Surgery shows how difficult it remains to pose these questions.Dr. Gretchen Schwarze, a vascular surgeon at the University of Wisconsin-Madison who studies doctor-patient communications, has too often heard patients say they had no choice but surgery, or were blindsided by how debilitated they felt afterward.So she and her colleagues recently developed an 11-question brochure for older adults considering major surgery. Working with surgeons at five hospitals, the team sent it to 223 patients before their consultations.Did those patients, who all had other serious illnesses, ask their surgeons more questions than a control group who didn’t receive the brochure? The team recorded everyone’s visits and learned that no, they didn’t. About half hadn’t even read the brochure.“If you want to change communications, you probably have to work on the surgeons” more than the patients, Dr. Schwarze concluded.But she noted that such questions will serve any older patient contemplating surgery, minor or major: What are my options? Will surgery make me feel better? Help me live longer? How much longer?What will daily life look like right after surgery, or three months or a year later? What serious complications might arise? What will those mean for me?When Dr. Hall discussed such matters with his frail patient, whose pancreatitis might never return, the man decided against gall bladder surgery. Time spent in the hospital, possibly in intensive care, and the potential need for recovery in a nursing home sounded unappealing.From the patient’s perspective, “the risks of doing the surgery were greater than the risk of recurring pancreatitis,” Dr. Hall said. “We chose not to do the operation.”
Read the full article
0 notes
Text
High Blood Pressure And Cholesterol In Young Adults Linked To Heart Disease In Later Life
"Doctors should prescribe statins to patients at a younger age to slash their odds of heart disease in later life, a study suggests," reports The Sun. Researchers in the US modelled the risk factors of 36,030 people who took part in 6 long-running studies. They estimated the effects of high cholesterol and high blood pressure in young adulthood (from the age of 18 to 39) on people`s risk of heart attack, stroke or heart failure in later adulthood. They found that both raised LDL "bad" cholesterol and raised blood pressure in young adulthood were linked to an increased risk of heart disease in later life.
The researchers say their study adds to evidence that raised blood pressure and cholesterol in early adulthood can be particularly harmful, and those new ways of tackling cardiovascular risk in early adulthood are needed. This does not mean that everyone necessarily needs to be attending health checks or needs to be on statins at a young age to reduce their cardiovascular risk. Routine measurements of blood pressure and cholesterol levels are not offered to people under the age of 40 on the NHS, but you can request tests from your GP if you are concerned.
Many pharmacies also provide blood pressure testing services. Regular exercise, a healthy balanced diet, not smoking and moderating alcohol can all help to keep your cholesterol and blood pressure at healthy levels. Read 10 tips on heart health.
Where did the story come from?
The researchers who carried out the study came from Columbia University, the University of California-San Francisco, Northwestern University, University of Miami, Emory University, University of Pittsburgh, Boston University School of Medicine, Boston Children’s Hospital and the health insurer Kaiser Permanente, all in the US.
The study was funded by the US National Institutes of Health. It was published in the peer-reviewed Journal of the American College of Cardiology on an open-access basis so it is free to read online.
The study was covered in The Sun and the Mail Online. The Sun relied heavily on quotes from the researchers, rather than on the statistical results of the study. The Sun`s headline suggesting that young people should take statins is not necessarily supported by the study findings. The Mail Online did a good job of explaining how the study was run.
What kind of research was this?
This was a statistical modelling study based on 6 cohort studies.
We already know that raised blood pressure and cholesterol contribute to cardiovascular disease risk. This study was trying to understand more about the relative contribution of these risk factors at different ages.
However, it`s still not easy to quantify for certain how much cardiovascular risk may come directly from each of these risk factors and how much from other health and lifestyle factors such as diet and exercise levels.
What did the research involve?
Researchers used information from 6 cohort studies in the US, which repeatedly recorded people`s blood pressure and cholesterol levels, then followed them up to check for heart attacks, heart failure or stroke. The average follow-up period was 17 years.
Some of the studies included information from the age 18, while others covered middle age or older age groups. The researchers used the data to construct models to estimate how people`s blood pressure and cholesterol levels might have changed over the years and to give an estimated trajectory of risk factors from age 18 upwards.
They then used this data to calculate the effects of different levels of blood pressure and cholesterol at ages 18 to 39 and at 40 plus. They looked at LDL (low-density lipoprotein, known as "bad" or harmful cholesterol), and systolic (upper figure) and diastolic (lower figure) blood pressure readings.
The researchers adjusted their figures to take account of the following risk factors:
ethnic background
sex
year of birth
body mass index (BMI)
smoking
diabetes
use of cholesterol-lowering and blood-pressure-lowering medicines
What were the basic results?
During the average 17 years of follow up, there were 4,570 cases of heart disease, 5,119 cases of heart failure and 2,862 cases of stroke among the 36,030 participants. The researchers found some links between higher levels of LDL cholesterol and blood pressure in early adulthood and risk of heart disease and heart failure.
Cholesterol
The researchers calculated that people aged 18 to 39 with raised LDL cholesterol (above 100mg/dl, or 25.86mmol/L) would have an increased risk of coronary heart disease.
Compared to people with LDL below 100mg/dL:
levels 100 to 129mg/dL were linked with a 62% increased risk of heart disease (odds ratio (OR) 1.62, 95% confidence interval (CI) 1.25 to 2.10)
levels 130 to 159mg/dl, 89% increased risk (OR 1.89, 95% CI 1.43 to 2.50)
levels 160mg/dl or above, a doubled risk (OR 2.03, 95% CI 1.47 to 2.82)
Blood pressure
The researchers calculated that people aged 18 to 39 with high systolic blood pressure (140mmHg or above) would have a 51% increased risk of heart failure (OR 1.51, 95% CI 1.08 to 2.11).
They also calculated that compared to young adults with diastolic blood pressure below 80mmHg, those with:
levels 80 to 89mmHG would have 25% increased risk of heart failure (OR 1.25, 95% CI 1.04 to 1.50) and 21% increased risk of coronary heart disease (OR 1.21, 95% CI 1.02 to 1.43)
levels 90mmHg and above would have 84% increased risk of heart failure (OR 1.84, 95% CI 1.02 to 3.32)
None of the measures for young adults was linked to risk of stroke.
How did the researchers interpret the results?
The researchers said: "Our results add to accumulating evidence that young adulthood is a critical period when exposure to suboptimal BP [blood pressure] or cholesterol is particularly harmful." They said that keeping cholesterol and blood pressure under control in early adulthood "could yield substantial benefits".
However, they warn that young adults are hard to reach for healthcare programmes and "implementing preventive programs targeting individual young adults will require novel prevention program models" that take account of people`s tendencies not to think about risks that might happen in the future.
Conclusion
The figures from the study are interesting, as they demonstrate the importance of having healthy cholesterol and blood pressure levels throughout life to help protect against risk of developing cardiovascular disease.
The study essentially supports the current understanding of cardiovascular risk. However, there are limitations to be aware of.
The study did not show definite links between high levels of cholesterol and blood pressure and all cardiovascular outcomes assessed. While generally following the same trends, it showed fairly mixed results. For example, raised cholesterol was linked with heart disease but not heart failure, while the opposite was seen with systolic blood pressure.
We do not have details from this study about how these cardiovascular outcomes were assessed, and they are also quite broad terms. For example, the term "coronary heart disease" covers a range of conditions, ranging from angina (serious but not life-threatening) to an actual heart attack. So we cannot be sure of the definite links with each risk factor.
There are many hereditary, health and lifestyle factors that may influence cardiovascular risk. While the study has tried to account for some of the main ones, like diabetes and smoking, we still cannot say for certain that the estimated blood pressure and cholesterol levels at certain ages would directly increase risk of heart disease to that specific extent.
It is also important to realise that the figures are based on mathematical modelling, rather than on the actual results from young people aged 18 to 39. Only 2 of the 6 studies had actually measured risk factors in people under 45. Most of the figures are based on extrapolations of data to other cohorts that included older people. If the mathematical model was inaccurate, that would affect all the results.
It should not be a surprise to learn that raised blood pressure and LDL cholesterol are linked to cardiovascular health. We`ve known that for some time. This study highlights the importance of having healthy levels throughout life. However, it does not necessarily mean that all young people need to be attending health checks or need to be on statins.
Find out more about ways to keep your heart healthy.
0 notes
Text
A Guide to Genetic-Testing Kits
Speculative but Promising
Toggle description
There’s momentum behind this concept, though it needs more research to elucidate exactly what’s at work.
Curious about genetic testing, we explored the options: kits that could reveal something about the health of your microbiome, which foods you’re sensitive to, how your body metabolizes certain nutrients. Tests that recommend certain strains of cannabis and beauty routines based on your DNA. And even a test that identifies dogs by their shit. But first, a little bit of background on genetic testing; if you already know this world well, you can skip down for our highlights.
It started in 2000 with a novel way to learn about your ancestry. A simple blood test allowed companies like Family Tree to send DNA data directly to consumers, tracing their lineage back to great-great-grandparents. In 2007, 23andMe revolutionized direct-to-consumer testing with the saliva test, which made it simpler (you spit and send in your sample). And 23andMe created autosomal testing that could be used by both men and women to determine their ancestral lines up to five generations back and break down their ethnic makeup by percentage points. This opened the door for the technology most DNA-testing companies use today.
Soon, a lot of genetic-testing websites cropped up with their own spin on your DNA’s story. It’s estimated that genealogical-testing companies have around 26 million DNA profiles. And because of companies like GEDmatch, which have aggregated test results from multiple websites, it’s possible that most people’s DNA can be identified—even if they’ve never done one of these tests themselves or uploaded their own DNA. Forensic scientists have partnered with some of these sites to solve crimes (the Golden State Killer was identified from his distant relatives’ DNA).
Genetic testing and these companies raise serious ethical and privacy concerns. Given this, why might a person choose to submit their DNA? Besides learning you’re not as Irish as you thought, is there a reason for the average individual to be interested in personalized genetic testing?
New research has focused on single nucleotide polymorphisms (SNPs) and what they can tell us about our health. SNPs are the most common type of genetic variation among humans and occur normally throughout our DNA. Each person has between 4 and 5 million unique SNPs in their genome. These SNPs act as biological markers and determine various aspects of our health.
In the 1990s, an SNP that prevents normal blood clotting was identified in the gene called Factor V. Scientists found that patients with deep vein thrombosis often had this particular SNP. Since this breakthrough, the medical community has been able to use genetic testing to identify risk for over 2,000 diseases by determining whether people are carriers of certain genes. Newborns are screened to help with early diagnosis. And we’ve learned more about how drugs are processed based on a person’s genome through pharmacogenetic testing.
Because genetic tests can outline your SNPs, the real promise of the test results is that they could empower people to optimize their lifestyle based on their individual genome. This is the field of nutrigenomics: It tries to tell you how your genome interacts with nutrients on a molecular level—and how different foods will affect you.
For example, if you have a certain SNP, you may be someone who can’t convert beta-carotene into vitamin A efficiently. So a nutrition-testing kit might suggest that you supplement or eat more vitamin-A-rich foods, like sweet potatoes. And a recent systematic review found that genetic-testing kits that provided lifestyle recommendations led to positive lifestyle changes, especially related to nutrition.
Do these kits tell you the whole story of your health? Well…they can give you insight into how certain genes are related to nutritional outcomes (like how well your body converts an antioxidant you eat into a vitamin you need). But only blood work can detect whether you’re deficient in a nutrient. And the story of one SNP is not the story of how your entire genome interacts with nutrients. When it comes to determining which diet is best for you, genetic tests aren’t totally there yet. But what they can do is help create and reinforce healthy lifestyle choices.
And in the future, maybe they’ll help with much more. Nutrigenomics established itself as a field in the past decade, and other industries, like cannabis and beauty, are following it into the DNA-testing space. Which means we could see some really interesting research in the next five, ten, twenty years.
But back to right now. If you’re ready for testing: See our guide below to get a sense of what’s out there. When selecting a kit, you want to thoroughly vet the company for its scientific accuracy and how it will use your data, to be sure that you’re cool with it on both counts. The most rigorously researched companies will provide the actual studies to back up the recommendations they give you. Be aware that the information a company retrieves based on your DNA may not belong to you and may be sold to other companies; read through the privacy policy to make sure your information is safe to your satisfaction. Also, note that not all of these tests are covered by insurance yet. Many are likely to be covered down the road as the cost of testing begins to decrease and personalized direct-to-consumer medicine becomes more mainstream.
Medical-Testing Kits
23andMe
The OG genealogy company that paved the way for today’s autosomal testing and saliva swabs is also the only ancestry company that offers health data; the FDA just cleared 23andMe to test for two breast cancer genes and give information on prostate cancer risk.
EverlyWell
With the Food Sensitivity test kit from EverlyWell, you can screen your body’s reactivity to ninety-six common foods with a simple finger prick. This can help you identify the foods your body has an elevated immune response to. And if you believe you have food-related symptoms (gastrointestinal pain, headaches, fatigue), you can use this information to start eliminating potential offenders from your diet. Keep in mind, this kit does not test for food allergies and can’t help diagnose celiac disease.

Pathway Genomics
To reduce the trial and error that can often come with prescription medications, Pathway Genomics has developed two testing kits to analyze genetic variants that affect the way you metabolize drugs, which impacts their efficacy and potential side effects. The Mental Health DNA Insight kit analyzes your body’s response to fifty common psychiatric medications, and the Pain Medication DNA Insight kit tests your response to thirteen pain medications.
Microbiome-Testing Kits

BIOHM
If you’re looking for a straightforward report card on your gut, it’s BIOHM’s Gut Test. Based on years of research by microbiome expert Mahmoud Ghannoum, PhD, BIOHM scores the diversity of your microbiome on a scale of one to ten. And then it compares your bacteria and fungi—which are commonly overlooked—to estimated healthy levels. It gives an analysis of each strain of bacteria and fungi and provides nutritional recommendations to help optimize your gut. And it also sells a collection of well-researched prebiotic and probiotic formulas.

DayTwo
By combining clinical parameters with microbiome data, DayTwo uses an analytical model to predict the glycemic response to various foods for people with diabetes. This is based on how the foods are digested and absorbed. The results help people create a personalized meal plan to keep glucose levels in check. And through its mobile app, DayTwo recommends meals and snacks, gives nutritional information, and calculates a health score for each meal the user logs.
Thryve
If you’ve tipped over from gut-curious to gut aficionado: Thryve’s Gut Health kit gives you a panel of your microbiome and sends you back a rating of your overall gut health with a detailed report on each microbe it has detected. It recommends foods for you based on your dominant bacteria and tells you how your microbiome relates to your health in terms of mood, digestion, skin, energy levels, and so on.
Nutrition-Testing Kits

Nutrigenomix
Aptly named after the field of nutrigenomics, Nutrigenomix applied cutting-edge research on various SNPs related to nutrition and exercise to lay the groundwork for most companies in the space today. You won’t find an integrative app or a cute map of your recommended foods here. Instead, Nutrigenomix’s science-forward Nutrition and Fitness Test gives you a wide array of information related to forty-five genetic markers that affect your nutrient metabolism, cardiometabolic health, weight, lactose and gluten tolerance, eating habits, and fitness (e.g., motivation to exercise or injury vulnerability). It provides tailored recommendations with the research to back them up, whether that’s suggesting you eat more citrus fruits or suggesting you limit your iron intake to reduce your risk of liver disease, arthritis, or heart conditions.
Habit
It’s the love child of genetic testing and meal-delivery services: Habit uses blood and saliva samples to determine your response to different foods, then compiles your optimal nutrient intake and recommended foods. You also get a thirty-minute session with a nutritionist through the app, followed by an option to get tailored meal plans (for an additional cost).

GenoPalate
Using data from seventy-five different SNPs, GenoPalate creates a profile of how your body metabolizes different nutrients and offers suggestions to optimize your intake of carbs, protein, fat, vitamins, and minerals. It then recommends the top fruits, vegetables, herbs, meats, proteins, grains, dairy products, nuts, and oils for you. Bonus: It can run analyses on existing data that you’ve sent to 23andMe or AncestryDNA.
Niche Testing Kits

CannabisDNA
Anxiety from one puff too many is a learning curve most of us could do without. By analyzing seventy of your genetic markers, CannabisDNA recommends the THC:CBD ratio and strains it thinks are right for you based on cannabinoid metabolism. It also makes suggestions for strains based on what behaviors you’re trying to avoid or attain—like if you want some extra help falling asleep or if your munchies are out of control.

Orig3n
Could your genome help you hack your beauty routine? The Beauty DNA Test from Orig3n tests for parameters related to your skin’s appearance and health, signs of aging, skin elasticity, and response to sunlight to give you an actionable beauty report. For example, you might want to start taking that collagen supplement earlier than you thought.

PooPrints
If you’re the leave-it-and-run type of dog owner, you might want to reconsider. For apartment buildings that use PooPrints, during an initial “doggy day,” DNA samples are collected from each dog in the complex. Then, when the building finds any rogue droppings on the property, they’ll send it off to PooPrints to determine whose pup it belongs to. And a (large) fine can follow. While this might not be a genetic test to improve your well-being, some may consider it a form of self-improvement (and here’s to a future where you can find out who took a bite out of your sandwich in the work fridge).
This article is for informational purposes only, even if and regardless of whether it features the advice of physicians and medical practitioners. This article is not, nor is it intended to be, a substitute for professional medical advice, diagnosis, or treatment and should never be relied upon for specific medical advice. The views expressed in this article are the views of the expert and do not necessarily represent the views of goop.
Source: https://goop.com/wellness/health/genetic-testing-kits-guide/
0 notes
Photo

New Post has been published on https://fitnesshealthyoga.com/eating-high-amounts-of-ultraprocessed-foods-linked-to-small-increased-risk-of-early-death/
Eating high amounts of ‘ultraprocessed’ foods linked to small increased risk of early death

Eating high amounts of “ultraprocessed” foods is associated with a greater risk of early death, according to a French study published this week in JAMA Internal Medicine.
But there’s no need to rush to your kitchen to toss out all your processed foods. The increased risk was modest. Furthermore, the study found only a correlation, not a cause-and-effect relationship, between heavily processed foods and early death.
As Mathilde Tourvier, one of the study’s authors and an epidemiologist at the University of Paris 13, told a reporter for Agence France-Presse (AFP), “We shouldn’t be alarmist.”
The study’s findings, she added, are just a “step in our understanding of the link between ultra-processed food and health.”
Still, we need to be paying attention to this kind of research. For, as Tourvier and her co-authors point out in their paper, a growing number of studies are reporting links between the consumption of heavily processed foods and a higher risk of chronic disease, including type 2 diabetes, high blood pressure and cancer.
Those findings are particularly concerning here in the United States, where an estimated 60 percent of the calories we consume come from ultraprocessed foods.
How the study was done
For the current study, Tourvier and her colleagues used data collected from more than 44,000 French adults (aged 45 and older), who were participating in a larger, ongoing health study in France. The participants were followed for an average of seven years, and during that time each filled out detailed 24-hour food diaries at six-month intervals.
From that data, the researchers calculated the proportion of each participant’s diet that contained ultraprocessed foods. They define those foods as “products that contain multiple ingredients and are manufactured through multitude of industrial processes.”
“These foods products are usually ready to heat and eat, affordable, and hyperpalatable,” the researchers explain. “Examples include mass-produced and packaged snacks, sugary drinks, breads, confectioneries, ready-made meals, and processed meats.”
Among the study’s participants, ultraprocessed foods made up 14 percent of the weight of the total food consumed and about 29 percent of total calories. (That’s about half of the calories consumed from ultraprocessed foods by the average American.)
The people in the study who consumed the greatest amount of ultraprocessed foods tended to be younger (45 to 64 years old), more sedentary and more likely to be living alone. They were also more likely to have a lower income, a lower education level and a higher body mass index (BMI).
The link with early death
During the study’s seven-year follow-up, 602 (1.4 percent) of the participants died. Thirty-four of those deaths were caused by cardiovascular disease, and 219 were caused by cancer — two types of illnesses that can be diet-related. (The causes of the other deaths are not identified in the study.)

The researchers then looked for associations between the amount of ultra-processed foods in the participants’ diet and their risk of early death. They found that for each additional 10 percent increase in the proportion of ultraprocessed food the participants ate, the risk of death increased by 14 percent.
The researchers came by those results after first adjusting the data for a long list of non-diet-related factors that can contribute to early death, including smoking, alcohol use, physical activity levels and family history of cancer or cardiovascular disease.
Possible explanations
The study’s results suggest “a positive association between increased ultraprocessed foods consumption and all-cause mortality risk,” the researchers conclude.
They offer several possible explanations for that association. Ultraprocessed foods, they point out, tend to contain high amounts of sodium (salt) and sugar, and consuming both those ingredients in high quantities has been linked to an increased risk of death from cardiovascular disease.
The researchers also point to the substances that are added to ultraprocessed foods during processing or that leach into the food from its packaging while it’s being stored. Some of those substances are suspected of having disease-causing properties.
Limitations and implications
Now for the caveats. The study’s biggest limitation is, of course, that this is an observational study, which means it can’t prove that eating high amounts of ultraprocessed foods increases the risk of early death. Furthermore, the participants self-reported what they ate, and such reports can be biased.

In addition, the researchers’ definition of ultraprocessed is based on how the foods were made rather than on their content, so even if the foods did contribute to the small increase in deaths observed in this study, it’s impossible to know which foods were involved.
So, what’s the take-home message from the study?
The anonymous expert who reviewed the study for “Behind the Headlines,” a consumer information site hosted by Great Britain’s National Health Service, may have put it best. “We certainly cannot conclude that all processed food is bad, or that eating processed food is killing us,” that expert writes.“But the study is a reminder that relying on pre-prepared food or eating too many snacks, sweets and ready-meals can make it easy to consume too much salt, sugar and saturated fat, and not enough fibre, green vegetables and fruit.”
FMI: You’ll find an abstract of the study on the JAMA Internal Medicine website, but the full study is behind a paywall.
Source link
0 notes
Text
Best tips to control high cholesterol

Cholesterol is the ultimate double agent. On the one hand, this waxy, fat-like substance – which is found in every cell of your body – is a black-hatted villain that increases your risk for heart disease and stroke.
However, in another guise, cholesterol can be a hero, helping your body fight off these very same illnesses.
Why you need cholesterol?
Cholesterol plays a vital role by helping your body make:
§ Hormones
§ Vitamin D
§ Substances that aid food digestion
The body produces cholesterol naturally, buy Ayurvedic medicine for high cholesterol but it also is found in some foods that you eat. These are all animal-based, and include:
§ Egg yolk
§ Dairy products
§ Shellfish
§ Meats
§ Poultry
At some point, the amount of cholesterol in your body reaches a tipping point and becomes dangerous. Because high cholesterol typically produces no symptoms, it’s important to visit a doctor who can take a blood sample to check your levels.
Cholesterol levels typically are given as “total cholesterol” numbers that combine your HDL, LDL and very-low-density lipoprotein (VLDL) readings. They are calculated in milligrams per deciliter and are as follows:
§ High: 240 mg/dl and above
§ Borderline: 200-239 mg/dl
§ Desirable: Less than 200 mg/dl
Types of Cholesterol
There are actually four different types of cholesterol: high-density lipoprotein (HDL), low-density lipoprotein (LDL), very low-density lipoprotein (VLDL) and intermediate low-density lipoprotein (ILDL).
HDL and LDL are the two most common types of cholesterol. HDL cholesterol is considered the “good” kind of cholesterol, while LDL cholesterol is considered the “bad” type of cholesterol.
In order to successfully manage your health, buy Ayurvedic medicine for high cholesterol there are important differences you need to know about the “good” and the “bad” types of cholesterol.
· Low-density lipoprotein (LDL): This form of cholesterol is the troublemaker. Often characterized as the “bad” form of cholesterol, LDL cholesterol contributes to the formation of plaque in your arteries that can lead to heart disease and stroke.
· High-density lipoprotein (HDL): In contrast, HDL actually absorbs cholesterol and sends it to the liver, where it is removed from the body. For this reason, it is often dubbed the “good” cholesterol. So Buy Ayurvedic medicine for high cholesterol
So: Tips to Lower Your Cholesterol Naturally are as follows:-
The first step is to know your cholesterol levels. This becomes mandatory if you are overweight, sweat a lot or/and pant after walking for 500 meters. A cholesterol test will measure all the fats in your blood. The lipid profile test would show you the levels of HDL or good cholesterols and LDL or bad cholesterols. The effect of abnormal cholesterol ranges shall show up and you will need to reduce the LDL and increase the HDL. Buy Ayurvedic medicine for high cholesterol
You can improve cholesterol with medicines, but why not do it naturally. Few simple and healthy changes can get you the desired effect. And if you have started your medicines by now, these changes will enhance their cholesterol-lowering effect.
Here we are giving you a cumulative list of 5 tried and tested techniques which shall not only reduce your cholesterol but will lead you to a healthy lifestyle.
· Aim At a Healthy Menu
There are foods which pep up your mood, but make your body sad by affecting your heart and your waistlines. Hyper-processed foods like potato chips and french fries, sugar-saturated drinks and fatty, artery-clogging meats and full-fat dairy foods like cheese damage the arteries and can lead to atherosclerosis. Include foods like oats for a healthy beginning with some nuts like walnuts. Almonds and cashews are other good options. However, while nuts are heart healthy, they are also high in calories, so practice portion control. Black tea is known to reduce blood lipids. Try to include at least one pulse (beans, peas, lentils) every day. Buy Ayurvedic medicine for high cholesterol
· Get On Your Toes
Exercise has proven to lower your total and LDL cholesterol levels and at the same time sheds off the excess weight your body carries. Overweight increases the amount of low-density lipoprotein (LDL) in the blood, a lipoprotein that is linked to heart disease. Exercise stimulates enzymes that help move LDL from the blood (and blood-vessel walls) to the liver.
To start with, you can plan an average of 40 minutes of moderate- to vigorous-intensity aerobic activity three or four times a week. This can include
1. Walking briskly (approx. 5 km per hour or faster)
2. Bicycling (16 km per hour or slower)
3. Playing tennis (doubles)
Always keep in mind to not to start with a strenuous exercise pattern suddenly. Give your body time and resistance to increase the intensity of exercise. To stay motivated, find an exercise buddy or join an exercise group.
· Yoga And Cholesterol
Yoga has proven to reduce cholesterol if practiced on a regular basis. There are many different techniques and postures that will stretch and massage the abdominal muscles and organs. This helps stimulate and improve the functioning of these organs, and hereby works to reduce your overall cholesterol levels. Buy Ayurvedic medicine for high cholesterol Some asanas which can and should be practiced are:
1. Kapal Bhati Pranayama
2. Shalabhasana
3. Sarvangasana Pose
4. Ardha Matsyendrasana
· Quit smoking
Smoking is the single most reason for many health issues. It weakens the individual both physically and psychologically. The person who smokes tends to smoke more in public places due to the fear of losing one’s identity. To stop smoking is the single best thing you can do to improve your heart health. Though quitting is definitely not easy, but with the support of family and peers one can definitely quit. Quitting smoking will improve your HDL cholesterol level.
And most important - Foods that will cut your Cholesterol:-
1. Olive Oil
Much like cholesterol, fat can be divided into ‘good’ and ‘bad’. Without getting too technical, ‘bad’ saturated fat increases your cholesterol, while ‘good’ unsaturated fat doesn’t. Of these, monounsaturated fat is considered the healthiest. Out of all the cooking oils you can choose from at the supermarket, olive oil has the highest level of monounsaturated fat. You can use olive oil for sauteing, Buy Ayurvedic medicine for high cholesterol grilling and baking, or as a salad dressing. Don’t go crazy though, as despite its heart health advantages, it’s still high in calories.
2. Whole Grains
Whole grains, such as brown rice, brown bread and cereals, are very high in fibre. Fibre increases your body’s levels of good cholesterol by reducing the amount of bile absorbed into the intestines. When this happens, bile has no reason to stick around, so it leaves your body along with all your food waste.
That’s all very nice, but how does it affect cholesterol?
Well, your body needs bile to digest the fat in your diet, so your liver gets to work making more. What does it need to do this? If you guessed LDL cholesterol, have ten points! Taking it out of your bloodstream means it’s not going to hang around in your arteries.
3. Oily Fish
Ah, oily fish. You’ll find it on most lists of foods that are good for you and this is no exception. It contains omega-3, which has two key benefits. The first is it improves brain function. The second is it’s superb for heart health. Studies have shown omega-3 can keep blood pressure and heart rate in check, reduce your risk of heart attacks, lower LDL cholesterol and increase HDL cholesterol. Our bodies can’t make omega-3 either, so we need to get it from our diet.
4. Nuts
Nuts are high in unsaturated fat and fibre, which we’ve already established are great for bringing your cholesterol down. Walnuts, almonds and pistachios are regarded as the best options. Walnuts even contain omega-3 too, so they’re doubly good at lowering cholesterol. Plain varieties are, of course, the best. We shouldn’t really have to say this, but anything salted, candied or covered in artificial flavouring will spoil any health benefits.
5. Beans and Pulses
A 2016 Canadian study found that a daily serving of pulses can cut LDL cholesterol by 5%. They also keep you fuller for longer, so you’re less likely to reach for any unhealthy, fatty snacks that will send your cholesterol soaring again. Unfortunately, the research also claimed that only 13% of the population was hitting this daily requirement. Buy Ayurvedic medicine for high cholesterol
6. Avocado
Whether you like yours smashed on toast or turned into guacamole, avocados are one of the best ways to manage your cholesterol balance. They’re high in monounsaturated fats, so they’ll bring your LDL cholesterol down and boost your HDL cholesterol at the same time.
7. Fruit and Vegetables
We’re sure you’re getting your five-a-day already, so you should already be feeling the heart healthy benefits of fruit and veg. Just in case, here’s what they’re doing for your cholesterol levels. Many fruits and vegetables, such as berries, apples and Brussel sprouts, are high in fibre. We already know this is good for your cholesterol levels. They also contain plant sterols, which stop the body from absorbing cholesterol. If it can’t be absorbed, it simply leaves the body. Problem solved!
8. Apple Cider Vinegar
It’s not something you’d necessarily find in your kitchen cupboards, but apple cider vinegar could be the cholesterol-busting condiment you’ve been waiting for. For many years, it was seen as a ‘traditional’ remedy for a variety of health problems, but there was little medical data to back this up. While most of the claims about apple cider vinegar (such as the idea it could promote weight loss) were found to be false, one of them turned out to be true. The study found that drinking two tablespoons of diluted apple cider vinegar twice a day reduced overall cholesterol levels by 13%.
9. Cheese
Wait, what?
Cheese? The famously high-fat dairy product? Lowering cholesterol?
It sounds hard to believe, but in 2016, researchers at the University of Copenhagen found something pretty surprising. They gave one group of people 80g of regular cheese and another 80g of a low-fat equivalent. A third group ate no cheese at all. You’d expect a food that’s high in saturated fat to raise cholesterol. It did, but not in the way you might expect. None of the three groups saw an increase in LDL, but the people who ate the high-fat cheese had higher levels of HDL.
In practice, this means their body was better prepared to get rid of ‘bad’ cholesterol. While cheese doesn’t lower cholesterol in the way other foods on this list do, it may have the power to improve the ratio of HDL to LDL.
#ayurvedic medicine for kidney stone#ayurvedic medicine for kidney failure#ayurvedic medicine for heart#ayurvedic medicine for high cholesterol#ayurvedic medicine for gas and acidity
0 notes
Photo

Owning a Pet Can Save You Money on Health Care. By Dr. Becker Together, U.S. pet owners spend more than $60 billion on their pets each year,1 but this may be peanuts compared to what they give back to you. There's no price that can be put on a pet's love and companionship, of course, but there are more concrete benefits that canbe monetarily measured. Take, for instance, the health benefits you stand to gain from pet ownership. Researchers from George Mason University (GMU) conducted a study for The Human Animal Bond Research Initiative (HABRI) Foundation, which found Americans save $11.7 billion annually in health care costs due to pet ownership.2 HABRI Executive Director, Steven Feldman, even said, "Thinking about things that people should do to maintain their health, 'get a pet' belongs on that list." How Does Owning a Pet Save You Money on Health Care? The decision to add a pet to your family isn't one to take lightly — or make solely based on potential health benefits. That being said, if you have the time, resources and desire for a new lifelong friend, the health gains represent the icing on the cake. So how did the study arrive at $11.7 billion in savings attributed to pet ownership? It was primarily due to a lower incidence of doctor visits. Pet owners — 132.8 million in all — visited a doctor 0.6 times less than non-pet owners. The study found the average cost of a doctor visit is $139, which led to savings of $11.37 billion annually in health care costs. About 20 million dog owners also walked their pet five or more times a week, which led to even greater benefits. The extra pet-related activity lowered the incidence of obesity in this group, leading to another $419 million in health care savings. "The health care cost savings associated with pet ownership is likely to be even greater" than the report detailed, the researchers suggested, because it was limited in its scope. Pet ownership is also known to positively influence the following health conditions, but more economic data was necessary before the related savings could be calculated: ✓ Infection control ✓ Cardiovascular disease ✓ Hypertension ✓ Cholesterol ✓ Allergies ✓ Stress ✓ Blood pressure ✓ Psychological issues And, as mentioned, the study doesn't take into account the value of your pet's loyalty and companionship — benefits that are priceless. Study co-author Terry Clower, director of GMU's Center on Regional Analysis, told the Washington Business Journal:3 "What we didn't calculate is how much better you feel, [when] you come home after a tough day at the office and your pet is waiting for you. But there's value to that." It should be noted that the HABRI Foundation, which has funded more than half a million dollars in research related to the health benefits of companion animals, was founded by Petco, Zoetis (a maker of animal medications) and the American Pet Products Association, all of which have a significant stake in pet ownership rates in the U.S. That being said, though the potential for conflict of interest exists, their findings are in line with many other past studies that have also highlighted the significant health benefits of owning a pet. Pets Offer Health Benefits to All Ages Owning a pet offers unique benefits to people at different life stages. Exposure to pets in early childhood appears to be protectiveagainst the development of allergies, even in children at increased risk. One study, published in the Journal of Allergy and Clinical Immunology, revealed exposure to animal-specific microbes has beneficial effects, including potentially strengthening the infants' immune systems.4 Among children, meanwhile, dog ownership reduces the risk of anxiety. Specifically, one study found only 12 percent of children with dogs suffered from probable anxiety compared to 21 percent of those without.5 Dogs are very responsive to human communicative cues, making them uniquely suited to bolster a child's emerging self-esteem and confidence. In addition, children with type 1 diabetes who actively cared for a family pet were 2.5 times more likely to have control over their glycemic levels than children who did not. Caring for a pet may encourage self-regulatory behavior that's important for children with type 1 diabetes or other chronic diseases to manage their condition. In adulthood and into retirement, pets provide companionship, help you overcome loneliness and encourage you to stay active. One of the greatest benefits is often overlooked and that is keeping you focused on the present moment. Pets provide a focal point for your attention and demand a certain structure to your day, something that many miss following retirement. They also give you a sense of purpose, add humor to your life and act as social facilitators, giving you something to talk about with others. Physically speaking, research shows pets can even help lower your blood pressure and triglyceride levels, which may creep up as you age.6 Now You Can Give Pet Ownership a Trial Run Adding a pet to your family is "forever" commitment, and choosing the right pet to fit in with your personality and lifestyle is important in forming a happy, healthy and loving relationship. If you're wary of taking the leap and simply hoping for the best, you may be interested in relatively new programs that allow potential adopters to take home a dog for a "trial run" of sorts. Some animal shelters allow you to keep a dog overnight or longer to see how she fits in with your family. You'll be able to see her real personality come out once she's out of the stressful situation of being in a shelter and determine how she gets along with your other family members (human and non-human). If it doesn't work out, you can bring the animal back to the shelter where hopefully, another family will find her. But, chances are, once you spend time with a pet in your home, you'll feel all those physical and emotional benefits that research continues to confirm — and you won't want to let her out of your sight.
1 note
·
View note
Last Seen Blogs

seramournn
VERSAILLES.

furienna
Untitled

lisha-chen
LISHA

tuttuts-blog
just everything and anything I want

neckmouse3
On The Internet One To One Mentoring