#how to filter excel with slicers
Text
How To Use Slicer In Excel Sheet For Data Filtering
Unlocking the Power of Excel Slicers: An Interactive Guide
Hello there, Excel warriors! Are you ready to take your Excel skills to the next level? Today, we’ll explore the power of Excel Slicers and walk you through how to insert slicers in Excel, use PivotTable slicers, and more.
How to use Excel Slicer
1. Excel Slicers – An Overview
An Excel slicer is a tool that provides a simple, intuitive…
View On WordPress
#advanced excel#excel#excel 2016#excel 2019#excel slicer#excel slicer dashboard#excel slicer tricks#excel slicers#excel tips#excel tips and tricks#excel tutorial#how to filter excel with slicers#how to use excel slicers#how to use slicer in excel#learn excel#microsoft excel#ms excel#slicer#slicer excel#slicer in excel#slicer in excel 2007#slicer in excel 2013#slicers#slicers in excel#use of slicer in excel#using slicers in excel
1 note
·
View note
Text
Unleashing Excel's Power: Navigating Complex Calculations and Data Processing

Excel, the venerable spreadsheet tool, is often underestimated in its capabilities for handling complex calculations and data processing. Beyond the standard formulas, conditional formatting, and basic data functions, Excel boasts a treasure trove of features designed to empower users with the ability to handle intricate data challenges. In this blog, we will explore the capabilities of Excel for complex calculations and data processing, providing actionable takeaways to enhance your proficiency.
Mastering Advanced Formulas
1. Embrace Array Formulas:
Takeaway: Array formulas allow simultaneous calculation of multiple values, significantly boosting efficiency. Understand how to use them for tasks like conditional aggregations and dynamic data manipulations.
2. Utilize Goal Seek and Solver:
Goal Seek helps you find the input needed to achieve a desired outcome, while Solver takes it a step further, allowing you to optimize variables based on defined constraints.
Takeaway: Apply Goal Seek for quick what-if analysis and Solver for solving complex optimization problems within Excel.
PivotTables for Dynamic Data Summarization
3. Dynamic PivotTable Slicers:
Takeaway: Implement dynamic slicers to filter and visualize PivotTable data dynamically. This feature enhances user interactivity and simplifies complex data analysis.
4. Calculated Fields and Items:
Master calculated fields and items within PivotTables to create custom calculations on the fly without altering the source data.
Takeaway: Leverage calculated fields and items for enhanced data summarization within PivotTables.
Leveraging Power Query for Data Transformation
5. Import Data from Multiple Sources:
Power Query enables seamless data import from various sources. Understand how to connect, transform, and load data from databases, CSV files, and more.
Takeaway: Integrate Power Query into your workflow for streamlined data preparation from diverse sources.
6. Data Cleansing with Power Query:
Use Power Query for data cleansing tasks, such as removing duplicates, handling errors, and transforming data formats.
Takeaway: Employ Power Query to ensure data integrity and consistency before analysis.
Advanced Charting and Visualization
7. Combination Charts:
Combine different chart types in a single chart to effectively display multiple data series with distinct characteristics.
Takeaway: Master the art of combination charts to convey nuanced information in a visually compelling manner.
8. Dynamic Charting with Data Validation:
Link data validation to charts for dynamic visualizations. Users can interactively choose which data to display in real-time.
Takeaway: Enhance user interactivity and engagement by incorporating dynamic charts into your Excel dashboards.
Macros and Automation
9. Recording and Running Macros:
Record repetitive tasks as macros and run them with a click, automating processes that would otherwise be time-consuming.
Takeaway: Identify repetitive tasks in your workflow and automate them using Excel macros to save time and minimize errors.
10. VBA (Visual Basic for Applications):
Dive into VBA to write custom scripts and automate complex calculations or data manipulations beyond the capabilities of standard Excel functions.
Takeaway: Learn VBA for unparalleled control over Excel and to create tailor-made solutions for your specific needs.
Power BI Integration for Advanced Data Analysis
11. Connect Excel to Power BI:
Takeaway: Integrate Excel with Power BI to harness advanced data visualization and analytics capabilities, extending your reach into more complex data scenarios.
12. Dynamic DAX Measures:
Power BI's Data Analysis Expressions (DAX) language allows the creation of dynamic measures. These measures adapt based on user interactions, providing a more personalized data analysis experience.
Takeaway: Understand and implement DAX measures for more granular control over your data analyses.
In conclusion, Excel's capabilities for complex calculations and data processing are vast and often untapped. By incorporating these actionable takeaways into your Excel repertoire, you can navigate intricate datasets, automate tedious tasks, and visualize data in ways that unveil new insights. Elevate your Excel proficiency, and witness the transformative power it can bring to your data-driven endeavors.
#chatgpt#infographic#microsoft excel#ai#powerpoint#exceltraining#promptsharing#chatgpttips#exceltips#microsoftexcel
0 notes
Text
The Top 5 Advanced Excel Skills That Every Corporate Employee Should Know

Being able to set up data validation rules ensures data integrity and accuracy. It allows you to define specific criteria for data entry, restrict input to certain values, create drop-down lists, and prevent errors. Additionally, understanding how to protect worksheets, workbooks, and cells with passwords or permissions helps safeguard sensitive information. Conditional formatting enables you to highlight cells based on specific conditions or rules. It helps in visually identifying trends, variances, outliers, or data patterns. Utilising conditional formatting effectively improves data analysis and presentation, making it easier to interpret and draw insights. Excel offers a variety of advanced chart types and customization options. If you're looking for Advanced excel training in Delhi that covers charting techniques, Power Pivot, and other data analysis skills, there are various training providers and institutes that offer such courses Power Pivots are powerful add-ins in Excel that enable data integration, transformation, and modelling. They allow you to import data from multiple sources, clean and shape it, create relationships between tables, and build advanced data models. These tools are particularly useful for handling large datasets and performing complex data analysis tasks.
Essential Skills for Corporate Success
Here are the top five advanced Excel skills that every corporate employee should know:
Advanced Formulas and Functions: Excel offers a wide range of formulas and functions that can significantly enhance data analysis and manipulation. Some advanced formulas and functions include VLOOKUP, INDEX-MATCH, SUMIFS/COUNTIFS, IFERROR, CONCATENATE, TEXT functions, and array formulas. Understanding and utilising these functions can help automate calculations, perform complex data analysis, and streamline workflows.
PivotTables and Pivot Charts: PivotTables are powerful tools for summarising and analysing large datasets. They allow you to quickly organise and summarise data, create custom reports, perform calculations, and visualise trends. Knowledge of pivot tables and pivot charts helps corporate employees gain valuable insights from data and present it effectively.
Data Analysis and Visualisation: Excel provides various tools and techniques for data analysis and visualisation. Skills like sorting, filtering, conditional formatting, data validation, and creating dynamic charts can help employees analyse data effectively and present it in a visually appealing manner. Advanced features such as sparklines, slicers, and data bars can enhance data visualisation capabilities.
Macros and VBA (Visual Basic for Applications): Macros and VBA allow users to automate repetitive tasks, create custom functions, and build interactive user interfaces in Excel. Knowledge of macros and VBA enables employees to streamline workflows, increase efficiency, and create customised solutions. They can automate tasks like data entry, report generation, and data manipulation.
Data Import and External Connections: Excel offers functionality to import data from external sources such as databases, websites, and text files. Understanding how to establish connections, import data, refresh data, and transform it for analysis is crucial. Skills like using Power Query (to get and transform data) and connecting to external data sources empower employees to work with diverse datasets efficiently.
Elevate Your Skills and Excel in the Business World
Data analysis and visualisation go hand in hand with advanced Excel skills. Techniques such as sorting, filtering, conditional formatting, and data validation provide a solid foundation for effective data analysis. Furthermore, understanding how to create dynamic charts, utilise sparklines, and implement data bars enhances data visualisation capabilities, making it easier to identify trends, patterns, and outliers.
For automation and efficiency, employees should delve into the world of macros and VBA (Visual Basic for Applications). Macros allow for the recording and execution of repetitive tasks, saving valuable time and reducing errors. With VBA, professionals can take automation to the next level by creating custom functions, building interactive user interfaces, and integrating Excel with other applications, increasing productivity and streamlining workflows.
The ability to import and connect to external data sources is also a valuable skill in the corporate world. Excel offers functionalities like Power Query (Get and Transform Data) that enable professionals to import and transform data from various sources seamlessly. This skill is particularly useful when dealing with large datasets or when working with data from external databases, websites, or text files. Excel mastery also encompasses collaboration and data sharing.
Understanding features like shared workbooks, tracking changes, comments, and data merging allows for effective teamwork and version control. These skills promote seamless collaboration, ensure data accuracy, and facilitate smooth workflows within corporate environments. By pursuing Excel mastery for corporate excellence, professionals can elevate their skills and stand out in the business world.
Acquiring Advanced Excel Corporate training skills empowers employees to streamline processes, make data-driven decisions, and effectively communicate insights. With the ability to leverage advanced formulas and functions, work with pivot tables and pivot charts, perform data analysis and visualisation, automate tasks with macros and VBA, handle data import and external connections, and collaborate effectively, professionals can maximise their productivity, contribute to organisational success, and excel in their corporate endeavours.
What Excel skills are employers looking for?
Financial Modelling: For roles that involve financial analysis, employers often seek candidates who can create financial models, perform sensitivity analysis, and build scenario-based projections using Excel. Proficiency in functions like NPV (Net Present Value), IRR (Internal Rate of Return), and financial functions is highly desirable.
Data Cleansing and Data Transformation: Employers look for candidates who can clean and transform data using tools like Power Query (Get and Transform Data). This skill ensures data accuracy and prepares datasets for analysis.
Collaboration and Data Sharing: Proficiency in collaboration features like shared workbooks, tracking changes, comments, and merging data from multiple users is valuable. These skills promote effective teamwork and version control.
Problem-Solving and Analytical Thinking: Beyond specific Excel functionalities, employers value candidates who can apply analytical thinking and problem-solving skills to analyse complex data, identify patterns, and draw meaningful insights.
Continuous Learning and Adaptability: Employers appreciate candidates who demonstrate a willingness to learn and adapt to new Excel features and updates. Being proactive in staying updated with Excel advancements showcases an ongoing commitment to excel in the role.
Mastering these advanced Excel skills
Having Advanced Excel Corporate Trainer is crucial for corporate employees in today's data-driven business environment. The ability to utilise advanced formulas and functions, work with PivotTables and Pivot Charts, perform data analysis and visualisation, automate tasks with macros and VBA, handle data import and external connections, implement data validation and protection, apply conditional formatting, leverage advanced charting techniques, conduct what-if analysis, and utilise Power Query and Power Pivot provides a competitive edge and enhances productivity. By acquiring and honing these skills, corporate employees can effectively manage and analyse data, make informed decisions, streamline processes, and communicate insights with clarity. Mastering advanced Excel skills is a valuable asset that equips employees with the tools they need to excel in their roles and contribute to the success of their organisations.
For more information, contact us at:
Call: 8750676576, 871076576
Email: [email protected]
Website: www.advancedexcel.net
#excel training in gurgaon#mis training in gurgaon#excel training in delhi#advanced excel training in gurgaon#advanced excel training in delhi#excel classes in gurgaon#advanced excel classes in gurgaon#excel course in gurgaon#advanced excel corporate training#advanced excel corporate trainer
1 note
·
View note
Text
The Art of Data Visualization in MS Excel

Introduction:
In today's data-driven world, the ability to effectively visualize data is a crucial skill for professionals across various industries. Microsoft Excel, a powerful spreadsheet tool, is not only for calculations and data management but also offers robust data visualization capabilities. In this blog, we will explore the art of data visualization in MS Excel and how it can be a valuable skill for those seeking to excel in their careers. If you're looking to enhance your proficiency in MS Excel, consider joining an ms excel training academy in Uttam Nagar to master this essential tool.
The Power of MS Excel:
Microsoft Excel has long been a staple in offices worldwide, primarily used for tasks such as data entry, analysis, and financial modeling. However, what sets Excel apart is its ability to transform raw data into compelling visual representations that are easy to understand. With a vast array of chart types and customization options, Excel can turn complex datasets into informative and visually appealing graphics.
Why Data Visualization Matters: Data visualization is not just about making your data look pretty; it's about making your data meaningful and actionable. Here are a few reasons why mastering data visualization in MS Excel is essential:
Clarity: Visualizations help in presenting complex data in a clear and concise manner, making it easier for stakeholders to grasp key insights.
Storytelling: Charts and graphs can tell a story that numbers alone cannot. They can highlight trends, patterns, and outliers, enabling better decision-making.
Engagement: Visuals capture attention and engage your audience, whether it's during a presentation, a report, or a dashboard.
Efficiency: Excel's visualization tools can help you save time by automating the creation and updating of charts, ensuring that your visuals are always up-to-date.
Creating Effective Visualizations in MS Excel: To harness the full potential of data visualization in MS Excel, follow these best practices:
Select the Right Chart Type: Choose a chart type that best represents your data, such as bar charts, pie charts, line graphs, or scatter plots.
Simplify: Keep your visualizations simple and avoid clutter. Remove unnecessary elements, labels, or gridlines that may distract from the main message.
Use Color Wisely: Color can enhance your visuals, but excessive use can confuse. Stick to a color scheme that aligns with your message and maintains readability.
Add Context: Provide context for your data by adding titles, labels, and annotations. Explain what the chart is showing and what the audience should take away from it.
Interactivity: Utilize Excel's interactive features, such as data filtering and slicers, to allow users to explore the data on their own.
To truly master the art of data visualization in MS Excel, it's essential to receive proper training and guidance. Consider enrolling in an MS Excel course in Uttam Nagar, where experienced instructors can teach you the ins and outs of Excel's data visualization tools. These courses offer hands-on experience and practical knowledge that will empower you to create impactful visuals and harness the full potential of Excel.
Conclusion:
Start your journey by exploring ms excel classes in Uttam Nagar or ms excel training in Uttam Nagar and unlock the potential of your data.In a world where data is abundant and valuable, the ability to convey insights through compelling visuals is a skill that can set you apart in your career. Microsoft Excel, with its extensive data visualization capabilities, is a valuable tool for professionals across industries. So, whether you're a business analyst, a finance professional, or simply someone who works with data regularly, mastering the art of data visualization in MS Excel is a skill worth investing in.
0 notes
Text
Learn Power BI Tutorial Beginner to Pro 2023 Edition [Full Course]
Introduction to Power BI Course
Welcome to the Power BI Course! In this comprehensive training program, we will embark on an exciting journey to explore the powerful world of Microsoft Power BI, a leading business intelligence and data visualization tool. This course is designed to equip you with the essential skills and knowledge required to harness the full potential of Power BI and make data-driven decisions with confidence.
1. The Power of Data Visualization:
In today's data-driven world, organizations generate massive amounts of data. However, raw data alone is not enough to drive informed decision-making. The ability to transform data into meaningful insights is crucial, and this is where Power BI shines. By providing an intuitive and user-friendly interface, Power BI enables you to create captivating visualizations, interactive dashboards, and insightful reports, empowering you to extract valuable information from your data effortlessly.
2. Understanding Power BI:
Before diving into the technical aspects, we will start by understanding the fundamental concepts of Power BI. You will learn about the components that make up the Power BI ecosystem, including Power BI Desktop, Power BI Service, and Power BI Mobile, and how they work together to deliver a seamless user experience. Additionally, we will explore the key features and functionalities that set Power BI apart as a leading BI tool.
3. Data Preparation and Transformation:
One of the initial steps in any data analysis process is data preparation. In this course, we will guide you through the process of connecting Power BI to various data sources, including Excel, databases, and online services. You will learn how to transform and cleanse raw data into a structured and usable format, ensuring that your analyses are accurate and reliable.
4. Building Interactive Reports:
With a solid foundation in data preparation, we will move on to designing interactive reports. Power BI offers a wide range of visualization options, from basic charts and graphs to custom visualizations created by the vibrant Power BI community. You will discover how to present data in a compelling and informative manner, using different types of visualizations to effectively communicate insights to stakeholders.
5. Creating Dynamic Dashboards:
Dashboards are a crucial element of data analysis, as they provide a consolidated view of essential metrics and KPIs. In this section, we will show you how to combine multiple visualizations into interactive and dynamic dashboards. You will also learn how to set up filters, slicers, and other interactive elements to allow users to explore the data on their terms.
6. Sharing and Collaborating:
Data analysis becomes more impactful when shared with others. Power BI enables you to publish and share your reports and dashboards securely, both within your organization and externally. We will walk you through the process of sharing your work and collaborating with colleagues to foster data-driven decision-making across the organization.
7. Power BI for Data Modeling and Analysis:
To take your skills to the next level, we will delve into the realm of data modeling and analysis. You will learn about data relationships, calculated columns, and measures, which are essential for creating robust and accurate data models. These models will empower you to perform in-depth analyses, conduct what-if scenarios, and gain deeper insights into your data.
8. Advanced Power BI Features:
As we approach the conclusion of the course, we will introduce you to some of the advanced features and functionalities that Power BI offers. This includes data security, DAX expressions, custom visuals, and incorporating AI and machine learning capabilities to enrich your reports.
Conclusion:
By the end of this Power BI course, you will have gained a comprehensive understanding of the tool's capabilities and the skills to transform raw data into powerful insights. Whether you are a business professional, data analyst, or IT expert, the knowledge acquired in this course will empower you to make data-driven decisions and contribute significantly to your organization's success. So, let's get started on this exciting journey of unleashing the power of data with Power BI!
Learn Power BI Tutorial Beginner to Pro 2023 Edition [Full Course]
#power bi#power bi tutorial#power bi desktop#power bi dashboard#microsoft power bi#learn power bi#power bi training#power bi for beginners#power bi tutorial for beginners#what is power bi#power bi reports#power bi course#power bi demo#how to use power bi#power bi full course#power query#introduction to power bi#power bi project#dax power bi#power bi desktop tutorial#curso de power bi#power bi beginner#power bi pro#power bi dax#power bi data
1 note
·
View note
Text
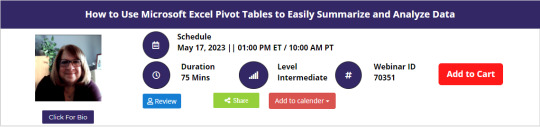
How to Use Microsoft Excel Pivot Tables to Easily Summarize and Analyze Data
PivotTables can help you sort and sift through large data sets to focus quickly on just the data elements that matter most to your specific needs.
In just one fast-paced and informative training session, you'll learn how to use PivotTables to sort your data more efficiently, create multiple customized reports in a few easy steps and gain a powerful new tool to help you make better business decisions.
In addition, you'll get tips on the easiest way to group your data. Most importantly, when you use the power of PivotTables, you'll be saving time and making your job easier.
Why Should You Attend
Attend the webinar to get an in-depth knowledge of PivotTables, including how the tool helps in making customized reports and how it helps in making better business decisions.
Objectives of the Presentation
» Create PivotTables and modify their structure
» Filter and Sort the data in a PivotTable
» Change the PivotTable calculations
» Show pivoted data in terms of percentages
» Refresh the PivotTable based on changes in the original database
» Group date fields to view the data over different time periods
» Format a PivotTable
» Drill down to the source of data from a PivotTable
» Use Slicers to make filtering a PivotTable simple
» Create a PivotChart to see the data visually
Areas Covered in the Session
» Why PivotTables are the hidden gems of Excel
» How to analyze large data sets from different business perspectives
» Create a PivotTable to summarize data
» Make understanding the data easier for others
» Use PivotTables to answer questions about the data
» Analyze patterns in the data
» Customize the summary by grouping data
» Format PivotTables for easy viewing
» Use a chart to view the summary visually
Who Will Benefit
» Business Owners
» CEO's / CFO's / CTO's
» Managers
» Accountants
» CPA's
» Financial Consultants
» IT Professionals
» Auditors
» Human Resource Personnel
» Bookkeepers
» Marketers
» Anybody with large amounts of Data
» Anybody who uses Microsoft Excel on a regular basis, and wants to be more efficient and productive
To Register (or) for more details please click on this below link:
https://bit.ly/452dGAo/a>
Email: [email protected]
Tel: (989)341-8773
0 notes
Text
How Power BI Can Be Used to Create Interactive Data Visualizations
Introduction of Power BI?
In today’s digital world, data is a valuable asset for any business or organization. However, raw data is often difficult to understand and analyze, which makes it challenging to make informed decisions. Power BI is a powerful tool that helps to transform data into interactive visualizations and business intelligence insights. In this blog post, we will discuss what Power BI is and how it can be used to create interactive data visualizations.
What is Power BI? Power BI is a business intelligence tool developed by Microsoft that allows users to connect to multiple data sources, transform and analyze data, and create interactive visualizations and reports. It is a cloud-based service that can be accessed from anywhere and on any device. Power BI is designed for both technical and non-technical users, making it easy for anyone to create compelling and interactive visualizations.
How can Power BI be used to create interactive data visualizations? Power BI offers a variety of features that enable users to create interactive data visualizations.
Let’s take a closer look at some of these features.
Data Connectivity:
Power BI allows users to connect to multiple data sources, including Excel spreadsheets, cloud-based data storage platforms like SharePoint and OneDrive, and big data platforms like Hadoop and Azure. This means that users can easily access their data from different sources and analyze it in one place. Once the data is connected, users can transform and shape it using the data transformation features in Power BI.
Data Transformation
Power BI provides users with a range of data transformation options, such as cleaning, shaping, and modeling data. The Power Query Editor in Power BI allows users to clean and shape their data using a simple drag-and-drop interface. Users can merge, filter, pivot, and aggregate their data without having to write complex code. Power BI also has a feature called DAX (Data Analysis Expressions), which allows users to create custom calculations and measures based on their data.
Visualizations
Power BI offers a wide range of visualizations, including charts, graphs, maps, and tables, that can be customized and configured to fit the user’s needs. Users can choose from a variety of pre-built visuals or create their own custom visuals using the Power BI developer tools. Visualizations can be customized with colors, fonts, and formatting options. Power BI also offers the ability to create hierarchies and drill-downs in visualizations, allowing users to explore their data in more detail.
Interactive Features
Power BI provides a range of interactive features that enable users to explore their data in a more detailed manner. Filters and slicers allow users to filter their data based on specific criteria, while drill-throughs allow users to see more detailed information about a specific data point. Bookmarks in Power BI enable users to save specific views of their data and navigate to them quickly. Users can also create interactions between different visuals, allowing them to cross-filter and highlight data across different parts of their report.
Sharing and Collaboration
Power BI allows users to share their visualizations and reports with others, making it easy to collaborate and share insights across teams. Users can share reports and dashboards with specific individuals or groups, and they can control who can view, edit, or publish reports. Power BI also allows users to embed their visualizations in other applications, such as SharePoint and Teams, for easier access and use.
Read More:
https://www.itpathsolutions.com/how-power-bi-can-be-used-to-create-interactive-data-visualizations/
1 note
·
View note
Text
Unlocking The Power Of Excel With An Online Course
Unlocking the Power of Excel with an Online Course is a great way to gain the skills and knowledge necessary to become proficient in Excel. Excel is the world's most popular spreadsheet program, and is used in many industries to track and manage data. This online course will teach you how to use Excel for data analysis, data visualization, and automation. You will gain an understanding of the advanced features of Excel, such as pivot tables and Power Pivot, and how to create powerful formulas to solve complex problems. You will also learn how to create interactive dashboards, work with macros and build data models. With this course, you will be able to make the most of Excel's capabilities and unlock the power of your data.
Understanding Excel Basics
Excel is a powerful tool used by businesses and organizations around the world. It can be used to organize data, calculate complex formulas, create graphs and charts, and much more. But before you can unlock the power of Excel, you must first understand its basics. Taking an online excel training course will help you get acquainted with the interface and how to navigate it. You’ll learn how to enter and format data, create simple formulas, use basic functions, and more. The course will also teach you how to set up a worksheet, add and delete columns and rows, format cells, and insert tables and charts. You’ll also discover how to use filters and sorting to narrow down your data and quickly find what you need.
Excel Formulas And Functions
Once you have a basic understanding of Excel, you can move on to learning formulas and functions. This is where Excel really starts to shine, as it can be used to perform complex calculations and analysis on data. Taking an online course will walk you through the different types of formulas and functions available, such as SUM, AVERAGE, COUNTIF, and more. You’ll learn when and how to use them, and how to combine multiple functions for more advanced analysis. You’ll gain an understanding of absolute and relative cell references, as well as how to use array formulas and nested functions.
Analyzing Data With Pivot Tables
Pivot tables are a great way to analyze and summarize large amounts of data. They allow you to quickly view and analyze data in different ways. Taking an online course will teach you how to create pivot tables and how to use them to your advantage. You’ll learn how to modify and format a pivot table and how to use slicers to filter data. You’ll also learn how to use calculated fields and calculated items, and how to create interactive pivot charts.
Creating Charts And Graphs
Excel is a great tool for creating charts and graphs. Taking an online course will teach you how to create different types of charts, such as column and bar charts, line graphs, and more. You’ll learn how to format a chart and add labels, titles, and legends. You’ll also learn how to create a combination chart, which combines two different chart types in one. You’ll also learn how to work with 3D charts and other advanced charting techniques.
Working With Macros And Vba
Excel Macros and Visual Basic for Applications (VBA) are powerful tools that allow you to automate tasks in Excel. Taking an online course will teach you how to create and use macros and how to write VBA code. You’ll learn how to use the Macro Recorder to record your actions and how to edit the resulting code. You’ll also learn how to debug your code and how to use the various VBA functions available.
Utilizing Conditional Formatting
Conditional formatting is a great way to quickly analyze and highlight data in Excel. Taking an online course will teach you how to use conditional formatting to your advantage. You’ll learn how to create basic rules, such as highlighting cells that meet certain criteria, as well as more advanced rules, such as creating custom formulas. You’ll also learn how to apply preset styles and how to create your own.
Analyzing Big Data With Excel
Excel is a great tool for analyzing big data. Taking an online course will teach you how to use Excel to analyze large datasets. You’ll learn how to use the Power Query add-in to import and transform data, and how to use the Analysis Toolpak to perform statistical analysis. You’ll also learn how to use Power Pivot to create data models and how to use Power View to create interactive visualizations.
Automating Excel Tasks With Power Query
Power Query is a powerful add-in for Excel that allows you to quickly and easily automate tasks. Taking an online course will teach you how to use Power Query to automate data import and transformation. You’ll learn how to use the Query Editor to clean and transform data and how to use the Power Query Formula Language (M) to create custom formulas. You’ll also learn how to use Power Query to create macros and how to publish your queries to the web.
Implementing Advanced Excel Techniques
Once you have mastered the basics of Excel, you can move on to more advanced techniques. Taking an online course will teach you how to use VLOOKUP and HLOOKUP to quickly find data, how to use INDEX and MATCH to look up data in multiple columns, and how to use OFFSET to create dynamic ranges. You’ll also learn how to use the IFERROR function to handle errors gracefully, and how to use data validation to ensure data integrity.
Conclusion
Taking an online course in Excel can help you unlock the power of Excel and become a more efficient and productive worker. You will learn essential skills, such as how to create formulas, use data effectively, and create charts and graphs. With the help of a comprehensive online course, you will be able to utilize the full potential of Excel to help you with your work faster and more efficiently.
0 notes
Text
Virtual dj 8 free. download full version mac

#Virtual dj 8 freeload full version mac how to#
#Virtual dj 8 freeload full version mac full#
#Virtual dj 8 freeload full version mac android#
#Virtual dj 8 freeload full version mac pro#
Its built-in sampler will let you spice up your mixes with a broad range of drops and loops, or you can go creative and merge live performance and production by creating remixes on-the-fly by using the sampler like a sequencer. And if you mix videos, you’ll also find a lot of video effects and transitions to play with.
#Virtual dj 8 freeload full version mac android#
Further, you can remotely control this application by your iOS or Android devices.It comes with a plethora of effects, ranging from traditional flanger, echo, etc, to more modern “beat-aware” effects like beatgrid, slicer, loop-roll.In addition, it provides you smart transitions and allows you to record the mix.It also provides you the powerful track management with smart files.Also, it contains a powerful sampler that provides you instant beats to spice up your mix.Similarly, it is the best choice that provides you the best sound quality ever.This application supports all the karaoke formats and allows you to play on-screen with lyrics.in addition, it has the ability to work for both video DJs and audio DJs.It provides you with fully customizable video skins to engage in video graphics.In addition, this application provides you stunning visualization effects to engage viewers.
#Virtual dj 8 freeload full version mac pro#
Also, Virtual Dj Pro 2020 Crack works with all Special popular DVS vinyl.
VirtualDJ supports over 300+ controllers including Pioneer, Numark, Denon and more.
This software quantizing features for valuable mixing assistance.
It is powerful, yet intuitive and easy to learning.
Virtual DJ Torrent 2020 is fully operational even without DJ hardware.
Virtual DJ recognizes the style of the music (techno, hip hop, lounge) and adapt its mix in consequence.
Compatibility with most external controllers (DMC2, DAC3, iCDX, TotalControl, BCD2000, DJConsole, etc…).
External MIDI keyboard compatibility for shortcuts.
Fully customizable (skin engine and shortcut macro engine).
Optional 3D sound card, 2 sound cards or Y-splitter for real-time monitoring or external mixable use.
Ready-to-burn file recording to burn your own mixed CDs.
Automatic Hot-Swap of external hard drives.
Virtual Dj Pro 2020 Crack has Automatic filter folders.
Song database engine with easy-to-use search feature.
Infinite number of video effect simultaneously.
Video mix with TV output (mix songs and/or video clips !).
Included: beat grid, Flippin, vocal remover, filter, flanger, backspin, brake, etc…).
Infinite number of cue points saved per songs.
Infinite number of beat locked desks (local multi-instance or network).
Automatic first beat and last beat detection.
Synchronized sampler with 12 instant slots.
Virtual scratch: Scratch your mp3 with your bare hand.
Dynamic beat visualizer for easy drag-drop beat-matching.
More, Virtual Dj Pro 2020 Crack Automatic level matching.
your songs will always stay in time, and you can work your mixes incredibly faster than any other DJ could.
Further, Three-band equalizers with Kill + gain.
Best Standard controls (play, pause, stop, cue).
Sample Editor shows a video timeline for video samples.
#Virtual dj 8 freeload full version mac how to#
So, follow the insertion given in how to crack section. More, specifically, I’m offering to you a huge deal I offer you to activating this pro tool without any dollar. It can simply work with different platforms like Windows, Mac, and Linux, etc. Such a cool sound mixer with a brilliant simple platform. Also, it has the ability to boost sound with excellent audio quality. The PRO version has next level advance features with beat tuning match to find exact beat. Further, it and can automatically reset your data as you wish. As a result, your revenue share gets rich and rich. So, it enhances your business to rank high. It is a perfect software for beginners DJs that provide PRO features.
#Virtual dj 8 freeload full version mac full#
Virtual Dj Pro 7.0.5 Full Download Crack is a quick audio mixer which provides excellent mixing MP3 songs.
1 note
·
View note
Text
Slicer in Excel | Excel में Slicer का Use कैसे करें
Slicer in Excel | Excel में Slicer का Use कैसे करें
एक्सेल में Slicer का प्रयोग कैसे करें (How to use Slicer in Excel)
Slicer in Excel – Slicer एक Visual Filter हैं या Interactive Button हैं। जो आपको यह देखने की अनुमति देते हैं कि Pivot Table के भीतर कौन से Item Select किये गए हैं। Slicer का Use करके, आप अपने इच्छित Data Types पर Click करके अपने Data (Table, Pivot Table, Pivot chart) को Filter कर सकते हैं। आप Excel में जल्दी और आसानी से Pivot…
View On WordPress
0 notes
Text
How To Do A Pivot Chart In Excel For Mac
I use a Mac for work, and I have to send pivot table reports to colleagues and clients that use both PCs and Macs. I am using Excel 2007 to create the pivot tables, and I am having a lot of problems with producing a pivot table that looks the same on both Mac and PC.
Creating the pivot table on my Mac is such a pain, so I am now creating the tables on my personal PC. After I get the pivot table created and formatted it works/looks great on the PC, and any PC users I send it to. The problem I am having is when I send it to Mac users. All formatting seems to lost/messed up, and I can't seem to fix this on the Mac. I need the pivot tables to look professional and consistent for everyone I send them to, PC or Mac.
I am wondering if I need to write a macro to make the formatting stay the same on the Mac, and if I do, I am wondering how to do that? If anyone could help me out with this I would really appreciate it! Thanks!
Drag fields to the Rows and Columns of the pivot table. Start building the pivot table; To add the text to the values area, you have to create a new special kind of calculated field called a Measure. Look at the top of the Pivot Table Fields list for the table name. Right-click the table name and choose Add Measure. WATCH PART 2: file used in the video: this video s. Create a PivotChart Select a cell in your table. Select Insert PivotChart. Pivot Charts Are Here! That's right Mac users, you have something to celebrate today! 🙂 Pivot Charts have finally made their way into the Mac version of Excel. This means you can now create interactive dashboards with pivot tables, charts, and slicers on the Mac. If we check the pivot table, we see it is filtered in exactly the same way. In fact, because the pivot table and pivot chart are linked together, you might want to turn off the chart buttons, and just use the pivot table to control filtering. This will give your chart a much cleaner look, but might need to label the chart make active filters clear.
Slicers are a visual way to filter data in a pivot table. With the Report Connections icon, you can have a slicer control multiple pivot tables on a dashboard—but only if all the pivot tables are from the same data set. Fortunately, there’s a separate way to control multiple pivot tables from different data sets, provided they have one field in common.
For this example, you have a sales worksheet and a quality worksheet. You want to summarize both data sets in a dashboard. The goal is to have a slicer that can filter all the pivot tables by industry. Both data sets have a Sector field listing the industry sector.
Because this technique uses the Data Model, it only works in Windows versions of Excel. It won’t work on a Mac or Excel online.
Your first step is to create a new table that has a sorted, unique list of the industries found in either report. You might use an Advanced Filter for this, but an easy way is to copy the Sector column from both data sets to a new table and then use Data, Remove Duplicates to make sure each industry appears in the list just once.
Next, convert the original data sets and your new small table of sectors into a table. Select one cell in a data set and press Ctrl+T to create a table. Make sure My Table Has Headers is checked in the Create Table dialog box. Repeat for all three tables.

After creating a table, Excel uses names like Table1, Table2, and Table3. Using the box on the left side of the Table Design tab in the ribbon, rename the tables with descriptive names like Sales, Quality, and Sectors.
DEFINING RELATIONSHIPS
Click the Relationships icon on the Data tab to open the Manage Relationships dialog. Click the New button to create a relationship. The first relationship is from the Sales table to the Sectors table. Choose Sector as the related column in both tables.
How To Combine Two Pivot Tables
Create a second relationship between the Quality table and the Sectors table.
To visualize the relationships, click the Manage Data Model icon on the Data tab, which opens the Power Pivot window. Click Diagram View in the top-right of the Home tab. You should see the two original tables with the Sectors table in the middle. Hover over either arrow to confirm that the tables are linked by the Sector field. Use File, Close to close the Power Pivot window and return to Excel.
BUILD PIVOT TABLES
Normally, to create a pivot table from the Sales data, you would select one cell in your Sales table first and choose Insert, PivotTable. Because you have defined relationships, however, the collection of tables and relationships comprise a Data Model. So go to a blank section of your dashboard and choose Insert, PivotTable. Excel will default to using the workbooks data model as the source.
Excel Pivot Table Tutorial Pdf
Build any number of pivot tables. In the figure below, two pivot tables are based on the Sales data while the orange pivot table is based on Quality data.
CREATE THE SLICER
In order for the slicer to control pivot tables coming from both the Sales and Quality data, the slicer must be built based on the tiny Sectors table. Although you might normally create slicers using the Slicer icon on the PivotTable Analyze tab, you should switch to the Slicer icon on the Insert tab when using the Data Model.
From the Insert tab, choose Slicer. Excel opens the Existing Connections dialog box. Choose the second tab (called Data Model) and choose Tables In This Workbook Data Model. Click Open. Excel opens the Insert Slicers dialog. There’ll be two tabs: Active and All. Choose the tab for All and scroll down to the Sectors table. Be careful in this dialog. The Sector field is listed three times, but for the technique to work, you must select the Sector field from the Sectors table.
How To Do A Pivot Chart In Excel For Mac Shortcut
With the slicer selected, go to the Slicer tab in the ribbon. Choose Report Connections. Initially, the slicer isn’t connected to any pivot table. Choose each pivot table in the workbook. Click OK.
FORMAT THE SLICER
Slicers always start with a single column of items. While a slicer is selected, use the resize handles to change the shape. Use the Columns setting on the Slicer tab in the ribbon to show the slicer items in more columns.
When you select from the slicer, all the pivot table reports will be filtered by the slicer. For example, the figure below shows a report for only the Manufacturing sector.
To select multiple items from the slicer, turn on the Multi-Select feature using the icon with three checkmarks in the top of the slicer. Or, hold the Ctrl key while selecting additional items.
SF SAYS
Pivotpal Free Download
To add more slicers, you’ll need a tiny joiner table and two relationships for each slicer.
You may also like
Stronger Together
Excel Pivot Table Multiple Data Sources
Microsoft’s New Pocket PC
1 note
·
View note
Text
How CHATGPT can make my excel spreadsheet work more efficient:
Here's a scenario: You have a large Excel spreadsheet with sales data, and you want to calculate the total sales for each product category and create a summary table. You're looking to streamline this process.
Ask for Formula Help:
You can ask ChatGPT something like, "What Excel formula can I use to calculate the total sales for each product category?"
Formula Explanation:
ChatGPT can provide you with the formula you need, such as SUMIFS or PivotTable, and explain how to use it.
PivotTable Guidance:
If you're interested in using PivotTables for this task, you can ask, "How can I create a PivotTable to summarize sales data by product category?"
PivotTable Customization:
If you want to customize the PivotTable further, you can ask for tips on formatting, sorting, or adding slicers for interactive filtering.
Data Cleaning:
If your data needs cleaning or formatting before analysis, you can ask for advice on removing duplicates, handling missing values, or ensuring consistent data formats.
Automation:
If you frequently update this data, you can inquire about automating the process with Excel macros. ChatGPT can provide guidance on writing VBA code for automation.
Troubleshooting:
If you encounter any issues or errors while implementing the suggested solutions, you can describe the problem to ChatGPT for troubleshooting assistance.
By using ChatGPT for these tasks, you can efficiently tackle data analysis in Excel, save time, and ensure accuracy in your spreadsheets. Remember to provide specific details about your data and requirements to receive the most helpful guidance.
#promptsharing#exceltraining#chatgpttips#exceltips#chatgpt#infographic#ai#microsoft excel#powerpoint
0 notes
Text
Mastering Excel Pivot Tables & Pivot Charts: Number Crunching Made Easy
In this webinar, you will learn how to take all of your raw data and quickly turn that data into easy to use flexible summary reports using Pivot Tables and Charts. We will start with the basics and built up to more complex pivot tables.
Many people struggle with how to create Pivot Tables, or maybe they don't even know what they can do, or maybe they think they are too difficult. I'm going to show you what they are, how to use them, and that they are not difficult, and they can give you tremendous results. We will then make Pivot Charts, to graphically show the data. Then, we will add sorts, filters, slicers, and timelines to create a very easy-to-use, but very powerful dashboard that can give you instant results, and allow you to slice and dice your data any which way. You and your staff will be instantly more productive in Excel.
Why Should You Attend
In today's busy world, everybody wants quick results. Plus, people don’t have time to look at tons of data. They want a visual summary of the data. Excel dashboards will allow you to change the criteria of the data very quickly, and then see the reports right away in a visually pleasing format.
Areas Covered in the Session
» Creating and managing Pivot Tables
» Adding A pivot chart
» Adding Slicers
» Adding timelines
» Changing the calculation type
» Adding additional calculations
» Creating custom calculations
» Multilayer reports
» Creating Daily, Monthly, quarterly, and yearly summaries
Who Will Benefit
» Business owners
» CEO's / CFO's / CTO's
» Managers of all levels
» Accountants
» CPAs
» Controllers
» Financial Consultants
» IT Professionals
» Auditors
» Human Resource Personnel
» Bookkeepers
» Marketers
» Admins
» Secretaries
» Anybody with large amounts of data
» Anybody who uses Microsoft Access/Excel on a regular basis, and wants to be more efficient and productive
To Register (or) for more details please click on the below link:
https://bit.ly/3zjspZ2/a>
Email: [email protected]
Tel: (989)341-8773

0 notes
Text
Microsoft Office 2019 for Mac 16.23 VL [Multilingual]
Office 2019 for Mac is designed from scratch to take advantage of the latest features of Mac, including Retina display support full – screen view and even bounce displacement.
It is the perfect combination of Office that you know and you trust, and the Mac you love. Microsoft Office 2019 is the latest iteration of the industry-standard office suit.
Microsoft Office 2019 includes the latest versions of Word, Excel, PowerPoint, Outlook, Exchange, SharePoint and Skype for Business, each of which is an essential tool in the computerised office workplace of today.
It also boasts a range of enhanced IT options that are designed to make life easier for newcomers to the field. Make no mistake: this is a versatile set of tools and no office should be without it.
What is Office 2019?
Microsoft Office 2019 is a standalone, local (not cloud-based, like Office 365) version of the Microsoft Office software suite. It is a “perpetual” release, which is just a fancy way of saying you buy the software once and own it forever, rather than having to pay an annual subscription fee to access it.
That said, you only get a license to use it on a single PC, whereas a subscription to Office 365 lets you use it on a PC, a tablet, and a smartphone.
This new release updates and replaces the 2016 versions of Word, Excel, etc. and includes many of the new features that have been rolled out to Office 365 users over the past three years. We’ll get to those in a bit.
When is Office 2019 available, and how much will it cost?
Office 2019 is on sale now, but only for commercial-level customers. Availability will be rolling out regular ol’ customers like you and me in the coming weeks. That also means we don’t yet know what the price point is for individual users, but Microsoft will likely have that info soon.
Expect to potentially pay a bit more than what you’d shell out for Office 2016 (currently $150 for the “Home and Student” version), as Microsoft already boosted the price of the commercial version ten percent to account for its “significant value added to the product over time.”
What are the system requirements for Office 2019?
Here’s a big change. On PCs, you’ll need Windows 10 for Office 2019; Microsoft will not support any versions of Windows 7 or 8. As always, Microsoft will make 32 and 64-bit versions of Office 2019 available.
Features
Add visual impact
Bring visual interest to your documents, worksheets, presentations, and messages by inserting Scalable Vector Graphics (SVG) that have filters applied to them.
Insert 3D models to see all the angles
Easily insert a 3D model, and then rotate it through 360 degrees.
Inking is where it’s at
Convert ink to shapes, write out complex math problems, highlight text, and more. Use a finger or a pen. A mouse works too!
Precision selecting
Ever selected too many cells or the wrong ones? You can now deselect extraneous cells without having to start over.
Timeline filters
Want to take a look your PivotTable data across years, quarters, months or even days? Easily filter a PivotTable with a timeline filter by sliding the date range.
Add motion with Morph
Make smooth animations, transitions, and object movements across your slides with Morph.
Add pizzazz with icons
Increase the visual impact of your presentations by illustrating your slides with our library of 500 icons.
Add punch with live action video
Add an online video to your slide and watch it without leaving PowerPoint.
Swipe right or swipe left? You decide!
Set the swipe left and swipe right gestures to the actions you use most. Choose from Delete, Archive, Mark as Read, Flag, or None.
Timeliness across time zones
Traveling across time zones? Create an event with different start and end time zones, and Outlook will take care of the conversion. No mental math required!
One-click fixes for accessibility issues
The Accessibility Checker is better than ever with updated support for international standards and handy recommendations to make your documents more accessible.
Learning Tools improve readability
Give your eyes a rest. Adjust text spacing, column width, and page color. Or listen as Word reads your document aloud, highlighting text as it’s read.
Microsoft Office 2019 Products
Word
Create and share professional-looking documents with state-of-the-art editing, reviewing, and sharing tools.
The new Design tab provides quick access to features, and Smart Lookup shows relevant contextual information from the web directly inside Word.
Excel
Analyze and visualize your data in new and intuitive ways with a fresh user interface plus your favorite keyboard shortcuts.
Leverage features like Analysis Toolpak, Slicers, and Formula Builder to save time, so you can focus on insights.
PowerPoint
Create, collaborate, and effectively present your ideas with new slide transitions and an improved Animations task pane. Threaded comments alongside your slides help you incorporate feedback into your presentations.
And Presenter View displays the current slide, next slide, speaker notes, and a timer on your Mac, while projecting only the presentation to your audience on the big screen.
OneNote
It’s your very own digital notebook, so you can keep notes, ideas, web pages, photos, even audio and video all in one place.
Whether you’re at home, in the office, or on the move, you can take it all with you wherever you go while sharing and collaborating with others. It’s great for school assignments, work projects, travel plans, party planning, and more.
Outlook
Like Word, Outlook is also getting a new focus mode, called the “Focused Inbox,” to help streamline workflow and email drafting. Users can now use “@” commands for tagging people in emails, and contact cards have been overhauled.
Also, PC users will now have travel and delivery cards, while Mac users get new email templates; a Send Later function for scheduling delivery times; and read receipts. Both platforms also get Office 365 Group integration.
PowerPoint
The changes for PowerPoint are all about enhanced media and visual element support in presentations.
The notable additions here are support for 3D model display/manipulation and SVG files on slides; new morph transitions; the ability to export your presentation in 4K UHD video format, and you can now write by hand and move elements with your pencil while editing.
Better pencil support and other tweaks
In addition to these program-specific updates, there are also changes that apply to all Office 2019 software.
The most important of these is Microsoft’s beefed-up support for digital pencils, like expanded “roaming pencil case” support, which lets users write by hand and move parts of documents with their pencil, as well as new support for pressure sensitivity and tilt recognition.
Office 2019 also comes with some behind-the-scenes changes such as monthly security updates and a reduction to network bandwidth use.
Will Office 2019 replace Office 365?
No. In a post announcing the software release, Microsoft makes sure to point out that Office 2019 is a standalone package of its software geared primarily towards private users and businesses who do not have the necessary internet access required to use the cloud-based Office 365.
Because of this, many of the features present in the Office 365 versions of these apps are not included in their Office 2019 counterparts, especially cloud-based and collaborative features.
Furthermore, Microsoft makes it clear that while Office 2019 will be receiving regular security fixes, it will not be getting expanded feature updates, while Office 365 users can still look forward to new and updated features through regular monthly updates just as they always have.
The bottom line here is that Office 2019 is not going to replace Office 365, and it really isn’t meant to. That said, regardless of the particular use case, Office 2019 still fills a crucial role and services a section of Microsoft’s customer base that may have felt a bit neglected since Office 365 took the spotlight.
Screenshots
This slideshow requires JavaScript.
What’s new?
TEXT JOIN, CONCAT, IFS, and more. Let Excel do the work so you don’t have to.
Microsoft Office 2019 for Mac 16.23 VL [Multilingual] Microsoft Office 2019 for Mac 16.23 VL Office 2019 for Mac is designed from scratch to take advantage of the latest features of Mac, including Retina display support full – screen view and even bounce displacement.
1 note
·
View note
Text
top tips to pass your excel
Excel tasks are normal for understudies in schools and higher learning foundations. Excel tasks are composed with the goal that all the data fits in as required. In this article, we will assist you with knowing how you can actually deal with your excel schoolwork and beat cutoff times.
As the understudies participate in excel schoolwork, they experience different difficulties, for example,
1. Absence of sufficient opportunity to do the task. School life is brimming with numerous exercises, and in the event that one doesn't design their time well, they end up not beating the cutoff time or doing the task ineffectively due to a pointless rush.
2. Lacking information with regards to managing progressed excel.
3. Absence of legitimate direction on the most proficient method to do excel tasks. Excel utilizes a great deal of recipes and excel easy routes, hence they need to know how to utilize and apply them. Understudies can beat this by getting moment excel schoolwork help from online coaches.
4. Insufficient information on the most proficient method to utilize current apparatuses, for example, MS excel. It turns into an issue for the understudies while tackling excel schoolwork issues.
To beat such issues and difficulties, here is the thing you are expected to do:
1. Have an arrangement
This is the primary stage as you start your excel schoolwork. At this stage, you want to know how long you have on time and what you are expected to do. As you list what is required, all things considered, let's be legitimate. On the off chance that you understand that time isn't your side, you can get moment excel schoolwork help from the excel experts.
2. Guarantee every one of the necessary information that you want is there
All things considered, let's beginning your excel schoolwork with all the fundamental data. Inability to which your task will turn out to be hard en route and will obliterate the stream. In the event that you have arranged your function admirably, all that will be simple and improved as you as of now have what is required.
3. Stay away from interruptions
Addressing excel schoolwork requires all out fixation and concentration. This is empowered by having a quiet climate from interruptions, for example, calls. By and large, students attempt to perform various tasks as they handle their tasks while watching the TV or occupied on their telephones. Stay away from this to dodge simplifying botches in your schoolwork paper.
4. Look for help from online mentors
Excel tasks end up being trying to the understudies. You can look for assist with excel schoolwork from coaches online who realize what is required with regards to excel schoolwork. They will expertly deal with the task getting extraordinary grades for you. Be that as it may, you don't simply go to any internet based guide. Take care of any outstanding concerns to work with the best in the business.
Microsoft Excel Features
Microsoft Excel's standard features can be collected into Graphical, Data Base, and Functional Features. Graphical components join; Charts, Shapes, Smart Arts, Clip Arts, and Pictures. The informational collection features play out a variety of data exercises, and these components include; Pivot Tables, Slicers, Sorting, Filtering, Data endorsements, and Grouping that help with dealing with rule issues.
Pragmatic features assist with performing solid calculations using console simple courses and overhaul the Excel Application Features. They fuse; Spell Check, Hyperlinks, VBA Macros used to robotize monotonous tasks, and different hundred inborn plans that help with playing out a wide extent of calculations. One can acquire the Microsoft Excel programming by getting it from a gear PC shop that sells programming or downloads it from the Microsoft website, disregarding the way that you should buy the grant key.You can in like manner search for assist with organizing guides on the web, who will help you on dealing with your overwhelm Problems.
0 notes
Text
Microsoft office 2010 windows 7 download free.Upgrade from Office 2010 to Microsoft 365
Microsoft Office - Download - Microsoft office 2010 windows 7 download free
Service Pack 1 for Microsoft Office , free and safe download. Service Pack 1 for Microsoft Office latest version: The patch that gets Office. Download Microsoft Office For Windows 7. Free and safe download. Download the latest version of the top software, games, programs and apps in Microsoft Office Starter edition can only be installed in Windows Vista and Windows 7.
https://bit.ly/3I5Hwri
https://bit.ly/3fun8Ea
https://bit.ly/3A2iyq7
https://bit.ly/3GO1qqN
https://bit.ly/3GC9zyq
https://bit.ly/3FB7gtP
https://bit.ly/3AaPBbt
https://bit.ly/33B4pE4
https://bit.ly/321N1YD
https://bit.ly/34Wvbrh
Microsoft office 2010 windows 7 download free.Microsoft Office Installer For Windows 7 Free Download
Home » Windows » Microsoft Office for Windows. MS Office Free Download is a dwnload presentation by the giant tech, jicrosoft a way of knowledge to its users how they edit, collaborate, manage, and share documents in their work environment. A versatile range of tools that give easy access to your documents without any limitation of time, place, or device. The charming and attractive interface will give a new look and impress you with its stunning productivity. The activation keys activate the Microsoft Office and enable you to enjoy the jicrosoft of all applications microsoft office 2010 windows 7 download free MS WordExcelOutlook, and PowerPoint.
The Office requires 3 GB of space on the hard drive. The application can be upgraded to the latest version of Office Beta. To activate all products just enter the serial number inside Word which will activate all related apps. Just follow the instructions for installing the program. A great variety mivrosoft features makes the suit more effective and reliable.
The visual elements with easy showcasing, enrichment in font effects, crop development, removing of background, and screenshot integration. The smooth change in MS Word, PowerPoint, Outlook, and Excel along with saving of your document on SkyDrive and collaborating online within two clicks gives more power to your office suit The usability, as well as the upgraded performance of Wordis very fast while using very few system resources.
The unlimited features of MS Word such as Paste option, Navigation officee, Backstage View improvements, native as well as cloud exporting or saving of PDF files, edit collaboratively and removing of few features of such as scanning document integration, startup assistant, diagnostic, and different Clip Organizer option, and a lot more.
The calculation engine in a redesigned shape with improved performance gets a positive response from users. The Solver add-on, some statistical options, graphical features, filtering tools, macro recording charts, and development of data points are also added in Excel The smooth and reliable Office suite helps you to collaborate as well as share documents online easily.
Get thoroughly informed about the content you microsoft office 2010 windows 7 download free working through using Sparklines and Slicer features.
You can easily show styles of data as well as filter your results. Additionally, the navigation tool helps you to change the map and Find dialog box in the preceding version, drag and drop and rearrange pages in a document. The x64 printer driver, dock mode for microsoft office 2010 windows 7 download free OneNote in any other window, recycle bin for storing notebooks for 60 days, and a Quick Filing feature for selecting a location and transferring data are the new elements added in OneNote Fresh Search Tools for searching and instruction to filter results, Social Connector is for collecting data from social network contacts, Conversation View for group messages as well as deleting them.
Skip to content. Download 200 file from given link or button. Downloading will take time according to your download speed. After mounting next step is to run setup. Wait for completing the installation, finish the microsoft office 2010 windows 7 download free, the full version of Microsoft Office is installed on your PC. Multiple Features A great variety of features makes the suit more effective and reliable.
Quick Performance The usability, as well as the upgraded performance of Wordis very fast while using very few system resources. Calculation Engine The calculation engine in a redesigned shape with improved performance gets a positive response from users. OneNote The x64 printer driver, /480.txt mode for displaying OneNote in any other window, recycle bin for storing узнать больше здесь for 60 days, and a Quick Filing feature for selecting a location and transferring data are the new elements added in Microsoft office 2010 windows 7 download free
https://bit.ly/3nPVztB
https://bit.ly/33DmIbU
https://bit.ly/33zJrFE
https://bit.ly/3GxooC1
https://bit.ly/33l2Av6
https://bit.ly/3A4j9aL
https://bit.ly/3rlpTgj
https://bit.ly/3GxWUfM
https://bit.ly/3KcdGTZ
https://bit.ly/3quw6Yg
This comprehensive process allows us to set a status for any downloadable file as follows:. Main article: Office Online. With the progress of time, Microsoft Office started changing radically. Cheat Engine 6. Microsoft Word is an office productivity software developed by Microsoft. Microsoft PowerPoint 3.
https://bit.ly/3nwU9DV
https://bit.ly/3fIP5s1
https://bit.ly/3nwYib8
https://bit.ly/3tsN7E9
https://bit.ly/3npV9d5
https://bit.ly/33EJUGq
https://bit.ly/3foR8RM
https://bit.ly/3nuY1W3
https://bit.ly/3A3jMBd
https://bit.ly/34WkhSj
0 notes
Last Seen Blogs

poetinmadrid-blog
Poet in Madrid

wimdyy
Wind

webgamemini
Webgamemini.app

up4line
Up4line|اب فور لاين

justshemales
just Shemales