#el niño
Text
Six Answers to Questions You’re Too Embarrassed to Ask about the Hottest Year on Record
You may have seen the news that 2023 was the hottest year in NASA’s record, continuing a trend of warming global temperatures. But have you ever wondered what in the world that actually means and how we know?
We talked to some of our climate scientists to get clarity on what a temperature record is, what happened in 2023, and what we can expect to happen in the future… so you don’t have to!
1. Why was 2023 the warmest year on record?
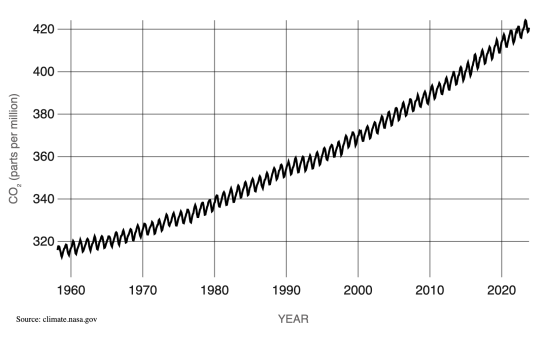
The short answer: Human activities. The release of greenhouse gases like carbon dioxide and methane into the atmosphere trap more heat near Earth’s surface, raising global temperatures. This is responsible for the decades-long warming trend we’re living through.
But this year’s record wasn’t just because of human activities. The last few years, we’ve been experiencing the cooler phase of a natural pattern of Pacific Ocean temperatures called the El Niño Southern Oscillation (ENSO). This phase, known as La Niña, tends to cool temperatures slightly around the world. In mid-2023, we started to shift into the warmer phase, known as El Niño. The shift ENSO brought, combined with overall human-driven warming and other factors we’re continuing to study, pushed 2023 to a new record high temperature.
2. So will every year be a record now?
Almost certainly not. Although the overall trend in annual temperatures is warmer, there’s some year-to-year variation, like ENSO we mentioned above.
Think about Texas and Minnesota. On the whole, Texas is warmer than Minnesota. But some days, stormy weather could bring cooler temperatures to Texas while Minnesota is suffering through a local heat wave. On those days, the weather in Minnesota could be warmer than the weather in Texas. That doesn’t mean Minnesota is warmer than Texas overall; we’re just experiencing a little short-term variation.
Something similar happens with global annual temperatures. The globe will naturally shift back to La Niña in the next few years, bringing a slight cooling effect. Because of human carbon emissions, current La Niña years will be warmer than La Niña years were in the past, but they’ll likely still be cooler than current El Niño years.
3. What do we mean by “on record”?
Technically, NASA’s global temperature record starts in 1880. NASA didn’t exist back then, but temperature data were being collected by sailing ships, weather stations, and scientists in enough places around the world to reconstruct a global average temperature. We use those data and our modern techniques to calculate the average.
We start in 1880, because that’s when thermometers and other instruments became technologically advanced and widespread enough to reliably measure and calculate a global average. Today, we make those calculations based on millions of measurements taken from weather stations and Antarctic research stations on land, and ships and ocean buoys at sea. So, we can confidently say 2023 is the warmest year in the last century and a half.
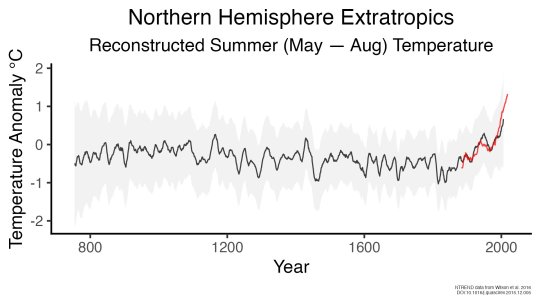
However, we actually have a really good idea of what global climate looked like for tens of thousands of years before 1880, relying on other, indirect ways of measuring temperature. We can look at tree rings or cores drilled from ice sheets to reconstruct Earth’s more ancient climate. These measurements affirm that current warming on Earth is happening at an unprecedented speed.
4. Why does a space agency keep a record of Earth’s temperature?
It’s literally our job! When NASA was formed in 1958, our original charter called for “the expansion of human knowledge of phenomena in the atmosphere and space.” Our very first space missions uncovered surprises about Earth, and we’ve been using the vantage point of space to study our home planet ever since. Right now, we have a fleet of more than 20 spacecraft monitoring Earth and its systems.
Why we created our specific surface temperature record – known as GISTEMP – actually starts about 25 million miles away on the planet Venus. In the 1960s and 70s, researchers discovered that a thick atmosphere of clouds and carbon dioxide was responsible for Venus’ scorchingly hot temperatures.
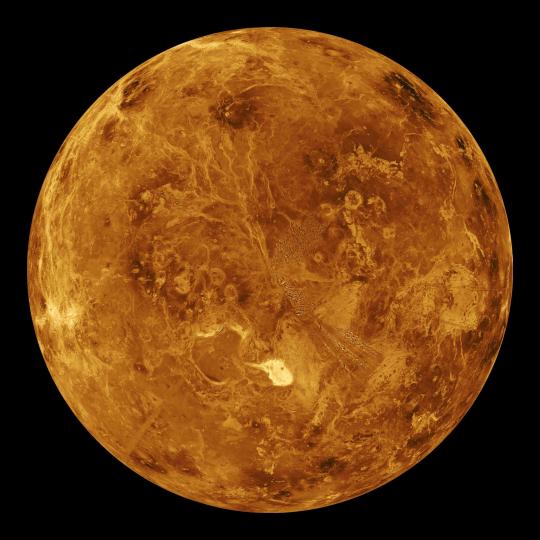
Dr. James Hansen was a scientist at the Goddard Institute for Space Studies in New York, studying Venus. He realized that the greenhouse effect cooking Venus’ surface could happen on Earth, too, especially as human activities were pumping carbon dioxide into our atmosphere.
He started creating computer models to see what would happen to Earth’s climate as more carbon dioxide entered the atmosphere. As he did, he needed a way to check his models – a record of temperatures at Earth’s surface over time, to see if the planet was indeed warming along with increased atmospheric carbon. It was, and is, and NASA’s temperature record was born.
5. If last year was record hot, why wasn’t it very hot where I live?
The temperature record is a global average, so not everywhere on Earth experienced record heat. Local differences in weather patterns can influence individual locations to be hotter or colder than the globe overall, but when we average it out, 2023 was the hottest year.
Just because you didn’t feel record heat this year, doesn’t mean you didn’t experience the effects of a warming climate. 2023 saw a busy Atlantic hurricane season, low Arctic sea ice, raging wildfires in Canada, heat waves in the U.S. and Australia, and more.
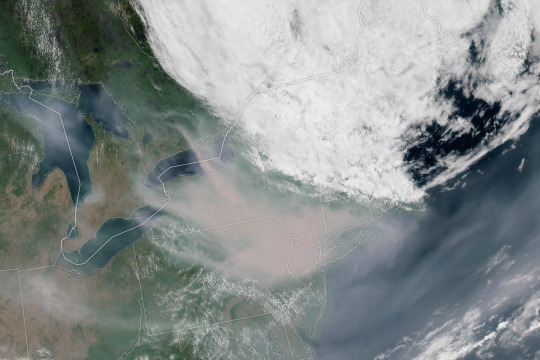
And these effects don’t stay in one place. For example, unusually hot and intense fires in Canada sent smoke swirling across the entire North American continent, triggering some of the worst air quality in decades in many American cities. Melting ice at Earth’s poles drives rising sea levels on coasts thousands of miles away.

6. Speaking of which, why is the Arctic – one of the coldest places on Earth – red on this temperature map?
Our global temperature record doesn’t actually track absolute temperatures. Instead, we track temperature anomalies, which are basically just deviations from the norm. Our baseline is an average of the temperatures from 1951-1980, and we compare how much Earth’s temperature has changed since then.
Why focus on anomalies, rather than absolutes? Let’s say you want to track if apples these days are generally larger, smaller, or the same size as they were 20 years ago. In other words, you want to track the change over time.
Apples grown in Florida are generally larger than apples grown in Alaska. Like, in real life, how Floridian temperatures are generally much higher than Alaskan temperatures. So how do you track the change in apple sizes from apples grown all over the world while still accounting for their different baseline weights?
By focusing on the difference within each area rather than the absolute weights. So in our map, the Arctic isn’t red because it’s hotter than Bermuda. It’s red because it’s gotten relatively much warmer than Bermuda has in the same time frame.
Want to learn more about climate change? Dig into the data at climate.nasa.gov.
Make sure to follow us on Tumblr for your regular dose of space!
3K notes
·
View notes
Text
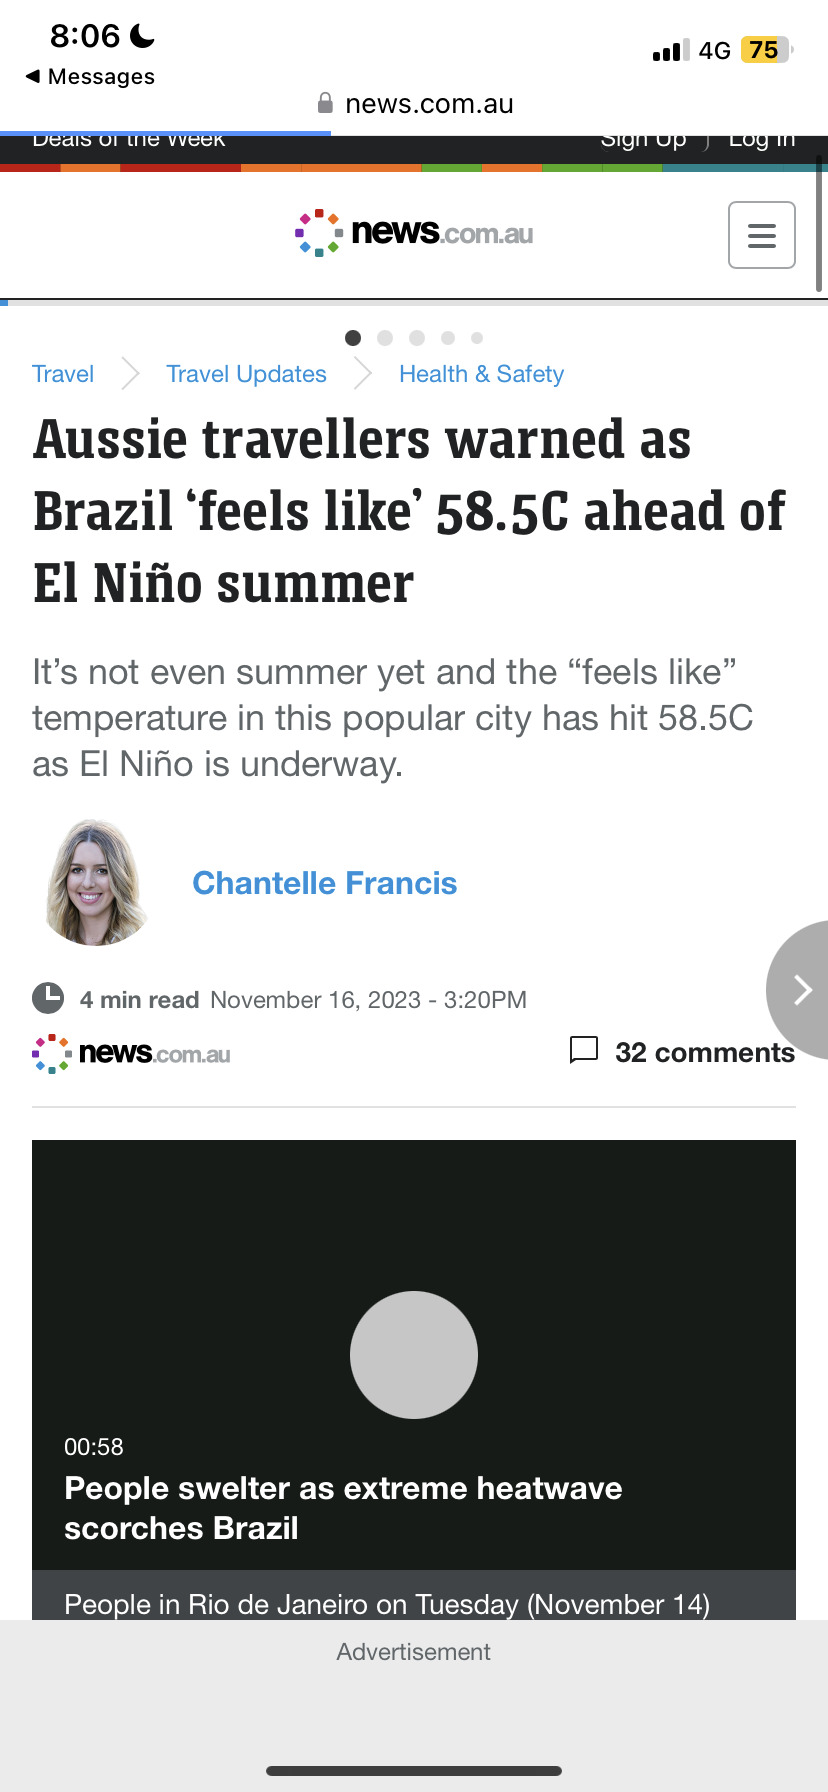
Just in case you aren’t all aware. This isn’t fucking normal. This doesn’t happen. This is climate change causing extreme weather events to happen more frequently and with more power.
Be aware and stay safe. Do what you can to help!
783 notes
·
View notes
Text

Zuzu in the eyes of uncle Iroh
#avatar the last airbender#zuko#illustration#turtleduck zuko#dianorayasiri#digital art#artists on tumblr#atla#prince zuko#el niño#zuzu
101 notes
·
View notes
Text

Day 17 of Fatuitober!
what that cat doin'?
#fatuitober2023#genshin impact#genshin fanart#genshin impact fanart#fanart#doodles#scaramouche#scarameow#EL NIÑO#LA CREATURA EVEN
271 notes
·
View notes
Text

#illustration#asiriyep#fire lord zuko#zuko#atla#avatar the last airbender#avatar the legend of aang#el niño#monochrome#monochromatic#atla zuko
372 notes
·
View notes
Text
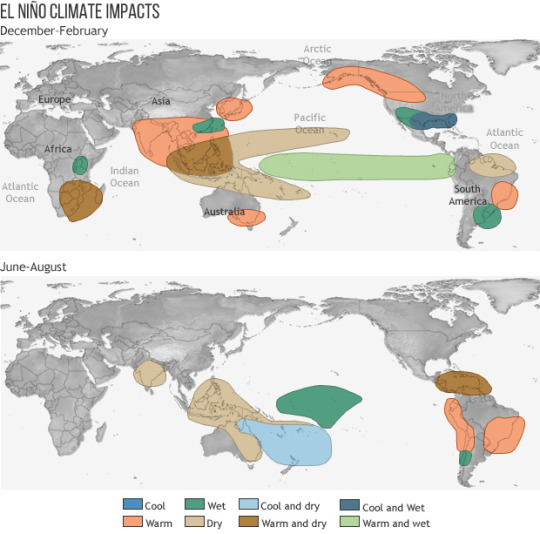
So, let's take a moment to talk about La Niña & El Niño for a moment, and what we might want to keep in mind (I'm sure others will have more input).
The past 3 years have been La Niña years, which for my area means we should have been cooler & wetter than normal. We have, instead, had some very hot and very dry periods, among some times of weather that used to be normal. Here's an image that shows the general trend for different areas:

Now, instead of a neutral year, it looks like we'll be swinging into an El Niño year around August. Or at least that's the current prediction (as of when I was writing this). Here's the general effects of an El Niño year:
So, I'm concerned. I'm concerned because the hottest year on record here happened in a La Nina year. What will this year look like? What will next year?
They're almost certainly going to be hotter, and drier than previous years. It's time to start thinking about what you can do to prepare, if you haven't already. There's lots of good posts that have gone around, so if you haven't already read and applied them, now might be a good time to start. Do what you can, and help others as you can. Find out what resources exist in your community, and use them and/or support them.
If you're living in one of the areas that's been experiencing extreme heat already, what's your plan? Where are you going to go, what are you going to do when it's too hot?
If you live somewhere with wildfires, plan your evacuation routes, and have a pack ready to go. For nearby areas, how are you going to deal with the wildfire smoke? My go to has been the box fan + furnace air filter, and it's worked great.
Just, please, take care of yourselves and your communities as much as you can.
464 notes
·
View notes
Text
even on opposite teams he clung to him🥹🤧
tiktok cred: @choithing
#sorry im in my torres and sergio feels#sergio ramos#fernando torres#la roja#real madrid#atletico madrid#el capitán#el niño
173 notes
·
View notes
Text
A strong El Niño event is going to wreak havoc on global surface temperature and trigger several climate crises in 2023–2024, according to researchers from the Institute of Atmospheric Physics (IAP) of the Chinese Academy of Sciences.
The El Niño event, known for releasing massive heat into the atmosphere, is poised to change atmospheric circulation patterns, influence tropical-extratropical interactions, and impact subtropical jets, monsoons, and even polar vortices, and finally results in a rapid surge in Global Mean Surface Temperature (GMST).
The study was published in The Innovation Geoscience on Sept. 15.
Continue Reading.
82 notes
·
View notes
Text
1582- Yo te miro, yo te miro sin cansarme de mirar y que lindo niño veo a tus ojos asomar.
(Gabriela Mistral)
#palabras#frases#textos#textos nocturnos#pensamientos#vida#culture#books & libraries#escritos de amor#amor#niños#el niño#ojos hermosos#ojos#tus ojos#poema#notas#poesia#Gabriela Mistral
24 notes
·
View notes

Text

#zuko#illustration#azula#dianorayasiri#avatar the last airbender#atla azula#atla#atla zuko#prince zuko#cookierun#cherry cookie#digital art#art#artists on tumblr#el niño#princess azula
49 notes
·
View notes
Text

Day 15 of Fatuitober!
#fatuitober2023#genshin impact#genshin fanart#genshin impact fanart#fanart#tartaglia#childe#MY WIWI#EL NIÑO#LOVE HIM#me drawing tartaglia again for fatuitober?? yes actually#more likely than you think
197 notes
·
View notes
Text

Fanart of fanfic “A Peach for Every I Love You Unsaid, A Cherry Tree Nurtered Where the Pain Used to Be” by "Des 98"!!
Medicine for the day 💛❤️🩹.
#atla#illustration#asiriyep#zuko#prince zuko#avatar the last airbender#avatar the legend of aang#el niño#zuko fanart#avatar#ao3#fafiction#zuzu#style
102 notes
·
View notes
Note
Starbs how are you holding up with the heat wave? I am dying of dead
I heard temperatures were dangerously high in some parts of the country. It has been raining for a few days where I live, and it's currently 20°C, so it's not that bad
36 notes
·
View notes
Text
idk if being sick is killing my brain cells but im so stuck on this image of nando

#he's just so😩😩#who ever the photographer was needs a raise and my first born child#fernando torres#el niño#liverpool fc#lfc
86 notes
·
View notes
Last Seen Blogs

ericwuuuuuuu
Whoa!


bouwrites
Bou's Writing Blog

marhawa-desire
Icons + Headers

meriendilla
cómo va esto