#britishlibrary
Photo
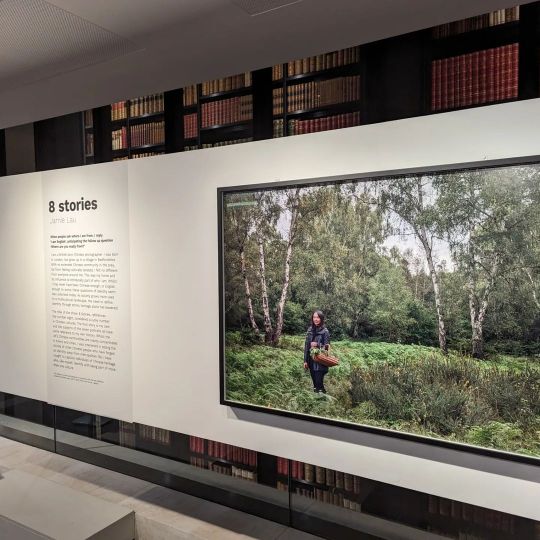
What does it mean to be Chinese 🇭🇰 🇹🇼 and British 🇬🇧 ? This display of photographs by Jamie Lau offers us eight unique answers to this question. Lau was born in London and grew up in rural Bedfordshire with no extended Chinese community around him. Whilst the UK’s Chinese community is mostly based in towns and cities, in this series Lau introduces us to seven other Chinese and British individuals and what they love about countryside life. Meet artist Qu Lei Lei, who forages for wood for his sculptures on the forest floor. Hear from Ruby Peng who grew up in #singapore 🇸🇬 but is fascinated by the slow pace of countryside living. Discover what Reverend Mark Nam makes of the typically English phrase ‘More tea, Vicar?’ In 2014 Jamie Lau was commissioned by Open Eye Gallery to produce Ebb and Flow, a photographic series on Liverpool’s Chinatown, an abstract study of the architecture and people that make up the oldest Chinatown in Europe. The project had particular relevance to Jamie with his Grandfather having passed through the city as a sailor in the 1890s en route from Hong Kong. 8 Stories develops his interest in merging cultures. Learn more about the history of the #chinese community in the UK and hear stories of the remarkable individuals who have lived through it in our free exhibition Chinese and British, open until Sunday 23 April 2023. #hongkong 🇭🇰 #taiwan 🇹🇼 #macau 🇲🇴 #china 🇨🇳 #britishlibrary (à The British Library) https://www.instagram.com/p/Cp7MAzKrMDU/?igshid=NGJjMDIxMWI=
1 note
·
View note
Photo
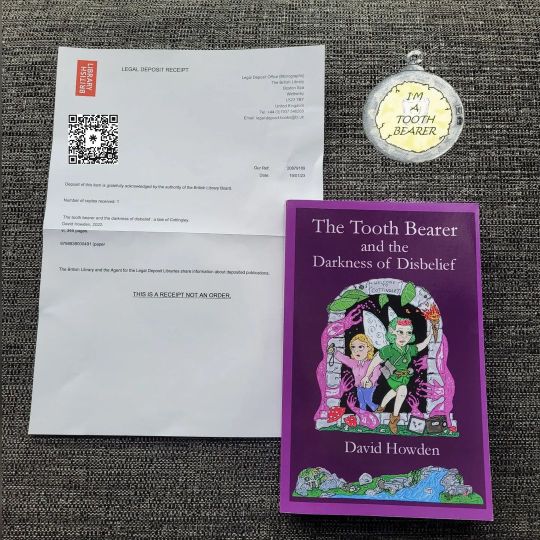
I love getting these letters from The British Library after all the hard work writing and illustrating. It's a great feeling and honour in the UK to know that your book is being stored for the nation and will be there long after you've gone. You can have your copy as well, in either paperback, eBook or on KU. Links in bio. Thank you to all that have supported me in this endeavour. #britishlibrary #thetoothbearer #fairies #fairiesofinstagram #cottingleyfairy #kidsbookrecommendations #childrensbookrecommendation #childrensbooks #buythisbook #bookrecommendations #booksofinstagram #booktok https://www.instagram.com/p/Cn_x5IxqzQn/?igshid=NGJjMDIxMWI=
#britishlibrary#thetoothbearer#fairies#fairiesofinstagram#cottingleyfairy#kidsbookrecommendations#childrensbookrecommendation#childrensbooks#buythisbook#bookrecommendations#booksofinstagram#booktok
0 notes
Photo

1st research week at the British Library for SHELTER (part of my @aceagrams funding) & feeling very lucky. Having access to such a wealth of books, articles and audio & visual references is a genuine gift. It’s also free to be a @britishlibrary reader. As are the snazzy lockers. I highly recommend joining. Especially if you’re researching a story. Not to mention the surprise of an early printing press next to the loos for good measure. Today’s reference: Womens Lib 1970, Westway Travellers, Celtic Folk Magic & Witch’s familiars Monday’s was the Newsroom (not pictured) reading microfilm of newspapers from 1970. I can confirm The Sun was as vacuous as ever. Very intrigued by some Evening News stories so more to delve into. #britishlibrary #britishlibrarylondon #research #comiccreator #acegrams #artscouncilengland #acefunded #dycpgrant #shelter #shelterthecomic #shelterearlydoors https://www.instagram.com/p/CnUzQ9bso3q/?igshid=NGJjMDIxMWI=
#britishlibrary#britishlibrarylondon#research#comiccreator#acegrams#artscouncilengland#acefunded#dycpgrant#shelter#shelterthecomic#shelterearlydoors
1 note
·
View note
Photo
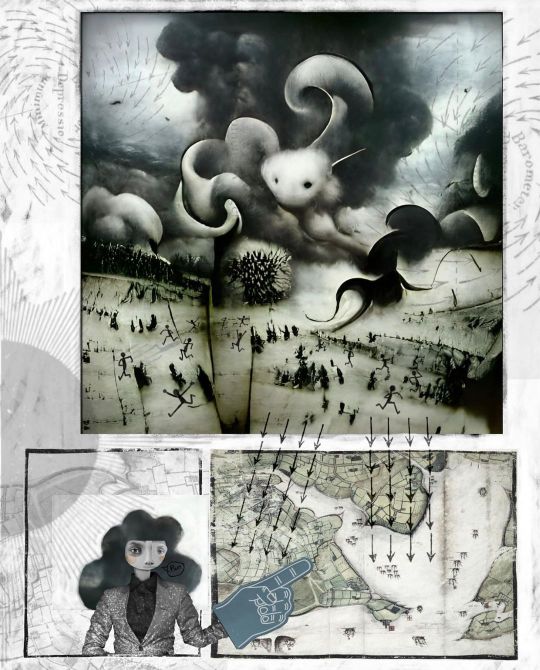
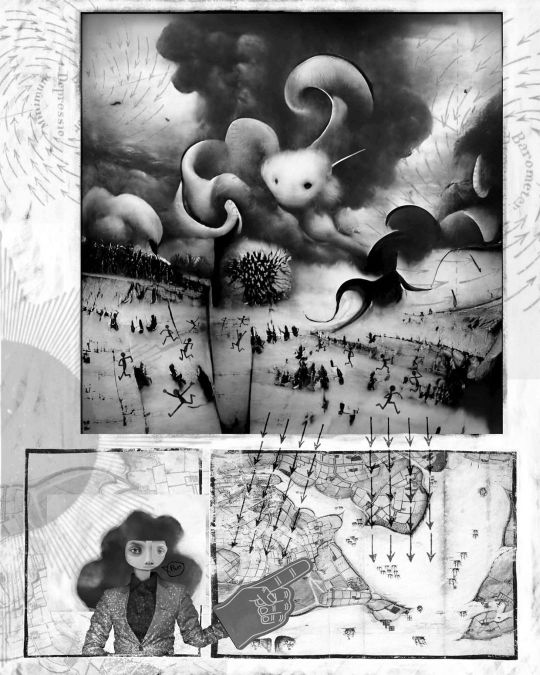
Forecast. Decided it needed some colour. #digitalcollage #nightcafe @nightcafestudio #aiart #vqganclip #digitalart #collageillustration #illustration #digitalillustration #aiartwork #artist #artistsoninstagram #illustrationartists #illustratorsoninstagram #collage #collageart #britishlibrary #britishlibraryflickr https://www.instagram.com/p/CgKorkaDX_W/?igshid=NGJjMDIxMWI=
#digitalcollage#nightcafe#aiart#vqganclip#digitalart#collageillustration#illustration#digitalillustration#aiartwork#artist#artistsoninstagram#illustrationartists#illustratorsoninstagram#collage#collageart#britishlibrary#britishlibraryflickr
1 note
·
View note
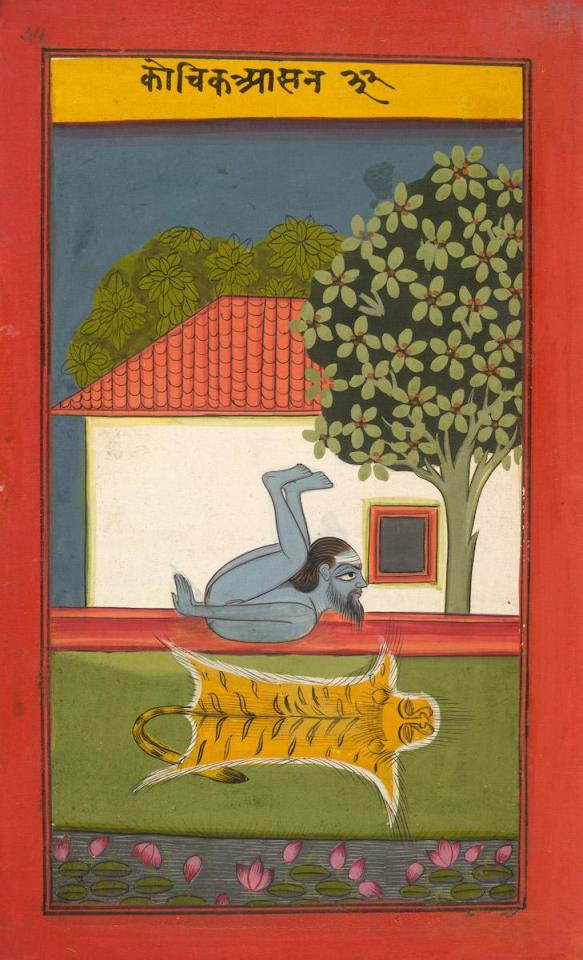
Photo
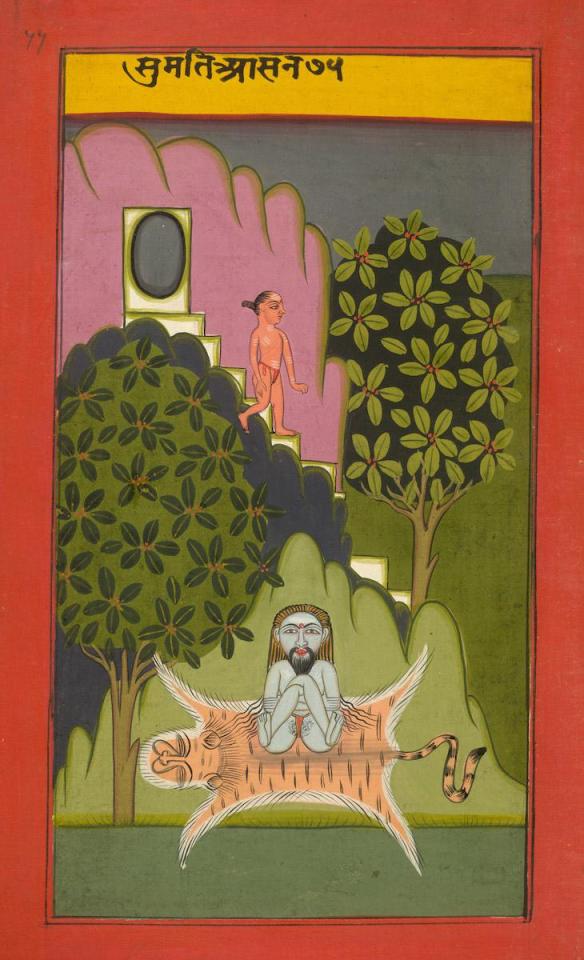


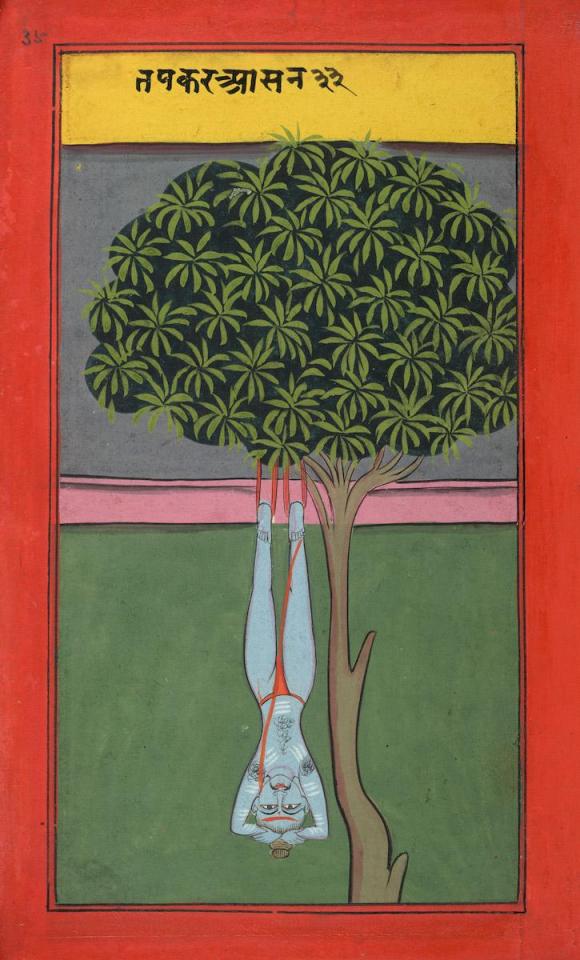
A few of the many wonderful images from an early 19th-century Indian manuscript detailing hatha yoga poses. More here: https://publicdomainreview.org/collection/hatha-yoga-images-from-the-joga-pradipika @britishlibrary
40 notes
·
View notes
Text
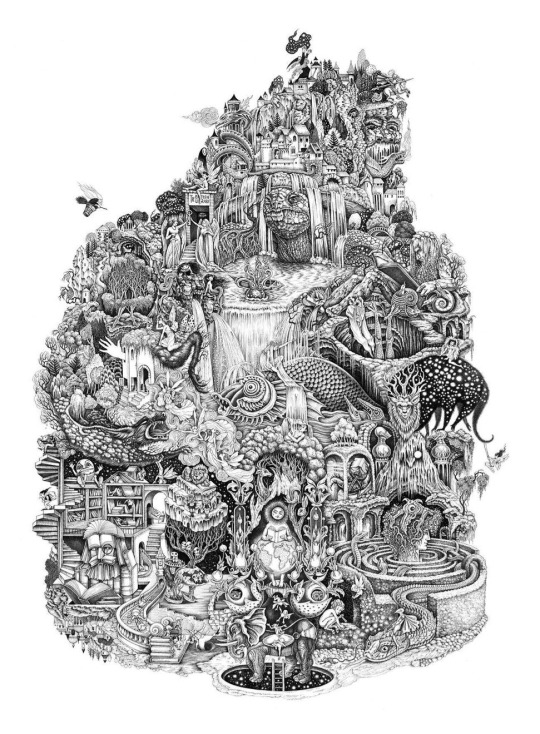
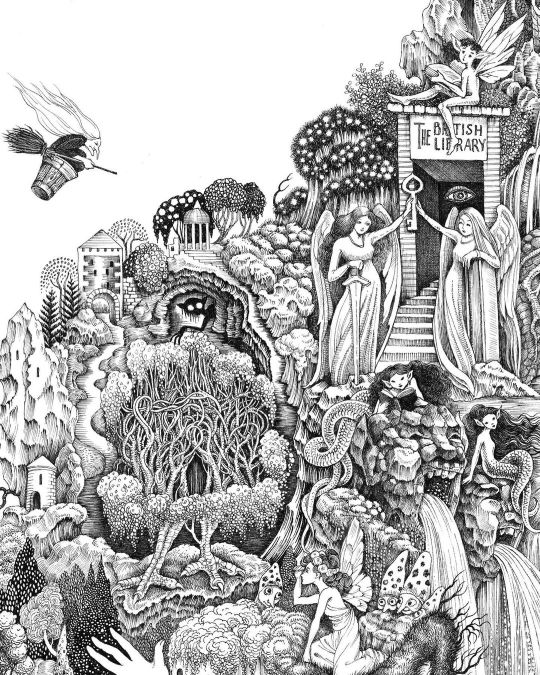
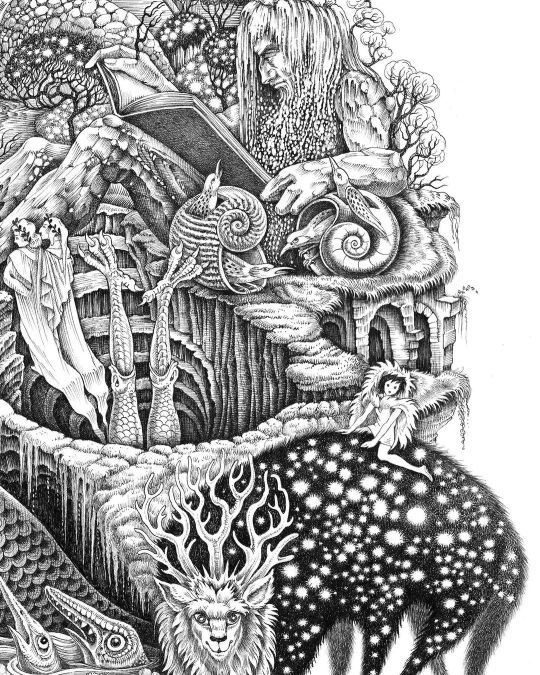
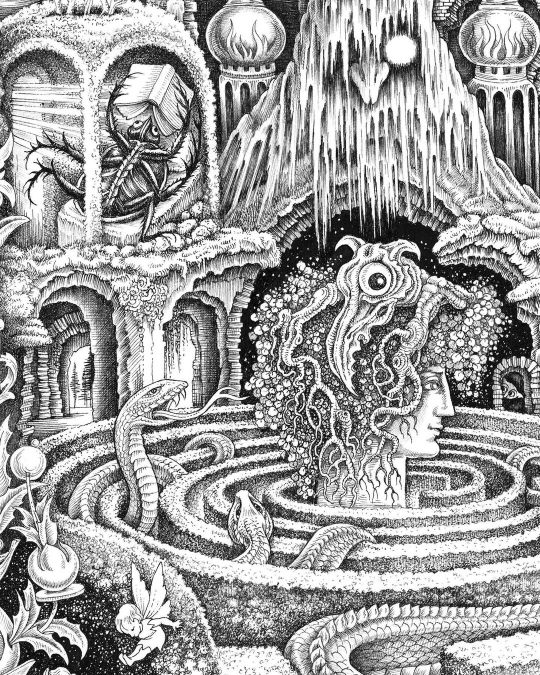
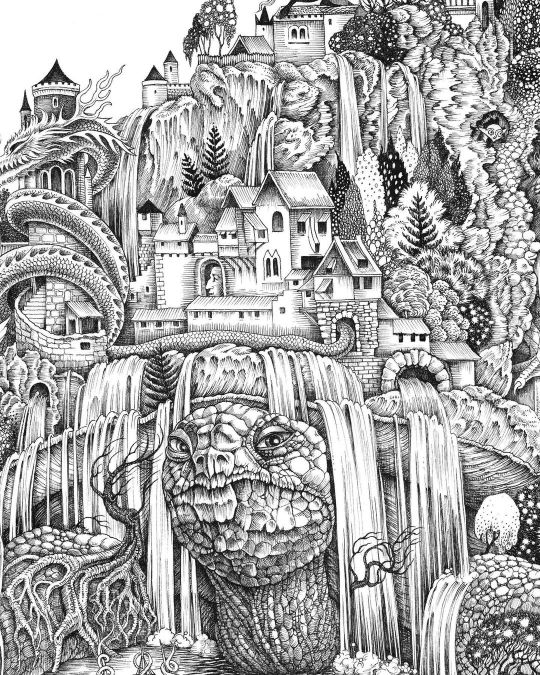
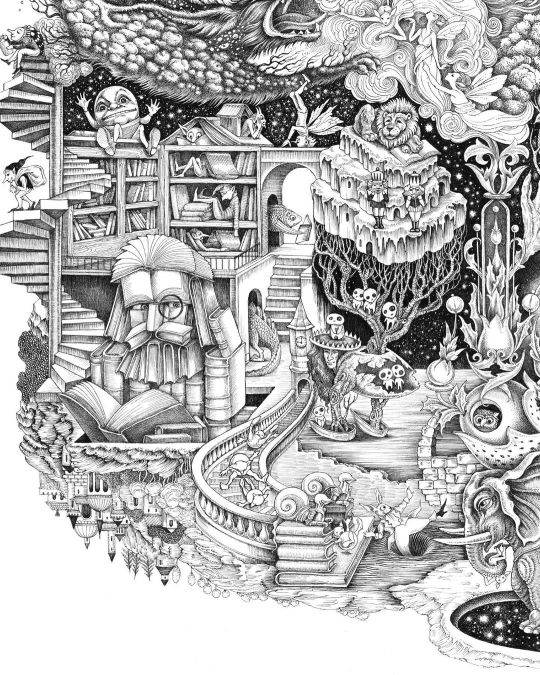
Sveta Dorosheva @britishlibrary
"Have you seen the incredible artwork for our exhibition, Fantasy: Realms of Imagination? Created by hand by illustrator Sveta Dorosheva, this artwork seamlessly weaves together the four realms of our exhibition: fairy tales and folklore, worlds and portals, epics and quests, weird and uncanny – each area populated with its own characters."
"There are over 65 references to the fantasy genre in this illustration, can you spot:
- The White Rabbit from Alice in Wonderland, tumbling down the rabbit hole
- Gollum, from The Lord of the Rings, lurking in a cave
- Gregor Samsa, reading a copy of Metamorphosis
- Princess Mononoke from Miyazaki’s film of the same name."
#sveta dorosheva#british library#fantasy literature#alice in wonderland#lotr#lord of the rings#princess mononoke#hayao miyazaki#b&w#b&w post
31 notes
·
View notes
Text
https://www.metmuseum.org/about-the-met/policies-and-documents/open-access
https://www.flickr.com/photos/britishlibrary/albums/
just learnt that these exist and thought others would find them useful too
5 notes
·
View notes
Text
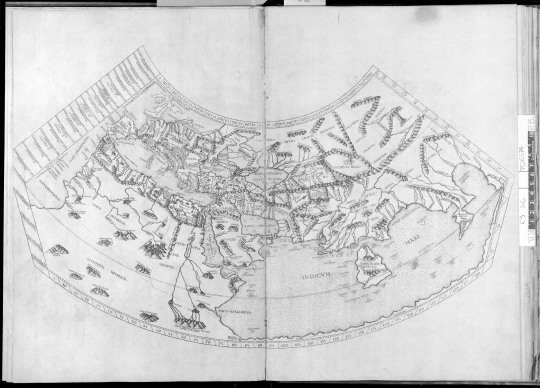
Ptolemy's (150 CE) world map 1478.
"The Ptolemy world map is a map of the world known to Greco-Roman societies in the 2nd century. It is based on the description contained in Ptolemy's book Geography, written c. 150. Based on an inscription in several of the earliest surviving manuscripts, it is traditionally credited to Agathodaemon of Alexandria.
Notable features of Ptolemy's map is the first use of longitudinal and latitudinal lines as well as specifying terrestrial locations by celestial observations. The Geography was translated from Greek into Arabic in the 9th century and played a role in the work of al-Khwārizmī before lapsing into obscurity. The idea of a global coordinate system revolutionized European geographical thought, however, and inspired more mathematical treatment of cartography.
Ptolemy's work probably originally came with maps, but none have been discovered. Instead, the present form of the map was reconstructed from Ptolemy's coordinates by Byzantine monks under the direction of Maximus Planudes shortly after 1295. It probably was not that of the original text, as it uses the less favored of the two alternate projections offered by Ptolemy.
The Geography of Ptolemy, with its world map and maps of individual regions, became immensely popular in western Europe once it had been translated from Greek into Latin at the beginning of the 15th century. Many manuscript copies survive and it was first printed (at first without maps) in 1475. This is the world map from the edition published at Rome in 1478. The strange shape of Scotland (top left) is one of the odder features of the Ptolemy maps."
-taken from BritishLibrary and Wikipedia
#ptolemy#ancient greece#roman empire#antiquities#history#ancient history#maps#2nd century#15th century
15 notes
·
View notes
Text
https://www.flickr.com/photos/britishlibrary/albums/72157638797895895
way cool tattoo and doodle ideas
3 notes
·
View notes
Photo
What is Magna Carta ? Get back in time to medieval England in 1215 under the reign of Bad King John. Why was the charter originally created? And what does it actually say? #magnacarta #london #britishlibrary (à The British Library) https://www.instagram.com/p/Cp7KkdtrDn1/?igshid=NGJjMDIxMWI=
0 notes
Video
britishlibrary: Fall, Leaves, Fall ~ Emily Brontë, extract
Fall, leaves, fall; die, flowers, away;
Lengthen night and shorten day;
Every leaf speaks bliss to me
Fluttering from the autumn tree.
Happy #AutumnEquinox ! 🍂
3 notes
·
View notes
Photo
Forecast. #digitalcollage #nightcafe @nightcafestudio #aiart #vqganclip #digitalart #collageillustration #illustration #digitalillustration #aiartwork #artist #artistsoninstagram #illustrationartists #collage #collageart #britishlibrary #britishlibraryflickr https://www.instagram.com/p/CgKL0iYjBmf/?igshid=NGJjMDIxMWI=
#digitalcollage#nightcafe#aiart#vqganclip#digitalart#collageillustration#illustration#digitalillustration#aiartwork#artist#artistsoninstagram#illustrationartists#collage#collageart#britishlibrary#britishlibraryflickr
0 notes
Text
British Library has been offline for three weeks
https://twitter.com/britishlibrary/status/1726618361398722754
0 notes
Photo

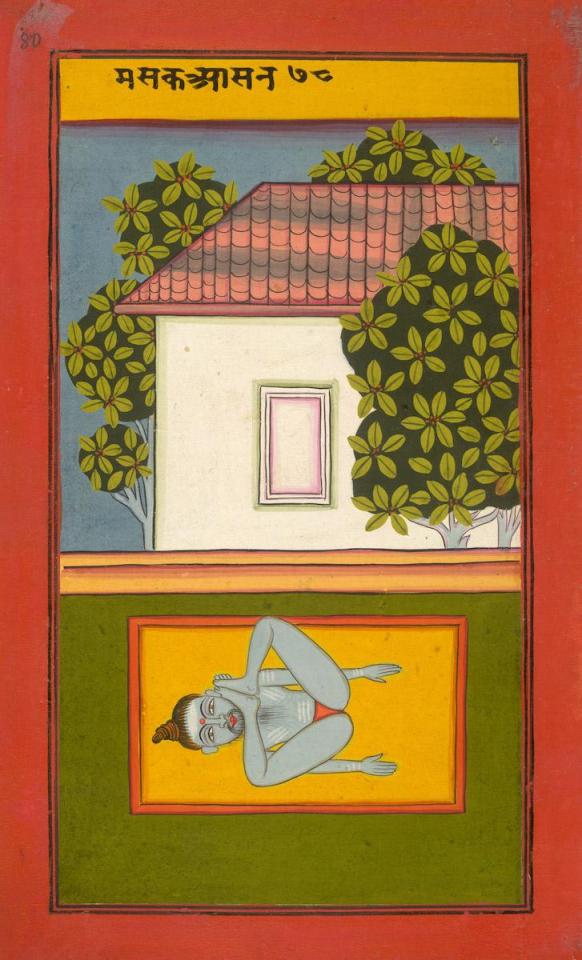

A few of the many wonderful images from an early 19th-century Indian manuscript detailing hatha yoga poses. More here: https://publicdomainreview.org/collection/hatha-yoga-images-from-the-joga-pradipika @britishlibrary
113 notes
·
View notes
Text
Diagrams, Plots, Charts, Waves
Library, B. (2013). British Library digitised image from page 91 of ‘Orient Line Guide ... Fourth edition, revised, with maps and plans. Edited .. by W. J. L’. [online] Flickr. Available at: https://www.flickr.com/photos/britishlibrary/11204471763/in/album-72157648088610908/ [Accessed 18 Oct. 2023].

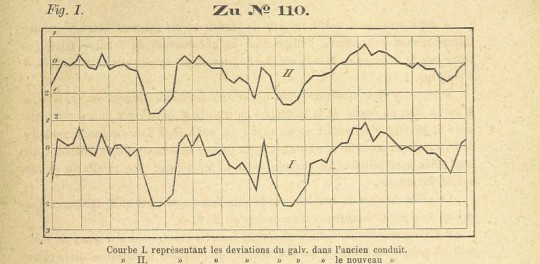
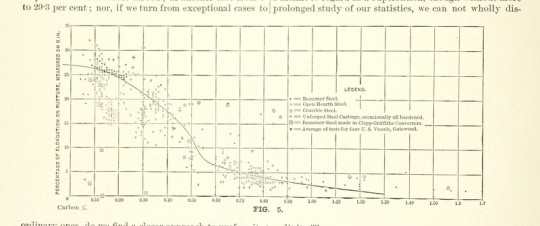
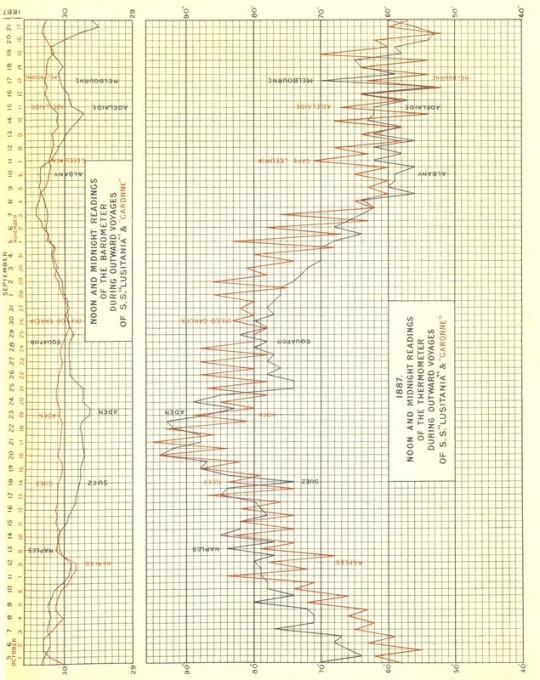
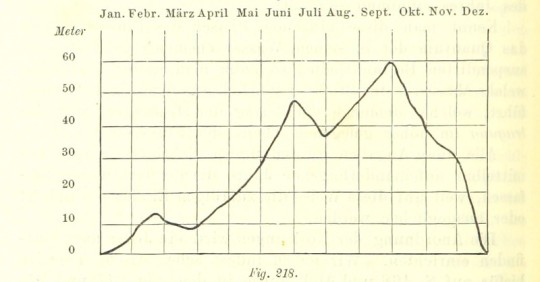
Diagrams often use lines to represent connections, processes, and relationships between elements. For example, flowcharts use arrows and lines to illustrate the flow of information or actions.
Plots and charts heavily rely on lines to plot data points and trends. Line graphs connect data points with lines to show how values change over a continuous variable. In bar charts, lines represent boundaries between different data categories.
Relating back to the brief, the concept of "linearity" can be explored in the context of how lines in diagrams, plots, and charts add to the visualisation of linear relationships or trends. Lines help us perceive patterns, correlations, and sequences in data.
The design choices made in the use of lines within these diagrams and very important. Line thickness, style, colour, and patterns can all impact the clarity of the diagrams, plots, and charts.
I don't really know where I can go with this but I find the visuals very interesting
0 notes
Last Seen Blogs

atd-sportscars-blog
ATD-Sportscars

caniusevpnonps5
Untitled

winsome09
Untitled

renaisty
No. You move.

imiadove
Imiadove