#Koppen climage scheme
Text


Once I had enough high-resolution climate data to work with, the final part of the Climate phase was the creation of maps with discrete climate zones, which I produced in both the Trewartha classification scheme, left, and the Köppen classification scheme, right.

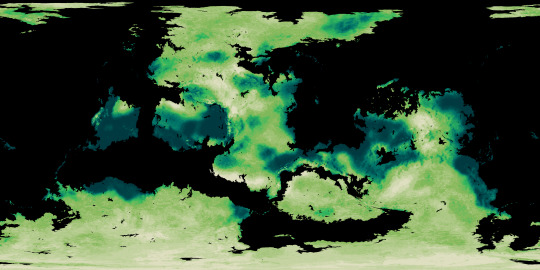

The final phase of the Ayrum mapmaking project was to create realistic satellite style maps, which began with mapping out soil colors and the ground cover of vegetation generally and tree-analogues specifically.
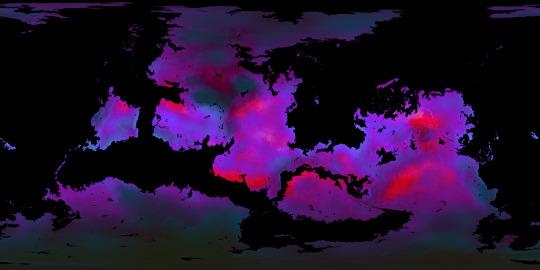
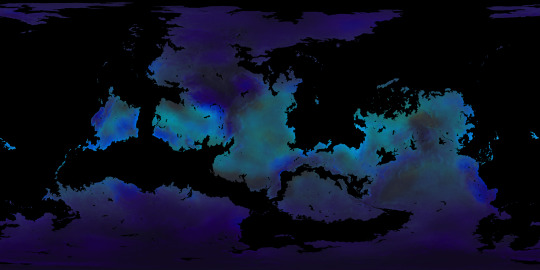
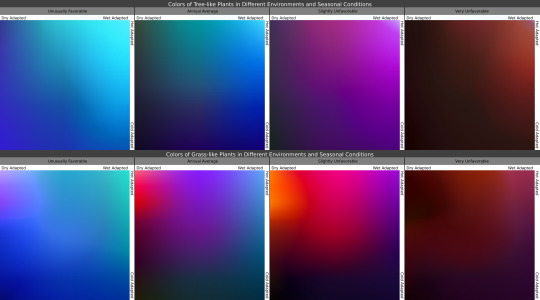
Once I knew where the plants belonged, I then determined what colors they'd be in the conditions they're adapted for, as seen in the maps, and under seasonal variation, with the chart showing how plants with certain adaptations react to seasonal changes in those conditions.

In these gifs we see the ground plants and tree canopies changing colors as the Solstices and Equinoxes expose them to greater or lesser rainfall and harsher or milder temperatures than what they're adapted for. Neither of these gifs provide a true image of what the surface looks like from space, but rather of the in-person appearance of whatever plants may be present.

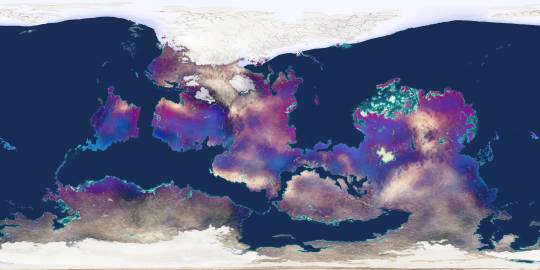
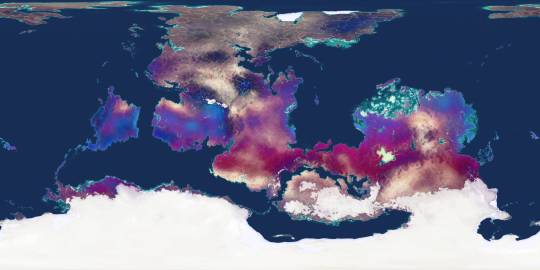
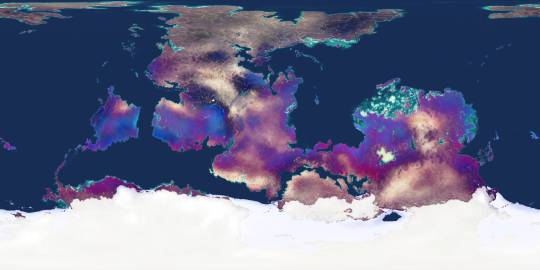
Finally, using the vegetation density maps as raster masks for the seasonal plant color maps, and layering those with the snow-and-ice maps over the soil color map, we now have a much truer image of Ayrum's surface as of its (Northern) Winter, Spring, Summer, and Autumn months.
#Ayrum#mapmaking#digital painting#imaginary maps#imaginary climate zone maps#Trewartha climate scheme#Koppen climage scheme#worldbuilding#commission#major project#seasonal data sequence#imaginary soil color maps#imaginary vegetation maps#vegetation extent#vegetation color#satellite-style maps#Photopea#Christopher Maida Artwork
49 notes
·
View notes
Last Seen Blogs

pagerunner-j
Page's Page

2000sfm
𝖳𝖧𝖤 𝟤𝟢𝟢𝟢𝗌 𝖢𝖮𝖱𝖤 .

thx-to-you
thanks to you

no-not-without-you-blog
Not Without You

twnsquall
LovingAiShinozaki