#macd live trading
Video
youtube
MACD Trading Tutorial Step-by-Step Guide for Beginners 2023
0 notes
Text
Wall Street Legend Yale Hirsch 100th!

Santa Claus Rally, January Barometer, Best Six Months Strategy: all invented by Yale! On what would be my father’s 100th birthday I am here to tell you market seasonality and the 4-year presidential election stock market cycle are alive and well. It is fitting that the 57th Annual Edition of the Stock Trader’s Almanac he founded in 1966 will be released tomorrow.
When he created the first 1968 edition he was ahead of his time. His iconic thinking and detailed analysis of historical stock market behavior and cycles in different political and economic environments was unmatched. He could probably have told you, within reason, what the stock market was likely to do any hour, on any day, in any future year. He put behavioral finance, market cycles and seasonality at the fingertips of traders, investors, and advisors and it has remained on the desks of top fund managers to this day.
We lost Yale two years ago at 98, but his legacy lives on. We are reminded of him every day when we track market cycles, patterns, and trends. Back in the 1969 Almanac he first warned us about October volatility and that October is the best time of the year to buy stocks. I have been buying recently after being on the sidelines since June. I carry this seasonal torch forward through the annual print edition and Almanac Investor Newsletter. Check out our latest trades at https://stocktradersalmanac.com/.
My 2010 Super Boom forecast for Dow 38820 by 2025 is based on his seminal work and discovery of the 500%+ market moves following war and inflation. In 1976 he predicted Dow 3420 by 1990.
This 2024 Almanac is a testament to the original iconic work founder Yale Hirsch created in the first 1968 edition and the over five decades of behavioral finance thought leadership it has provided since. The Almanac remains the most valuable trader’s desk reference on Wall Street and this year’s Almanac is packed with seasonal and historic investing insights for the year ahead including:
2024 Outlook – page 10
Bulls Win When Market Hits The January Trifecta – page 20
2024 Presidential Election Year Perspectives – page 26
Market Charts of Presidential Election Years – page 28
How the Government Manipulates the Economy to Stay in Power – page 32
Incumbent Party Wins & Losses – page 34
Only Two Losses Last 7 Months of Election Years – page 80
Traders Feast on Small Stocks Thanksgiving Through Santa Claus Rally – page 104
The Incredible January Barometer: Only 12 Significant Errors in 73 Years – page 18
“Best Six Months”: Still An Eye-Popping Strategy – page 54
MACD-Timing Triples “Best Six Months” Results – page 56
14 notes
·
View notes
Text
What Are Forex Signal Services?
In the ever-evolving world of forex trading,forex trading, staying ahead of the curve requires timely and accurate information. This is where forex signal services come into play. These services have become an indispensable tool for traders looking to maximize their profits while minimizing risks. In this blog post, we'll explore what forex signal services are, how they work, their benefits, and what to look for when choosing one.
What Are Forex Signal Services?
Forex signal services provide traders with recommendations on potential trading opportunities in the forex market. These signals can be generated by human analysts, automated trading systems, or a combination of both. They typically include key information such as the currency pair, entry price, stop-loss level, and take-profit level.
How Do Forex Signal Services Work?
1. Signal Generation : Signals are generated based on technical analysis, fundamental analysis, or a combination of both. Technical analysis involves studying historical price data and using indicators like moving averages, RSI, and MACD to predict future price movements. Fundamental analysis, on the other hand, focuses on economic news, interest rate changes, and other macroeconomic factors.
2. Signal Delivery : Once generated, signals are delivered to subscribers via various channels, including SMS, email, mobile apps, or dedicated trading platforms. The timeliness of these signals is crucial as forex markets move rapidly.
3 Execution : Traders can then decide to manually execute the trades based on the signals or use automated trading systems (also known as trading robots or Expert Advisors) that execute trades automatically.
Benefits of Using Forex Signal Services
1. Time-Saving : Analyzing the forex market requires time and expertise. Signal services save traders the effort by providing ready-made trading ideas.
2. Access to Expertise : Many signal providers employ experienced traders and analysts who offer insights that individual traders might not have.
3. Increased Trading Opportunities : Signal services can help traders identify more trading opportunities than they might find on their own.
4 Learning Tool : For novice traders, signals can serve as a learning tool, helping them understand market dynamics and trading strategies.
What to Look for in a Forex Signal ServiceForex Signal Service
1. Performance Record : Look for a provider with a verifiable track record of success. Past performance is not always indicative of future results, but it can provide some insight into the provider’s expertise.
2. Transparency : A good signal provider should be transparent about their trading strategies, the rationale behind their signals, and the risks involved.
3. Trial Periods and Money-Back Guarantees : Many reputable services offer trial periods or money-back guarantees. This allows you to test the service without a significant financial commitment.
4. Customer Support : Reliable customer support is crucial, especially if you’re new to forex trading forex trading. Look for providers that offer robust support via multiple channels.
5. Signal Frequency and Delivery : Consider how often signals are provided and how they are delivered. Ensure the service aligns with your trading style and schedule.
6. Cost : Signal services can range from free to very expensive. While it’s important not to choose solely based on price, ensure that the cost is justified by the quality and reliability of the signals.
Popular Forex Signal Services
1. ForexSignals.com : Known for its comprehensive approach, ForexSignals.com offers a combination of live trading sessions, educational resources, and trading signals.
2. Learn 2 Trade : Provides daily trading signals and market analysis, catering to both beginners and experienced traders.
3. 1000pip Builder : Offers high-performance signals with a strong focus on customer service and transparency.
4. MQL5 : A popular platform where traders can subscribe to signals from various providers, offering a wide range of strategies and performance levels.
Conclusion
Forex signal services Forex signal services can be a valuable tool for traders of all levels, providing insights and opportunities that might otherwise be missed. However, it’s important to choose a service that aligns with your trading goals and to remain vigilant about the risks involved in forex trading. By doing thorough research and selecting a reputable provider, you can enhance your trading strategy and increase your chances of success in the forex market.
Happy trading!
#forexsignals#investing#sales#marketing#forextrading#finance#forex#stock market#forex education#forex trading
0 notes
Text
Top Benefits of Using JRFX Trading Platform MT4?
The world of online trading is dynamic and competitive, requiring traders to be equipped with the best tools to succeed. One of the most trusted and popular platforms available is MetaTrader 4 (MT4). JRFX Trading Platform MT4 combines the robust features of MT4 with exceptional services, offering traders a superior experience. This article explores the top benefits of using JRFX Trading Platform MT4, highlighting how it can enhance your trading activities and help you achieve your financial goals.

User-Friendly Interface
1.1. Simplified Navigation
The JRFX Trading Platform MT4 is renowned for its user-friendly interface. Designed with both beginners and experienced traders in mind, the platform’s intuitive layout ensures that users can easily navigate through various features. This ease of use helps traders focus on their strategies rather than grappling with complex software.
1.2. Customizable Workspace
Customization is a key advantage of JRFX Trading Platform MT4. Traders can personalize their workspace by adjusting charts, adding indicators, and organizing tools to suit their trading style. This flexibility allows for a tailored trading environment that meets individual needs and preferences.
Advanced Analytical Tools
2.1. Comprehensive Charting
JRFX Trading Platform MT4 offers a wide array of chart types and timeframes, providing traders with the tools needed for detailed technical analysis. Whether you prefer line, bar, or candlestick charts, you can customize them to display various time periods and overlays, facilitating a deep analysis of market trends.
2.2. Diverse Technical Indicators
The platform includes a broad range of technical indicators, such as Moving Averages, MACD, and RSI, which are essential for making informed trading decisions. JRFX Trading Platform MT4 also supports the addition of custom indicators, allowing traders to utilize specialized tools tailored to their unique strategies.
2.3. Automated Trading with Expert Advisors
One of the standout features of MT4 is the support for Expert Advisors (EAs). JRFX Trading Platform MT4 allows traders to develop, test, and implement EAs for automated trading. This capability is invaluable for those who want to execute trades based on pre-set criteria, ensuring that opportunities are not missed even when they are not actively monitoring the markets.
Robust Security Measures
3.1. Secure Data and Transactions
Security is paramount in online trading, and JRFX Trading Platform MT4 takes this seriously. The platform uses advanced encryption protocols to protect users' data and transactions, ensuring that personal information and trading activities remain confidential and secure.
3.2. Reliable Data Protection
JRFX Trading Platform MT4 employs state-of-the-art security measures to safeguard user data. Secure servers and rigorous authentication processes ensure that traders' information is protected from unauthorized access, providing peace of mind.
Access to a Wide Range of Markets
4.1. Diverse Trading Instruments
With JRFX Trading Platform MT4, traders have access to a vast selection of trading instruments, including forex, commodities, indices, and cryptocurrencies. This variety allows for portfolio diversification, enabling traders to explore multiple market opportunities and manage risk effectively.
4.2. Real-Time Market Data
Accurate, real-time market data is crucial for effective trading. JRFX Trading Platform MT4 provides live quotes, news updates, and economic indicators, ensuring that traders have the latest information at their fingertips. This real-time data allows for timely and informed trading decisions.
Superior Customer Support
5.1. 24/7 Assistance
JRFX is committed to providing exceptional customer support. The platform offers 24/7 assistance to help traders with any issues or questions they may encounter. This constant availability ensures that traders can resolve problems quickly and efficiently, minimizing disruptions to their trading activities.
5.2. Educational Resources
In addition to customer support, JRFX Trading Platform MT4 provides a wealth of educational resources. These include webinars, tutorials, and detailed guides on various trading topics. By offering these resources, JRFX helps traders enhance their skills and knowledge, fostering a more informed and capable trading community.
Additional Features and Benefits
6.1. Mobile Trading
JRFX Trading Platform MT4 supports mobile trading, allowing users to manage their trades on the go. The mobile app offers the same functionalities as the desktop version, ensuring that traders can stay connected to the markets and execute trades from anywhere.
6.2. Fast and Reliable Execution
Efficient trade execution is crucial in the fast-paced trading environment. JRFX Trading Platform MT4 ensures low latency execution, which minimizes delays and slippage, allowing traders to capitalize on market opportunities as they arise.
Conclusion
JRFX ( https://www.jrfx.com/?804 ) Trading Platform MT4 stands out as a powerful and versatile tool for traders of all levels. Its user-friendly interface, advanced analytical tools, robust security measures, wide market access, and superior customer support make it an ideal choice for anyone looking to succeed in the financial markets. By integrating the robust capabilities of MT4 with JRFX's exceptional services, traders can optimize their strategies and achieve their investment goals.
With JRFX, you gain more than just a trading platform; you gain a partner committed to your success. Experience the top benefits of trading with JRFX Trading Platform MT4 and take your trading to new heights.
0 notes
Text
03/04
I really miss living by the sea. I miss seeing it, and hearing it, and feeling it, wading out into the water waist deep when I was overwhelmed. I miss playing in the water, like children, I miss throwing frisbees with strangers, I miss the swans that would wander in. I miss shouting "it's alright once you get your shoulders in", even if it wasn't, because it was February. I miss the sea walls from Silver Steps to Castle to Gylly, all the wildflowers pressed in my notebook. I miss paddling the board against the current in the passage, until our arms hurt so bad, because there was no other way home. I miss being awful with the waboba. I miss drying off in front of a firepit, bats flying around our heads.
I miss posing for artists by hobby, sailors by trade, reclining on an afghan rug in a stone cottage somewhere, fire gently burning my bare back and all. I miss the way they could never quite get my profile right, laughing, chalking it all up to my Polish features, the 'M' shaped mouth. I miss their records, their catch-of-the-day supper, the Kenyan masks. I miss painting pottery, because what else was there to do?
I miss having nothing to do.
I miss having nothing to do, but maybe see the subtropical plants that held up in the mild climate, go to Cornish Bakery, get robbed by a seagull, go to Stone's Bakery for reparations.
I miss being able to be bad at cooking, because it was just my luck, everyone I loved lived in the kitchen. I miss huddling under a big umbrella, giggling because we always had to get the lighter back out, put out by the perpetual sea wind. I miss our repurposed churches; the squat, the cinema with the big stained glass, the drawing studio. I miss every stupid face from MACD, even if half of them couldn't form an academic argument to save their life. I miss "I jest", the true renaissance man, good at most things and bad only at those he didn't feel were worth pursuing.
I used to dream about the sea almost every day then. I could cry thinking about it.
1 note
·
View note
Text
Unlocking the Power of CFD Trading Signals: Your Pathway to Financial Success
Being ahead of the curve is essential for success in today's hectic financial markets. Finding profitable opportunities in the world of finance can be facilitated by having a solid understanding of CFD (Contracts for Difference) trading signals, regardless of experience level. We'll explore what CFD trading signals are, how they operate, and how you can use them to make wise trading selections in this post.
What are CFD Trading Signals?
Let's first review the definition of CFDs before getting into the specifics of CFD trading signals. Without holding the underlying assets, traders can speculate on the price movements of a variety of financial instruments, including stocks, indices, currencies, and commodities, using CFDs, or contracts for difference. Rather, contracts between traders and brokers are dependent on how much these assets' prices shift.
Traders employ CFD trading signals, sometimes referred to as trading indicators or alerts, as tools to find possible trading opportunities in the market. Technical analysis, which forecasts future price movements by examining previous price data, volume, and other market variables, is the method used to generate these signals.
To Becoming a Great Trader JOIN NOW
How Do CFD Trading Signals Work?
There are several ways to develop CFD trading signals using technical analysis, such as:
Moving Averages: This technique computes an asset's average price over a given time frame. Moving averages are a tool used by traders to spot trends and possible entry and exit points.
The momentum oscillator known as the Relative Strength Index (RSI) gauges the rate and direction of price changes. It aids traders in determining if the market is overbought or oversold.
Moving Average Convergence Divergence, or MACD, is a momentum indicator that follows trends and displays the relationship between two moving averages of the price of an asset. MACD is a tool used by traders to spot momentum shifts and possible trend reversals.
A moving average and two standard deviations shown above and below the moving average make up a Bollinger Band.
Bollinger Bands are a tool used by traders to pinpoint volatility and possible price breakouts.
These are but a handful of the numerous technical indicators that are employed to produce trading indications for CFDs. In order to improve the precision of their signals, traders frequently blend many indicators.
Utilizing CFD Trading Signals
After learning about CFD trading signals and their operation, let's look at how you may use them to make wise trading decisions:
Finding Trends: CFD trading signals can assist you in determining the direction of market trends, whether they are bearish (downward) or bullish (upward). You can raise your chances of generating good transactions by trading in line with the trend.
Timing Entry and Exit Points: You can improve the timing of your entry and exit points by using CFD trading signals. For example, you might think about going long (buying) if a signal suggests that an asset is oversold. On the other hand, if a signal indicates that an asset is overbought, you might want to think about closing a long position or perhaps going short (selling).
Controlling Risk: A key component of profitable trading is effective risk management. By establishing stop-loss and take-profit levels in response to the signals given, CFD trading signals can assist you in risk management. This enables you to lock in earnings and reduce possible losses.
Backtesting and Optimization: It's crucial to backtest and optimize a CFD trading signal against previous data before depending on it.
This aids in confirming the signal's efficacy and optimizing its settings for improved live trading performance.
Conclusion
To sum up, CFD trading signals are useful instruments that traders can use to negotiate the intricacies of the financial markets. You may enhance trading results and raise your chances of success by learning how these signals function and how to use them wisely. But it's crucial to keep in mind that no trading signal is infallible, so while trading CFDs, you should always do your homework and proceed with caution. On your path to financial success, CFD trading signals can be a potent ally if you have the appropriate information and approach.
To Becoming a Great Trader: JOIN NOW
#TRADING #CFD TRADING# CFD TRADING SIGNAL
0 notes
Text
Beyond All-Time Highs: FetchAI Surges with Analysts Highlighting Bullish Momentum
FetchAI, the blockchain-based platform, has sent waves through the cryptocurrency market as it surges to new all-time highs, breaking key resistance levels. Expert analysts, including Rekt Capital and CryptoTony, have weighed in on FetchAI's impressive performance, providing valuable insights into the token's current trajectory.
Rekt Capital's analysis underscores FetchAI's significant breakthrough, with the token surpassing its previous all-time high of $1.19 and currently trading above the $1.60 mark. This achievement signals a robust bullish sentiment and indicates the potential for further upward movement in FetchAI's price.
CryptoTony's observations further emphasize FetchAI's remarkable gains, highlighting a staggering 180% increase since identifying a strategic re-entry point at $0.60. This sustained uptrend not only showcases FetchAI's growing fundamentals but also reflects a heightened confidence in the token's market dynamics.
FetchAI's weekly surge of 16%, culminating in a new peak at $1.65, aligns with a broader bullish pattern observed on its chart. This positive momentum coincides with Bitcoin's recent surge to $64,000, creating a favorable market environment for cryptocurrencies.
As of the latest data, FetchAI is trading at $1.68, representing a 19.61% increase over the past 24 hours. While the trading volume has decreased by over 10%, standing at $496 million in 24 hours, FetchAI currently holds the 70th position on CoinMarketCap rankings, boasting a live market capitalization of $1.3 billion.
Technical indicators for FetchAI present an optimistic picture, with the Relative Strength Index (RSI) slightly above 70, indicating overbought conditions with a bullish sentiment. The Chaikin Money Flow (CMF) index sits at 0.33, suggesting a positive trend.
The Moving Average Convergence Divergence (MACD) adds further weight to the bullish sentiment, displaying a bullish trend with a green histogram and the MACD line positioned above the signal line.
FetchAI's impressive surge, breaking through all-time highs and supported by expert analysis, showcases a robust bullish momentum. The positive technical indicators and alignment with broader market trends suggest the potential for further gains. However, traders are advised to exercise caution as the RSI indicates overbought conditions, hinting at a potential price correction.
0 notes
Text
Bitcoin's Positive Sentiments as Analyst Identifies Path to $80,000

Bitcoin (BTC) is experiencing positive sentiments as it reclaims the $48,000 mark for the first time since the launch of the spot exchange-traded fund (ETF). Investors are now hopeful that it will retest the $50,000 level, which is considered crucial for triggering a new bull run. Analyst Alan Santana has outlined a possible path for Bitcoin to reach a new record high of $80,000, citing a shift toward a bullish trend indicated by the daily Bitcoin Moving Average Convergence Divergence (MACD).
One positive observation is the successful breach of a local down-trendline originating from its December 2023 peak, which indicates a potential reversal of the previous bearish momentum. Santana believes that the trend is now upward, showing Bitcoin's resilience in the market. Bitcoin is currently facing resistance around the 0.786 Fibonacci extension, and its ability to overcome this obstacle is crucial for further advancement.
If Bitcoin faces a downturn, Santana predicts it could temporarily stop in the $30,000 - $34,000 range before potentially dropping to $27,000. However, he cautions that this rebound could be short-lived, with Bitcoin potentially descending to $22,000. Despite these potential challenges, the overall sentiment for Bitcoin is positive as investors anticipate a sustained rally.
Read the original article
💰💰️️
Bitcoin BTC cryptocurrency bitcoinrally
0 notes
Text
Shiba Inu's Potential Upward Momentum: TD Sequential Indicates a Target of $0.011
Shiba Inu, the cryptocurrency known for its playful canine branding, is not just making headlines for potential price surges but also for its strides in blockchain innovation. The recent introduction of Shibarium, a key component in Shiba Inu's ecosystem, offers users a seamless method to bridge BONE tokens, contributing to the enhancement of its blockchain infrastructure.
The Shibarium network has unveiled an uncomplicated process for users looking to diversify their digital assets by bridging BONE tokens. The steps are user-friendly, starting with the assurance that users have BONE tokens in their wallets. By visiting the official Shibarium website, users can connect their digital wallets effortlessly, choose the BONE token, specify the desired amount for bridging, and initiate the transfer. The result is a secure and efficient migration of tokens to the Shibarium network, typically completed within a 20-minute timeframe.
This development aligns with the broader trend in the digital currency landscape, emphasizing the importance of blockchain diversity and interoperability. As Shiba Inu enthusiasts eagerly explore these opportunities, the Shibarium integration underscores the project's commitment to staying at the forefront of innovation.
Shiba Inu's market trajectory, while recently experiencing a minor dip with a reported price of $0.000009099, remains resilient. The 2.26 percent decrease over the past 24 hours and fluctuations between $0.000009 and $0.0000085 indicate an ongoing market battle. However, the substantial trading volume of $98 billion within the same period reflects a sustained interest in SHIB, showcasing its prominence in the cryptocurrency market.
Ranked 16th on CoinMarketCap with a live market capitalization of $5.34 billion, Shiba Inu continues to capture attention. The ongoing dynamics between bullish and bearish sentiments contribute to its significance for market analysts and investors.
Technical analysis provides additional insights, indicating a leaning toward a bearish trend. The RSI, currently at a neutral level of 45 but approaching oversold territory, suggests a growing bearish sentiment. While various technical indicators currently point to a neutral market stance, the MACD signals a potential negative trend in the near future.
As Shiba Inu enthusiasts navigate both potential price surges and blockchain advancements, the cryptocurrency's journey unfolds within the broader context of an evolving digital landscape. Shibarium's integration stands as a testament to Shiba Inu's commitment to providing a diverse and innovative blockchain experience for its community.
0 notes
Video
youtube
⭐ Olymp Trade Live Trading - Binary Options Signal - MACD Indicator 💹
#youtube#olymptrade#olymp trade#ultimatefxtools#binaryoptions#livetrading#macdsignals#olymptradelivetrading#olymptradereal
0 notes
Text
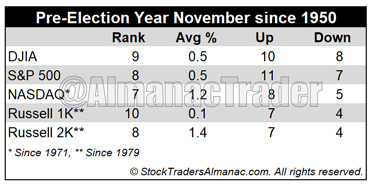
November Almanac: Historically a Top Month, But Softer in Pre-Election Years
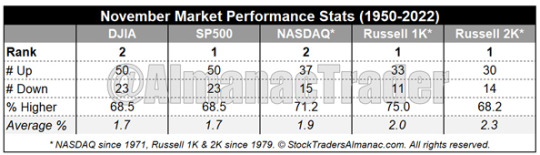
November begins the “Best Six Months” for the DJIA and S&P 500, and the “Best Eight Months” for NASDAQ. Small caps come into favor during November, but don’t really take off until the last two weeks of the year. November is the number-two DJIA and NASDAQ (since 1971) month. November is best for S&P 500 (since 1950), Russell 1000 (since 1979), and Russell 2000 (since 1979). Average performance in all year ranges from 1.7% from DJIA and S&P 500 to a solid 2.3% by Russell 2000.
In pre-election years, November’s performance is noticeably weaker. DJIA has advanced in 10 of the last 18 pre-election years since 1950 with an average gain of 0.5%. S&P 500 has been up in 11 of the past 18 pre-election years, also gaining on average a rather paltry 0.5%. Small-caps and techs perform better with Russell 2000 climbing in 7 of the past 11 pre-election years, averaging 1.4%. NASDAQ has been up in 8 of the last 13 pre-election year Novembers with an average 1.2% gain. Contributing to pre-election year November’s weaker performance are sizable declines in 1987, 1991 and 2007.
It is not too late to meet Jeff, live and in-person at the MoneyShow/TradersEXPO Orlando October 29-31 and the 2023 New Orleans Investment Conference November 1-4. Octoberphobia has struck again, but October has historically been a good month to buy. Our Tactical Seasonal MACD Buy signal has triggered. Join Jeff to discuss current events and the market’s moves.
Not a subscriber? Sign up today for a Free 7-Day Trial to Almanac Investor to continue reading our latest market analysis and trading recommendations. Get a full run down of seasonal tendencies that occur throughout each month of the year in an easy-to-read calendar graphic with important economic release dates highlighted, Daily Market Probability Index bullish and bearish days, market trends around options expiration and holidays. In addition, the Monthly Vital Statistics Table combines stats for the Dow, S&P 500, NASDAQ, Russell 1000 and Russell 2000 and puts them all in a single location available at the click of a mouse.
4 notes
·
View notes
Text
Day Trading Indicators and Indication Trading.
Day Trading Indicators and Indication Trading. Did You Begin Day Trading As An Indicator Only Trader? It's a great time to start! an introducing broker: https://live.4xc.com/signup/FG4aG6qb Did you start day trading after purchasing a book on technical analysis, and getting a charting program - probably a complimentary one that you discovered online - to conserve money? While reading your book you found out about trading signs that might 'anticipate' price movement, and what do you understand, the 'finest' indicators were consisted of in your free charting program - let the video games begin. Now that you have all the day trading tools that are needed, the book for education AND the free charting program with those 'finest' day trading signs, you now need a day trading plan so you can decide which among those 'magic' day trading signs you are supposed to utilize. This truly is an excellent book, besides telling you how to day trade using indications to 'anticipate' cost - it also says that you require a trading plan to day trade. The book informed you about trend following using an indicator called MACD, and it also told you how it was possible to select the top or bottoms using a sign called stochastic; I guess that you selected the stochastic sign to start your day trading - this should be the 'finest of the finest' since this indicator was going to ensure you of entering your trades with the 'best' cost. Remarkable, just remarkable how easy this day trading things is. My book was Technical Analysis of the Futures Markets. My charting program was TradeStation with an eSignal FM receiver; that was the one that if you hung the antennae wires just right, and you put enough foil on the tips, you may even get quotes. I had offered a business before I began trading so I did have some capital - isn't that how everyone enters trading, you either sell a business or you lose your job? My indicator was the MACD as I had chosen that I was going to be a 'pattern follower' rather than a 'top-bottom picker'. I also decided that I was going to be 'additional' clever, if one indication was good then 2 indicators needed to be better, so I included a 20-duration moving average. My very first trade was a winner, then after many months of extensive treatment, I was finally able to forget the next twelve months. Learning To Day Trading - The Learning Progression. Trading indicators are readily available to anybody who has a charting program, and just utilizing line crosses, or pie chart color changes, supply 'easy' signals to comprehend. It's a great time to start! an introducing broker: https://live.4xc.com/signup/FG4aG6qb If you will likewise take the time to learn the math behind your indications, as well as discover what each sign is specifically meant to do, not only is this a logical way to start, but it is likewise a great 'action' in your learning progression - comprehending the WHAT you are doing, instead of attempting to develop 'canned' indicator just trading systems, without any regard as to WHY you are trading this way. Now what - you 'can't' develop your indications, so you start doing Google searches for day trading indications and start buying your 'collection' - they don't 'work' either. Now what - you purchase a mechanical trading system - what do theoretical outcomes may not be a sign of real trading or future results suggest? Now what - you never learn how to trade. I started trading as an indicator trader, and I did attempt to find out whatever I might about the numerous signs, in addition to trying to combine indications that were consistent with how I wished to trade - I simply might never develop a mechanical day trading system from what was readily available to me. I checked out a couple more books that didn't assist me, so I started trying to find someone who might teach me. From what I now know about gurus -vs- instructors, I am fortunate that I got involved with a money manager-trader who taught me a remarkable amount, however, I still could not get profitable, in part because there was also 'pressure' to learn how to trade utilizing real money. As well, any discussions or ideas about trading psychology and the issues involved, particularly to beginning traders, were non-existent. Now what - discovering but losing - I stopped trading. Discovering trading using genuine cash, and 'scoffing' at trading psychology as simply a private weak point, truly was something that I now consider as misinformation. I constantly discuss this as I now feel that this cost me as much as a year, and was close to costing me my trading future, as stopped trading and was VERY close to giving up trading. How can't trading psychology be real to a newbie, when you consider that you are running the risk of losing cash at an extremely fast pace as a day trader, and when you even more consider that you are likewise doing this when you do not understand what you are doing - this is NOT by meaning being weak. And if trading psychology is genuine, how are you going to? The book informed you about trend following utilizing an indication called MACD, and it likewise told you how it was possible to choose the leading or bottoms utilizing an indication called stochastic; I guess that you chose the stochastic sign to start your day trading - this must be the 'best of the finest' considering that this indicator was going to ensure you of entering your trades with the 'finest' rate. Now what - you purchase a mechanical trading system - what do hypothetical results may not be indicative of real trading or future results suggest? I began trading as an indicator trader, and I did try to discover everything that I might about the numerous indications, as well as attempting to combine indicators that were consistent with how I desired to trade - I just might never develop a mechanical day trading system from what was readily available to me. Discovering trading utilizing genuine cash, and 'scoffing' at trading psychology as merely a specific weak point, really was something that I now consider as misinformation. I always mention this as I now feel that this cost me as much as a year, and was very close to costing me my trading future, as stopped trading and was VERY close to quitting trading. It's a great time to start! an introducing broker: https://live.4xc.com/signup/FG4aG6qb Ian Jackson.
#Forex Trading#FX trader#how to trade forex#learn to trade#how much money can I make trading forex#options trading#how to trade bitcoin#knowledge to action#how much money do I need to trade forex#is trading a scam#financial freedom#earn money online#Money#Trading for beginners#how to trade basics#free trading course
0 notes
Text
Polygon launched POL contracts on the Goreli testnet last week.
MATIC’s weekly chart was green, but the latest metrics were bearish.
Polygon [MATIC] had a busy week as several major developments took place over the last few days. Today In Polygon recently posted a tweet highlighting most of the notable developments from last week. While that happened, MATIC also managed to push its price upward.
Read Polygon’s [MATIC] Profit Calculator 2023-24
A look back at Polygon’s week
Today In Polygon recently posted a tweet highlighting how the blockchain’s development has performed over the last seven days. For instance, the most notable development that happened last week was related to Polygon 2.0.
The last 7 days in Polygon👇👀
💜 POL contracts went live on Testnet
💜 Google Cloud became a Polygon Validator
💜 Reddit Avatars reached 20M holders
💜 Polygon zkEVM reached 6M transactions
💜 Polygon zkEVM reached 450K unique addresses
💜 @AstarNetwork announced Astar… pic.twitter.com/z0VxFC8NBN
— Today In Polygon (@TodayInPolygon) October 6, 2023
The blockchain’s much-awaited Polygon 2.0’s POL contracts recently went live on its testnet. POL contracts have been deployed on the Goerli testnet, and two proposals setting forth potential changes to the native token burning mechanism necessary for future upgrades went live as well.
Today, as a result of community consultations, POL contracts will be live on Goerli testnet.
A major step towards bringing Polygon 2.0 to life.
Based on the community’s feedback during the PIP governance process, PIP-24: Change EIP-1559 Policy & PIP-25: Adjust POL Total Supply,… pic.twitter.com/li8OF0o3jC
— Polygon Devs 📍 DevX Global Tour (@0xPolygonDevs) October 4, 2023
Apart from that, another major development was Polygon’s partnership with Google Cloud. Google announced that it has become a validator for the Polygon blockchain.
Apart from that, the blockchain’s rollup, zkEVM, also reached new highs as its total transactions exceeded 6 million. The rollup’s unique addresses also exceeded the 450k mark last week.
How is MATIC faring?
The last week was also profitable for MATIC as the token registered gains. The token’s price went up by more than 4% over the last seven days. However, things took a U-turn in the last 24 hours as its price went down.
According to CoinMarketCap, MATIC’s price dropped by over 2% yesterday. At the time of writing, it was trading at $0.5634 with a market capitalization of over $5.2 billion.
A look at the token’s metrics revealed what went wrong over the last few days. It was surprising to note that despite the recent price drop, the token’s MVRV ratio was still relatively up last week. Its social volume also remained high, reflecting the token’s popularity.
Source: TradingView
Is your portfolio green? Check out the MATIC Profit Calculator
However, things had the potential to worsen for MATIC. A look at the token’s daily chart showed that its Chaikin Money Flow (CMF) registered a steep decline as it went way under the neutral mark.
Its Relative Strength Index (RSI) also registered a slight downtick as it also went near the neutral mark. However, MATIC’s MACD remained in the buyers’ favor as it displayed a bullish crossover.
Source: TradingView
0 notes
Text
The Essentials of Day Trading Before You Start

Day trading is a very active and speculative type of trading in which participants buy and sell financial assets simultaneously in an effort to capitalize on swift price changes. Understanding a number of key concepts and principles is crucial before you begin day trading in order to improve your chances of success and control the dangers involved. Here are some essential fundamentals to be aware of:
Research and education
Know the markets you plan to trade, such as equities, foreign exchange, or commodities. Learn about the particular instruments and the factors that affect their prices.
Trading Techniques: Acquire knowledge of several day trading techniques, including swing trading, momentum trading, and scalping. Choose a trading strategy that fits your risk profile and trading style.
Risk Administration
Only allocate capital for day trading that you can afford to lose. Create a specialized trading account with money that is not used for living expenses or long-term investments.
Determine the size of each trade in relation to your total capital by using the position sizing method. Limit your risk to a modest portion of your trading capital (e.g., 1-2% every trade) to avoid placing too much of your trading capital at risk in a single transaction.
Stop-Loss Directives: To prevent potential losses, use stop-loss orders at all times. A stop-loss order causes an automatic trade withdrawal when a particular price level is reached.
Trading Strategy
Plan creation: Make a trading plan that clearly specifies your objectives, risk tolerance, trading approach, and trade entry and exit criteria.
Follow the Plan: Day trading requires discipline. Stick to your trading strategy and refrain from making snap judgments based on your feelings.
Technical Evaluation:
Charts and Indicators: To make wise trading decisions, learn how to read price charts and apply technical indicators (such as moving averages, RSI, and MACD).
Candlestick Symbols Recognizing potential reversals or continuation indications requires an understanding of common candlestick patterns.
Theoretical Analysis:
News and Events: Keep abreast of business news, market-moving events, and economic developments that could affect the assets you trade. These could offer useful context for your trading choices.
Broker Choice:
Pick an Honest Broker: Choose a trustworthy and licensed broker who offers reasonable commissions, an easy-to-use best trading website, and quick execution times.
Being psychologically prepared
Emotional Control: Day trading can be emotionally taxing and distressing. Develop emotional restraint to stay away from hasty actions motivated by greed or fear.
Mental toughness: Be ready for winning streaks as well as losing streaks. Keep your thoughts concentrated and clear throughout the trading day.
Ratio of Risk to Return:
Favorable Risk/Reward: Make sure that the possible reward of each deal outweighs the risk you are taking. A favorable risk/reward ratio (such as 2:1) indicates that you intend to gain twice as much as you risk.
Keep records:
Keep a thorough trade notebook to keep track of your deals, strategy, and performance. You can find opportunities for improvement by reviewing prior trades.
Start Little and Work on It:
Paper Trading: To practice without putting your money at risk, think about starting with a demo or paper trading account. This enables you to practice your trading methods and get comfortable with the trading platform.
Day trading calls for commitment, ongoing education, and the capacity to adjust to shifting market conditions. It's hardly a surefire way to wealth, and many traders lose money. So, proceed with caution when day trading and think about getting guidance from seasoned traders or financial experts before you start.
#best trading platforms#best trading online platform#trading online#best forex trading website#forex trading techniques#online trade marketing#best online trading
0 notes
Text
Stock Market Institute in East of Kailash
M Institute of Stock Market in Delhi offers a variety of stock trading courses, including:
Stock Market Basic Course: This course is designed for beginners who want to learn the basics of the stock market, including how to open a demat and trading account, how to place orders, and how to read charts.
Technical Analysis Course: This course teaches students how to use technical analysis to identify trading opportunities. Students will learn how to use various technical indicators, such as moving averages, candlesticks, and MACD, to make informed trading decisions.
Fundamental Analysis Course: This course teaches students how to use fundamental analysis to assess the intrinsic value of a stock. Students will learn how to analyze financial statements, identify key industry trends, and evaluate management teams.
Options Trading Course: This course teaches students how to trade options contracts. Students will learn the different types of options contracts, how to price options, and how to develop trading strategies.
Day Trading Course: This course teaches students how to day trade stocks and other financial instruments. Students will learn how to identify intraday trading opportunities and how to manage risk.
ISM Institute of Stock Market also offers a variety of specialized courses, such as:
Algorithmic Trading Course: This course teaches students how to develop and use algorithmic trading strategies. Students will learn how to use programming languages such as Python to automate their trading.
Quantitative Trading Course: This course teaches students how to use quantitative analysis to develop trading strategies. Students will learn how to use statistical methods and machine learning to identify trading opportunities.
ISM Institute of Stock Market Institute in East of Kailash are taught by experienced professionals who are actively involved in the stock market. The institute also offers a variety of support services to its students, such as live trading sessions, mentorship programs, and job placement assistance.
If you are interested in learning more about stock trading, I recommend that you visit the ISM Institute of Stock Market website or contact them directly. They will be able to help you choose the right course for your needs and budget.
1 note
·
View note
Text
Sell Signals Emerge: TD Sequential Indicates a Potential Correction for Bitcoin – What Lies Ahead?
The Bitcoin market continues to be a focal point for traders, with various indicators offering contrasting signals. Analyst Ali Martinez sheds light on the TD Sequential indicator, which has recently triggered a sell signal on the 4-hour chart, prompting a closer look at potential short-term corrections. Impressively, this indicator has demonstrated consistent accuracy, predicting corrections ranging from 1.50% to 4.20% since mid-February. Traders navigating the cryptocurrency market find these patterns invaluable for short-term decision-making.
Despite the cautionary stance presented by the TD Sequential indicator, the overall market sentiment remains optimistic. KaikoData's analytics platform reveals a gradual improvement in Bitcoin's market depth over the past month, although it has not surged to anticipated levels given the recent uptrend in prices. Enthusiasts, undeterred, speculate on Bitcoin reaching a new all-time high (ATH) of $74,000 in the near term, fueled by the breakout from the green ascending channel on the 3-day chart.
The latest market figures report a live Bitcoin price of $63,112.87, supported by a substantial 24-hour trading volume of $87 billion. The recent uptick of 4.06% adds to the excitement surrounding Bitcoin's potential trajectory.
However, a closer look at the 1-day chart reveals cautionary signals. The Relative Strength Index (RSI) is currently at 87.74, signaling a short-term overbought market. Despite this, the Know Sure Thing (KST) indicator on the same chart showcases robust bullish momentum, instilling confidence in the ongoing uptrend. Additionally, the Moving Average Convergence Divergence (MACD) aligns above both the signal and zero lines, a strong bullish trend indicator. Traders are advised to exercise prudence, acknowledging the potential for pullbacks or corrections in the near future despite the prevailing bullish sentiment.
0 notes
Last Seen Blogs