
jeffhirsch
Almanac Trader
I am the editor of the Stock Trader's Almanac & Almanac Investor Newsletter. I use historical patterns and market seasonality in conjunction with fundamental and technical analysis...
1782 posts
Don't wanna be here? Send us removal request.
Last Seen Blogs

marcos-gibran
De noche las palmeras

comforttobeunknown
Happy Soul

emperorsgf
would you like that?

saturndeki-prens
𝚂𝙰𝚃𝚄𝚁𝙽𝙳𝙴𝙺𝙸 𝙿𝚁𝙴𝙽𝚂

stateterminal
never give up your dreams .
Text
May Almanac: Historically Poor in Election Years

May has been a tricky month over the years, a well-deserved reputation following the May 6, 2010 “flash crash”. It used to be part of what we once called the “May/June disaster area.” From 1965 to 1984 the S&P 500 was down during May fifteen out of twenty times. Then from 1985 through 1997 May was the best month, gaining ground every single year (13 straight gains) on the S&P, up 3.3% on average with the DJIA falling once and NASDAQ suffering two losses.
In the years since 1997, May’s performance has remained erratic; DJIA up fourteen times in the past twenty-six years (four of the years had gains exceeding 4%). NASDAQ suffered five May losses in a row from 1998-2001, down –11.9% in 2000, followed by fourteen sizable gains of 2.5% or better and seven losses, the worst of which was 8.3% in 2010 followed by another substantial loss of 7.9% in 2019.

Since 1950, election-year Mays rank rather poorly, #9 DJIA and S&P 500, #8 NASDAQ and Russell 2000 and #7 Russell 1000. Average performance in election years has also been weak ranging from a 0.4% DJIA loss to a 0.6% gain by Russell 2000. Aside from DJIA, the frequency of gains in election year Mays is bullish, but down Mays have tended to be big losers. In 2012, DJIA, S&P 500, NASDAQ, Russell 1000 and 2000 all declined more than 6%.
3 notes
·
View notes
Text
Big Election Year Q1s Dip April-May Before Gains Last 7 Months
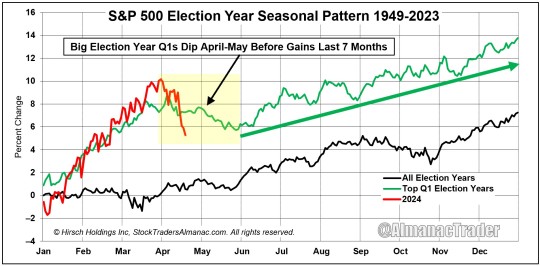
2024’s great start was the third best Election Year Q1 since 1950. Looks like we’re tracking Top Q1 Election Years more pronounced April-May dip. Chop continues in July and August and these years have marked time until the election in November, gaining about 2.5% on from April to October. Regardless of the election outcome S&P 500 suffered only two losses in the last seven months of election years since 1950, 2000 and 2008 (2024 STA page 80).
3 notes
·
View notes
Text
Election Year Drawdowns Happen – S&P 500 Average Pullback 13% since 1952

After five straight months of gains and numerous new all-time highs, recent weakness and the corresponding spike in volatility seem unfamiliar. Despite lingering inflation and escalating geopolitical tensions, S&P 500 was down 3.86% from its closing all-time high of 5254.35 on March 28 through its close on April 16. This is well below the average historical largest drawdown during an election year since 1952 of 13.07%. Were it not for steep declines in 2020 and 2008, election years have tended to enjoy relatively modest drawdowns. Of the last 18 election years, 11 experienced single-digit drawdowns. The smallest was just 3.55% in 1964. DJIA’s record is similar to S&P 500 while the higher beta stocks of the NASDAQ Comp have experienced larger election year drawdowns.
6 notes
·
View notes
Text
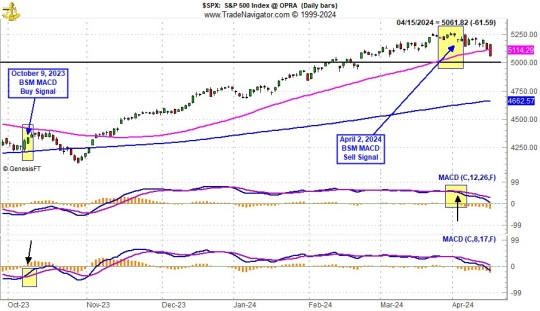
April 2 Seasonal MACD Signal Triggered Right on Time
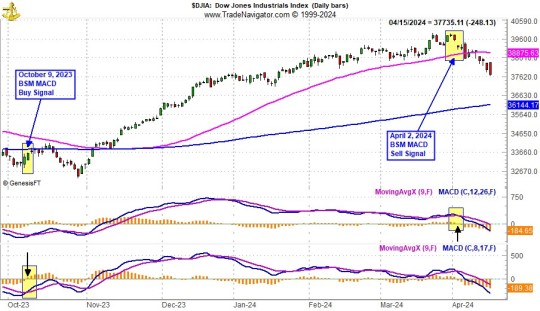
We issued our Best Six Months MACD Seasonal Sell signal for DJIA and S&P 500 to newsletter subscribers on April 2 when slower moving MACD indicators applied to DJIA and S&P 500 both turned negative after the start of the last month of the BSMs. This marked the start of our transition to a more cautious stance.
Arrows in the charts point to a crossover or negative histogram on the slower moving MACD used by our Seasonal Switching Strategy to issue a sell signal. NASDAQ’s “Best Eight Months” lasts until June. Subscribe to our Almanac Investor Newsletter and get all our trades. https://stocktradersalmanac.com/Alerts.aspx
We do not merely “sell in May and go away.” Instead, we take some profits, trim or outright sell underperforming stock and ETF positions, tighten stop losses and limit adding new long exposure to positions from sectors that have a demonstrated a record of outperforming during the “Worst Months” period.
3 notes
·
View notes
Text
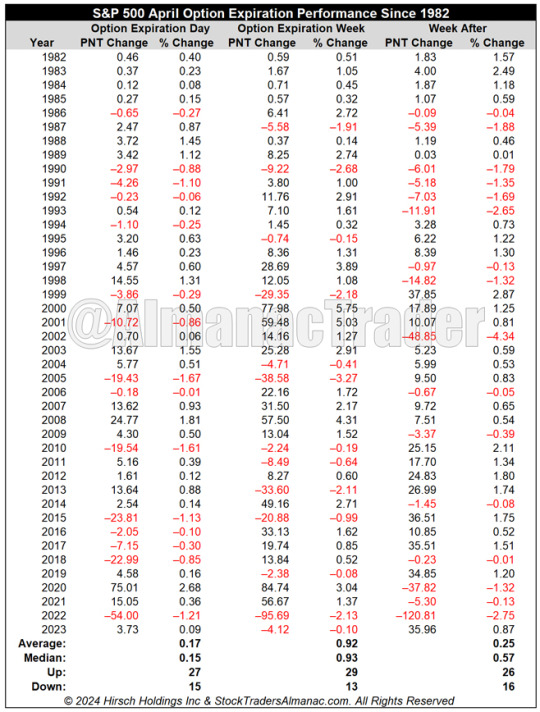
April Monthly Option Expiration Week - DJIA Up 33 of Last 42

April’s monthly option expiration is generally bullish across the board with respectable gains on the last day of the week, the entire week, and the week after. Since 1982, DJIA and S&P 500 have both advanced 27 times in 42 years on expiration day with average gains of 0.22% and 0.17%, respectively. Monthly expiration day was staging a comeback after four or five declines from 2014 to 2018 but took a hit in 2022’s bear market. Expiration week has a bullish track record over the past 42 years. Average weekly gains are right around 1% for S&P 500, DJIA and NASDAQ. The bullish bias of April monthly expiration also persists during the week after although average gains have not been as strong with selling pressure rising recently (since 2014).

1 note
·
View note
Text
Best Six Months Rally Respite Underway April Tracks Election Year Seasonality

It’s been a banner “Best Six Months (BSM)” (November-April) for the Dow and S&P 500. From our Seasonal MACD Buy Signal on October 9, 2023, through our April 2, 2024 Seasonal MACD Sell Signal), DJIA gained 16.6%, S&P 500 20.1% – double the historical average BSM gains. These big gains have not left much on the table until later this year.
Risks are more elevated now. Sentiment continues to run high. Valuations are extended. Geopolitical tensions have not eased. And persistent inflation pressures have the Fed in no rush to cut rates. As the election campaign rhetoric heats up and the Best Six Months comes to a close, we are shifting to a more cautious stance.
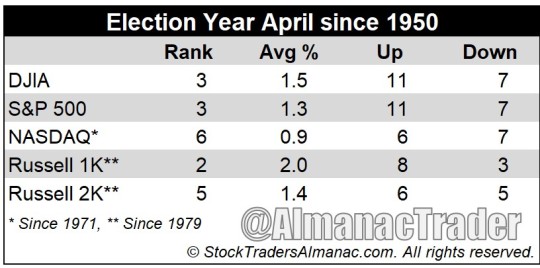
As you can see in the chart of April 2024 compared to election year Aprils since 1950 the market is tracking the softer election year April pattern
4 notes
·
View notes
Text
April Ends Best Six Months #1 DJIA
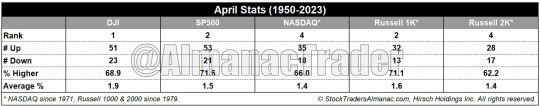
April is the final month of the “Best Six Months” for DJIA and the S&P 500. April is #1 DJIA month by average performance since 1950, 2nd best S&P 500 month and 4th best NASDAQ (since 1971).
In election years, performance and rank softens slightly, 3rd best DJIA and S&P 500 month, 6th for NASDAQ, but remains bullish. April is the last month of DJIA and S&P 500 “Best Six Months.” NASDAQ’s Best Months run through June. Election Year Aprils are up 1.3% on average for S&P 500.
2 notes
·
View notes
Text
Super Boom Spring Break Easter Sale!

Few at Dow 10,000 believed me in May 2010 when I forecasted a 500+% market rise that would put DJIA at 38,820 by the year 2025 in my Almanac Investor Newsletter. My 2011 book Super Boom took a deeper dive into the history and analysis of this groundbreaking forecast and the iconic market cycle and pattern that it’s based on. Now that Dow 38,820 has come true, what’s next? AI is clearly the culturally enabling, paradigm-shifting technology I predicted would drive the next phase of this generational Super Boom. Come find out what I expect to happen next. Get my latest outlook on how and why the AI Super Boom will drive the economy full steam ahead and the market higher and higher.
Sign up Today! Save up to 55% Off! Get the 2024 Stock Trader’s Almanac as a FREE Bonus! And find out the update on my 100% accurate bullseye 2010 Super Boom forecast for Dow 38820 and learn what’s next for the market and the AI Super Boom!
1-Year @ $179 – over 48% Off vs. Quarterly - Use promo code 1YRSBSB24
2-Years @ $299 – MY BEST DEAL – 55% Off - Use promo code 2YRSBSB24
MoneyShow Easter Sale
Come down to Miami for spring break and join me in person at MoneyShow’s Investment Masters Symposium – The Big Money Pivot – East. April 10-12, 2024, at the Hyatt Regency Miami. They have a special Easter Sale this weekend! Join us for 3 days filled with market education from the nation’s top experts on stocks, bonds, real estate, precious metals, cryptocurrencies, technology, energy, & more. Use $99 Standard Pass Coupon Code HOP99
Register here to join:
https://www.miamisymposium.com/speakers/ed8d429050d5486abc818182ac141048/jeffrey-hirsch/?scode=062467

Rally Respite After Big Best Six Months Gains
Monday is the beginning of the last month of the “Best Six Months (BSM)” (November-April) for the Dow and S&P 500 – and what a banner one it’s been so far. From our Seasonal MACD Buy Signal on October 9, 2023, through the close on March 28, 2024, DJIA is up 18.46% and S&P 500 is up 21.19% – more than double the historical average BSM gains. Our Best Six Months Seasonal MACD Sell Signal can trigger anytime on or after the first trading day of April, which is Monday April 1st this year. NASDAQ’s Best 8 Months end in June, which is up 21.47% since our buy signal, not quite double the average but give it time.
The big rewards we have reaped this Best Six Months and year-to-date so far have not left much on the table until later this year. Risks are more elevated now. Sentiment continues to run high. Valuations are extended. Geopolitical tensions have not eased. And persistent inflation pressures have the Fed in no rush to cut rates. As the election campaign rhetoric heats up and the Best Six Months comes to a close be prepared to shift to a more cautious stance when we issue our Best Six Months Seasonal MACD Sell Signal. We do not expect a bear market or major correction. We do not Sell in May and go away. We sell some things, tighten stops and consider defensive positions if warranted.
So sign up today to receive my Best Six Months Seasonal MACD Sell Signal as soon as it triggers!
Get the 2024 Stock Trader’s Almanac As a FREE Bonus!
And Profit From Market History!

This limited time offer is open to everyone, regardless of current subscription status. Lock in an additional 1- or 2-year subscription at our lowest available price.
For over five decades, top traders, investors and money managers have relied upon Stock Trader’s Almanac. The 2024, 57th Annual Edition shows you the cycles, trends, and patterns you need to know in order to trade and/or invest with reduced risk and for maximum profit.
This indispensable guide is organized in a calendar format. Proprietary strategies include the Hirsch Holdings’ “Best Six Months Switching Strategy” (frequently referred to as “Sell in May”), the January Barometer, the Four-Year Presidential Election/Stock Market Cycle, top Sector Seasonalities and much more.
Trusted by Barron's, The Wall Street Journal, the New York Times, and many other respected market authorities, this indispensable guide has helped generations of investors make smart, profitable market moves since 1968.
Weekly Almanac Investor email Issues and a Monthly Webinar deliver the latest market analysis, new trade ideas (long and short), portfolio updates, new research, technical, fundamental, seasonal, monetary policy and sentiment analysis.
Subscribe or Renew Today
Two ways save:
1-Year @ $179 – over 48% Off vs. Quarterly - Use promo code 1YRSBSB24
2-Years @ $299 – MY BEST DEAL – 55% Off - Use promo code 2YRSBSB24
Almanac Investor Includes:
Opportune ETF & Stock Trading Ideas with specific buy & sell price limits
Timely Data-Rich & Data-Driven Market Analysis
Market-Tested and Time-Proven Short- & Long-term Trading strategies
“Best Six Months” Switching Strategy MACD Buy & Sell Signals
Free 2024 Stock Trader’s Almanac for new members
Free Stock Trader’s Almanac for each additional active year
Access to my proprietary Almanac-based Tools (Market data beginning in 1901):
Market Probability Calendar: Discover the best and worst days of any month
MACD Calculator: Track the market momentum & test your own parameters
Year-at-a-Glance: DJIA, S&P 500, NASDAQ, Russell 1000 & 2000 daily prices
Monthly Data Bank: monthly closes, price change and percentage change
Best & Worst: Days, Weeks, Months & Years
Daily Performance: Weekly performance broken down into days of the week
Market Volatility: Identify past periods of volatility and streaks of positive or negative performance
All of this and more is delivered weekly to your inbox via email Issues and webinars!
Act Now – this is a limited-time offer that will expire soon.
If your email address is associated with an account at https://www.stocktradersalmanac.com and you forgot your password it can be reset here. Once logged in, navigate to “My Account”, add/update payment information and renew your old subscription (annual subscriptions) in just one click or use “Subscribe Now” links on the homepage to take advantage of this offer.
Some fine print:
Hirsch Holdings offers a pro-rated refund on all cancelled annual subscriptions. Annual subscriptions cancelled within the first three (3) months may have their refund reduced by up to $75 if an annual Stock Trader’s Almanac has been shipped. Quarterly subscriptions are non-refundable. Quarterly subscribers may cancel at any time.
Yours truly,
Jeffrey A. Hirsch
CEO: Hirsch Holdings | Editor: Stock Trader’s Almanac & Almanac Investor
3 notes
·
View notes
Text
Good Friday Boosts End Q1 But Weakens Q2 Start
Over the past 34 years since 1990 the last trading day of Q1 has been plagued by end-of-quarter portfolio restructuring. DJIA is down 21 of 34 with an average loss of –0.24%. S&P is down 19 of 34 with an average loss of –0.04%. NASDAQ is up 20 of 34 with an average gain of 0.21%. Russell 2000 is up 25 of 34 with an average gain of 0.32%.
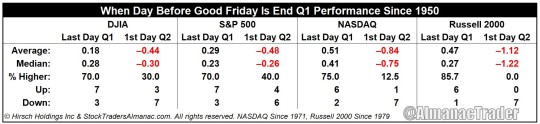
When the day before the Good Friday market holiday is the last trading day of Q1 it’s a boost. DJIA is up 7 of 10, average 0.18%. S&P is up 7 of 10, average 0.29%. NASDAQ is up 6 of 8, average 0.51%. Russell 2000 is up 6 of 7, average 0.47%.
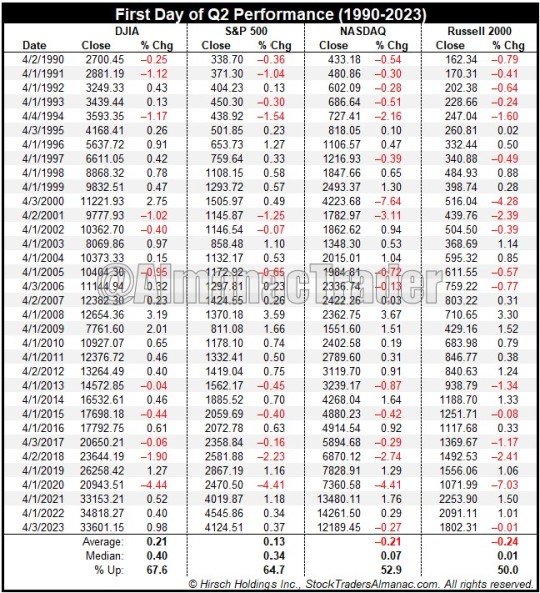
First trading day of April/Q2 has a more positive history. Since 1990, DJIA is up 23 of 34 with an average gain of 0.21%. S&P is up 22 of 34 with an average gain of 0.13%. NASDAQ is up 18 of 34 with an average loss of –0.21%. Russell 2000 is up 17 of 34 with an average loss of –0.24%.
Easter Sunday the day before the first trading day of April/Q1 has the reverse effect, it’s bad. DJIA is down 7 of 10, average –0.44%. S&P is down 6 of 10, average –0.48%. NASDAQ is down 7 of 8, average –0.84%. Russell 2000 is down 7 of 7, average –1.12%.

2 notes
·
View notes
Text
Market Historically Strong Ahead of Good Friday

Good Friday is the one NYSE holiday with a clear positive bias before and negativity the day after (Stock Trader’s Almanac 2024, page 100). DJIA, S&P 500, NASDAQ, and Russell 2000 all have solid average gains on the three days and full week (shortened) before Good Friday. NASDAQ has been notably strong, up 21 of the last 23 days before Good Friday with an average gain of 0.79%. NASDAQ declines occurred in 2017 (–0.53%) and 2022 (–2.14%).
However, the day after Easter has a weak longer-term post-holiday record. The S&P 500 was down 16 of 20 years from 1984-2003 on the day after Easter while it has been up 13 of the last 20 years. Post-Easter weakness has been generally short-lived with solid average gains 2- and 3-days after.
4 notes
·
View notes
Text
5-Month Streak Looks Like A Secular Bull Market

Not only is it bullish for April and the rest of the year. When November, December, January, February and March are up stocks have been in a secular bull market that extended to at least the next year.
Note a touch of weakness in Q2-Q3 in the Worst Six Months and some huge Q4 rallies. Last 9 months of the year up all 11 times, average gain 11.9%,
2 notes
·
View notes
Text
Best Six Months Ends in April

After 5 months of solid gains, are markets ready for a pause?
Bullish Presidential Cycle Sitting President Pattern flattens out the mid-February to late-March seasonal retreat considerably without 2020 in the average.
April is the final month of the “Best Six Months” for DJIA and the S&P 500. From our Seasonal MACD Buy Signal on October 9, 2023, through (March 21, 2024), DJIA is up 18.4% and S&P 500 is up 20.9%. Fueled by interest rate cut expectations and AI speculation, these gains are approximately double the historical average already and could continue to increase before the “Best Months” come to an end.
This AI-fueled bull market has enjoyed solid gains since last October and will likely continue to push higher in the near-term, but momentum does appear to be waning with the pace of gains slowing. With April and the end of DJIA’s and S&P 500’s “Best Six Months” quickly approaching we are going to begin shifting to a more cautious stance. We maintain our bullish stance for 2024, but that does not preclude the possibility of some weakness during spring and summer.
0 notes
Text
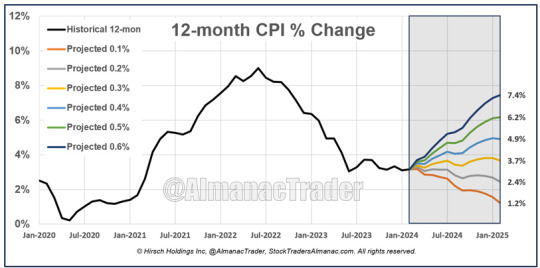
Inflation Projection No Rate Cut Soon

Until PCE is sustained at or below 2% they are not likely to cut. Our PCE projection chart reveals the Fed is not likely to be in a rush. They are slow to cut rates & only move quickly when a real crisis is at hand, which currently is not.
The Street is overly optimistic the Fed will cut rates sooner, substantially, & start well before the election to not appear political. But last week’s higher than expected CPI (0.4% monthly 3.2% yearly) suggests otherwise as PCE tends to follow CPI’s trend.
Headline PCE index, including food and energy “is the Federal Reserve’s preferred measure of inflation.” https://fred.stlouisfed.org/series/PCEPI
PCE’s monthly change was 0.3%, which put the 12-month rate at 2.4%, above the Fed’s stated 2% target. Anything above a 0.1% monthly change will keep inflation above 2%. Any monthly change greater than 0.1% is likely to delay any Fed rate cut until after midyear if not longer.
The Fed may have engineered the goldilocks soft landing, but with inflation persistent while the economy remains resilient and unemployment stays down, there’s no need for the Fed to rush to cut rates.
2 notes
·
View notes
Text
Typical Ides of March Low
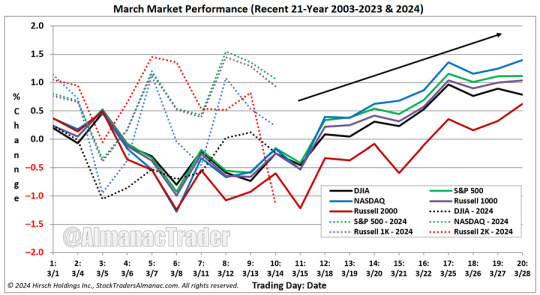
First half of March trading has been mostly in line with its seasonal pattern over the last 21 years. There has been plenty of chop with S&P 500, NASDAQ and Russell 1000 drifting higher while DJIA and Russell 2000 have moved lower. S&P 500 is up 1.06% thus far this month. NASDAQ is hanging onto an 0.23% gain, but DJIA and Russell 2000 are both in the red, down 0.23% and 1.15% respectively.
Today is the Ides of March and over the last 21-year period, the market has tended hit its March low today on the Ides and then to rally afterwards. Having avoided typical seasonal weakness in February and in early March, this upcoming period of strength could already be factored into the market, and we could experience more chop and churn.
Historically, the week after quarterly options expiration in March has been prone to weakness. Plus, the Fed is scheduled to meet next week. Even though it is widely expected that they will not be changing the Fed Fund’s Rate, everyone will still be looking for clues as to when they may begin cutting rates.
This AI-fueled bull market has enjoyed solid gains since last October and will likely continue to push higher in the near-term, but momentum does appear to be waning with the pace of gains slowing. With April and the end of DJIA’s and S&P 500’s “Best Six Months” quickly approaching we are going to begin shifting to a more cautious stance. We maintain our bullish stance for 2024, but that does not preclude the possibility of some weakness during spring and summer.
3 notes
·
View notes
Text
Ides, Schmides – March Drawdowns <2% Rather Bullish
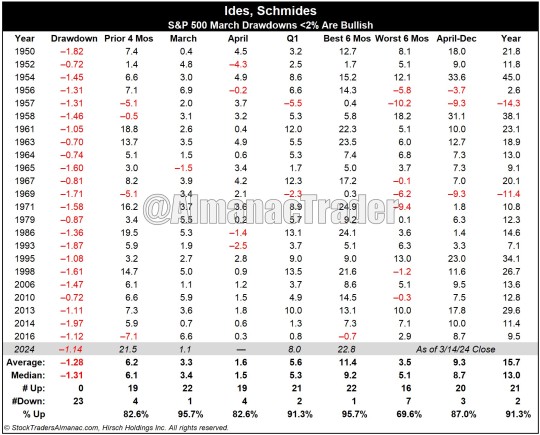
While our 2024 outlook has remained decidedly bullish since our December “2024 Forecast: More New All-Time Highs Anticipated,” we’ve warned to “Beware the Ides of March.” That this overbought market is due for a pullback. That stuff happens in March, especially in election years (think 1980 Hunt Bros, 2000 Dotcom Bubble Pop and 2020 Covid Crash).
But what does it mean if this AI-driven bull powers ahead through March without a hitch? Well, it’s bullish, that’s what. Gains beget gains and when macro forces overpower weak seasonality, those forces often gather momentum when the seasonal period ends.
While there is still time left for March’s history of volatility to kick in, especially during notoriously treacherous week after Triple Witching, should the market escape the usual March retreat that would support continued robust bullish market action for the rest of 2024. When March’s drawdown is <2% the Best Six Months November-April are up 95.7% of the time, average gain 11.4%; Worst Six Months are not bad, up 69.6% of the time, 3.5% average; rest of the year is up 87% of the time, average 9.3%; and the full year is up 91.3% of the time with an average gain of 15.7%.
0 notes
Text
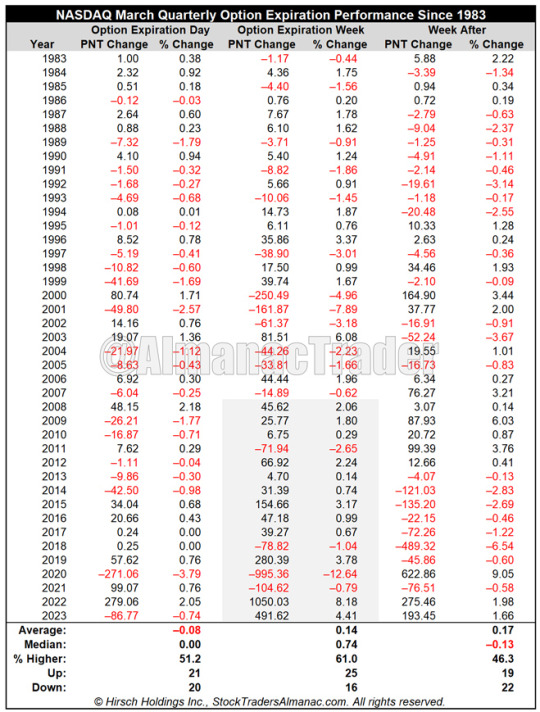
March Quarterly Options Expiration Week: S&P 500 and NASDAQ Up 12 of Last 16

March Quarterly Option Expiration Weeks have been quite bullish. S&P 500 has been up 27 times in the last 41 years while NASDAQ has advanced 25 times. More recently, S&P 500 and NASDAQ have both advanced 12 times in the last 16 weeks. But the week after is the exact opposite, S&P down 27 of the last 41 years—and frequently down sharply. In 2018, S&P fell –5.95% and NASDAQ dropped 6.54%. Notable gains during the week after for S&P of 4.30% in 2000, 3.54% in 2007, 6.17% in 2009, and 10.26% in 2020 appear to be rare exceptions to this historically poorly performing week.
2 notes
·
View notes
Text
Typical March Performance: Second Half Better

Over the recent 21 years March has been a decent performing month for the market. Average gains over the period range from a low of 0.78% by DJIA to a respectable 1.40% by NASDAQ. March typically opens positively but selling pressure and weakness tend to follow quickly thereafter with choppy trading until around mid-month. From here on the market generally rallied to finish out the month. End-of-Q1 portfolio adjustments have contributed to additional choppy trading during the last three or four trading days of March. Election year average performance is influenced by across-the-board double-digit losses in 2020, but March’s pattern is similar with weakness in the first half and modestly improved trading in the second half.
0 notes