#gephi
Text
I made an atlas of the Minecraft Multiplayer (SMP) Community - Full zoom in replies

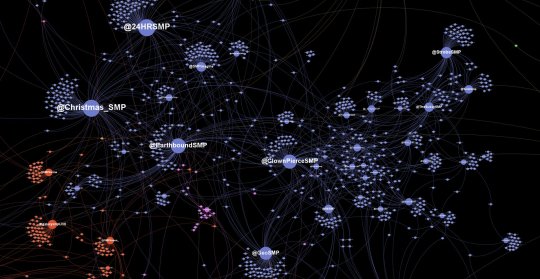
This is my own repost. Original, full thread can be found on the bird app
view FULL SVG (you should pick this)
view 8K PNG (does not have unlimited zoom and is blurry as well so you can't find yourself)
TIP: While viewing the .svg, do CTRL+F in your browser to open the "Search Page" feature. Then type your name to find yourself. You might not be there at all lol, but if you are, good job. you made it
I'll explain the atlas a bit: The colors are assigned by a Community Detection algorithm (an algorithm that automatically forms communities, duh) The sizes represent the size of the SMP, in member counts. I ultimately went against assigning the sizes based on followership because i feel like it would be unfair, since some SMPs on this list are just so colossal, and twitter followers don't really paint the whole picture. So i want with this.
The placement of the community depends on how the specific community interacts with other communities. If a community is pretty close to some other community, they will appear closer to each other. Makes sense, right?
Here's the dataset i used (made by me):
https://docs.google.com/spreadsheets/d/18hsr-aZ-OeKcIP1iBxq2rbyiQrBdcnlPx0Hjf9rLVNg/edit#gid=0
Here's the link to the edgelist i made for this visualization: https://candycupgallery.github.io/minecraft_server_edgelist.csv
#minecraft#minecraft servers#twitter#data science#atlas#smp#i think it's cool#gephi#minecraft art#charts could be considered art#well in theory#svg enjoyer
21 notes
·
View notes
Note
ARE THOSE SIMILAR ARTIST WEBS JUST FROM YOUR BRAIN
NO lol it's from data from labs.polsys.net/playground/spotify/ you can try it out yourself :)
18 notes
·
View notes
Text
frothing at the fucking mouth
#i want to get my computer and dick around in gephi but if i start doing geohi thinks i will NOT be able to think abt anything else for the r#rest of the day#music maps……
0 notes
Note
out of curiosity!! the map that you've made/are making, what's the variable that ties some dots/bands together and not others?
Oh yeah! I guess I never really explained it lol. That's Spotify's "fans of x also listen to y" data, or overlap between listenerbases. When two bands share enough listeners, a line forms! The data comes from https://labs.polsys.net/playground/spotify and I work with it in Gephi
82 notes
·
View notes
Text


9th, 10th and 11th Oct || 79 to 81 days of 100dop
9th Oct
💻 completed discussion part of our manuscript
we were supposed to have our final project presentation but things got mixed up and it got postponed :/ @rzoom-csv offered to drop me to the station on his way home in his scooter but it started raining heavily and we both raced in the pouring rain. by the time we reached the station we were drenched from head to toe; it was the most fun i had in forever XD
10th Oct
📊 didn't feel like going to uni so I sat cooped up in my room and tried to learn how to use gephi. it's a very cool software and and i now know how to create networks on it. i ended up generating a few images for the manuscript of the final project
11th Oct
💊 started work on new assignment : 3d bioprinting for disease
💻 our final project is officially complete! we'll be sending our work out for publication now, hope that goes smoothly. additionally, the phase2 presentation is tomorrow and we'll be explaining like half of our work so far to the grading panel. hopefully they don't grill us with too many questions T-T
📑 started GRE! i just skimmed through the math section for an hour; it started off as due diligent practice but for some reason all the questions were from the difficult section, and eventually my sleepiness got the better of me so i gave up whoops
oh in other news I got a v cool gender affirming haircut recently i say gender affirming but it mainly just makes me look like a plant and i love it!! it makes me feel very cool and academia :P I've also gotten hooked on The Magnus Archives recently, I started it the day before yesterday and I've already devoured 30episodes of it, I might be able to get through the most of it in the next couple of days; hope you guys are having a wonderful week <3
#2023dop#studyspo#100dop#100 days of productivity#100 days of self discipline#100 dop#study motivation#study blog#studyblr#100 days of studying#stemblr#stem student#college student#study blr#stem academia#study inspo
33 notes
·
View notes
Text

tried to put all 4,000+ bands we've done on hyhtb (and their relations) into gephi, made this and then it immediately ran out of memory and crashed. this is what music looks like!
17 notes
·
View notes
Text
6 Degrees of MCYTblr
In this game, I'll try to connect two suggested blogs in 6 steps or less.
To play, just send in an ask asking me to connect one blog with another. For example, you could ask something like "Permafrost7767 -> daisycraft?" which would look something like this:
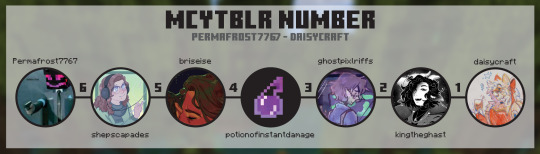
This is directly inspired by 6 Degrees of Kevin Bacon and @/ryunumber on tumblr. I'd recommend checking them out if you want more info!
And if you want a bit more of my thought process/a little network graph, it's all under the cut:
After going through a bunch of popular hermitblr/mcytblr blogs, I've connected them through their "blogs like this one". Obviously this is not comprehensive, nor completely reflective of who interacts with who, but it is a neat insight into how tumblr decides what blogs are "like this one".
I graphed the network below using Gephi, and it was interesting to see the communities that formed (for example, all the "is-the-___-video-cute" blogs all formed a clump, and the MCYTers formed their own clump as well). However, I don't expect it to be anywhere near perfect, due to a small sample size. This was just a starting off point!
There are 215 nodes/blogs, and 786 edges/connections as of January 2023.
If you don't want me to tag your blog for organization (I will never be @ing/mentioning your blog), feel free to shoot me a DM.
33 notes
·
View notes
Text
gelphi gelphie gelphie gephie glpehi gelphie gelphie gelphie gelphie gelphie gelphie
5 notes
·
View notes
Text
Conversion Therapy
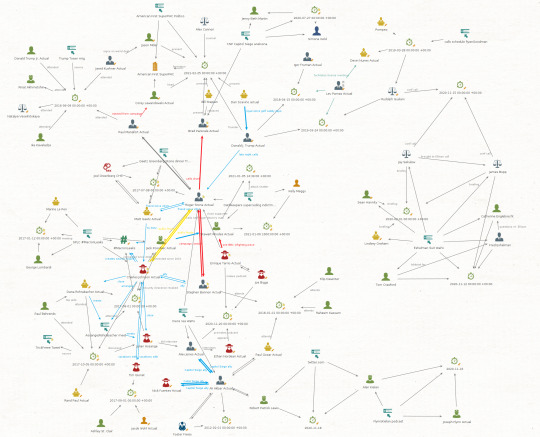
Like Captain Hook and his temporal detectable crocodile, this graph haunts me and I hear a ticking clock when I open it.

Way back in the fall of 2020, three months before the election, the events in MAGA world were getting complex. I opened Maltego, pasted in a URL, used the Named Entity Recognition transform that accesses IBM’s Watson, and the initial graph filled with a dozen names. Now a thousand days have elapsed, there are 1,088 URLs in there, and an astonishing 2,908 names. The 5,672 entities and 13,011 links connecting them have become a sort of Rosetta stone, a thing that gets opened when reporters I know are fact checking complex flows of events.
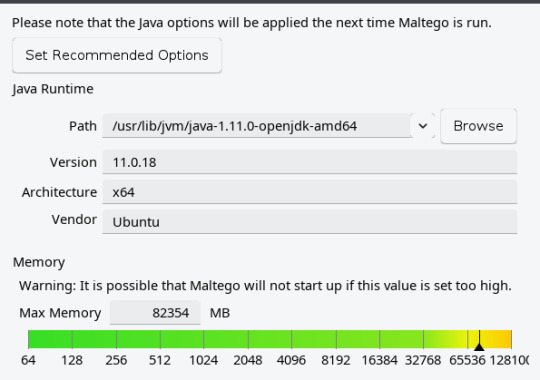
But there’s trouble here. Maltego is a Java application and that graph is enormous. When you give Java more than 31 gigabytes of memory it switches to using 64 bit pointers and your actual usable space yield declines. If you need more than 31 gig, the next sensible number is not 32, it’s 49. A couple months ago I upped the allocated memory to 64 gig and that helped for a while. Now it really does need 80 gig if I’m going to work with that graph and pull a slice of it out in order to share with someone else.
There are other subtle problems that can’t easily be depicted in a screen shot. Twenty one Date/Time entities have crept into the graph.
And this is the real circus. There are 189 events … and an event is a child entity of … Location. They have timestamps as an internal attribute, but Maltego doesn’t really have any tools to handle temporal data.
This situation is untenable. That graph won’t work reliably on my desktop and only hardcore gamers have more capability than my setup. There are four other tools I use that can handle data relationships:
Gephi can handle a quarter million nodes in a graph but it lacks features for handling geospatial, temporal, or diverse entity data.
Graphistry is a web accessible GPU driven commercial alternative to Gephi, but with similar constraints on data types.
Tulip is an intriguing Gephi competitor, but more a framework for doing serious artwork with smaller datasets and richer network layout needs.
And that leaves Sentinel Visualizer. This is a full featured link analysis package meant for corporate fraud investigation, law enforcement, and intelligence activities. It’s Windows only, which pains me a bit, as I changed careers twenty five years ago to get out from under Microsoft’s marketing weasel driven chaos. But I think I’ve got something workable here:

So that’s Windows 10, and I’ve got it treed in a VirtualBox VM. I gave it 40 gig of memory and ten of twelve cores. I spent an evening Googling and fiddling with virtualization settings and I’ve finally got something usable in terms of speed.
Every other OS you can install in a VM, give it some resources, and it’ll just run. Windows seems to need the Guest Additions installed, a couple reboots, cursing in English and one other optional language of your choice, another install of Guest Additions, and then giving up and walking away in disgust overnight. Complete this ritual and you’ll be left with an operational system.
If this were an actual physical system we would not be having this conversation. Microsoft’s utter disrespect for the value of my time in the 1990s was intolerable and in this area I have not mellowed with age. But with a Linux host and VMware I can do essentially instant backup and restore using the ZFS snapshot feature and it’s possible to export the machine in OVA format as an offline backup.

And that's the first step data wise. I fed it an export of names, then some URLs. I'm puzzling over how to use Maltego's internal UUID with Sentinel Visualizer, without smearing an endless blur of visually very similar strings all over the display.
I have a couple projects in mind with this:
The MAGA world meltdown graph has to be either moved or abandoned.
There are a LOT of interesting datasets from Ukraine that involve both geospatial and temporal data.
There are famous historical battles that are well documented enough to make for a nice graph, but I've yet to see a source that offers both geospatial and temporal data in tabular form.
So that's the direction we're headed for the second half of 2023. If I get something worthwhile put together, I will make it available for use with Sentinel Visualizer Reader.
2 notes
·
View notes
Text
HW #5 - Solved
What to Do:
For this assignment you are to write code that will analyze a social network of Marvel Universe (comic book) characters. This assignment is a bit contrived/convoluted in that it has you doing tasks in Python, Neo4j, and even Gephi! However, the objective is to get you to practice several things that we have discussed recently in class (e.g., Gephi, Neo4j, the Python Neo4j API, and…

View On WordPress
0 notes
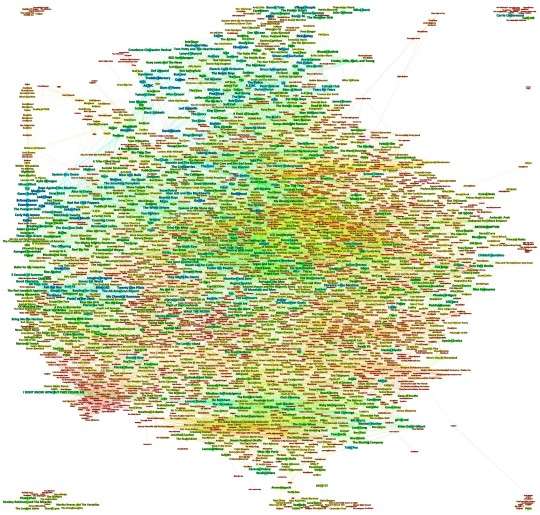
Text
LIS 4317: Week 1
A visual analysis that has always caught my attention was this piece by Kiran Gershenfeld that provides visual insights from public data on Twitch- a live streaming platform. As an avid user of the platform, I find the visual to be incredibly interesting as it helps map out various communities based on viewer trends! A copy of the high resolution visual is available below:
Per Gershenfeld's Toward Data Science article, he used just a week's snapshot of twitch viewership across the top 100 streams to create an image using Python and the visualization tool Gephi. This visual provides an abundance of information, using a variety of elements to express them! For example, each node reflects a streamer/creator on the platform, which the node's size correlating with their viewership. Additionally, the colors help denote the communities within which each streamer is most closely associated, and the lines between nodes and their thickness correlates with shared viewership and amount/strength of overlap respectively.
It's really interesting to see visual analytics leveraged in creative ways, especially as tied to personal interests!
0 notes
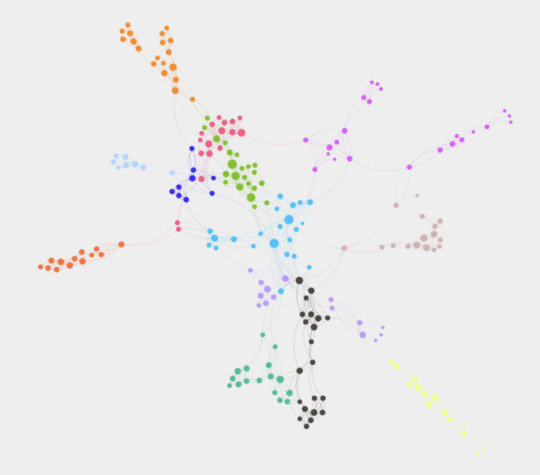
Note
How do you make those graphs and charts, I think they're really neat! Do you have some kind of program or is it just a lot of hard work in an image program?
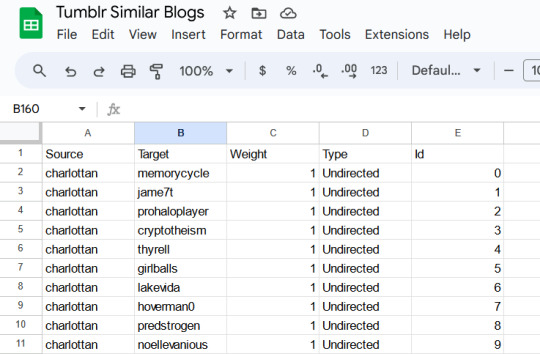
i just make a spreadsheet like this and fill in the Blogs Like This One data and then download into Gephi, my graph program ^-^
59 notes
·
View notes
Text
Fwd: Course: Online.Pangenomics.Apr15-17
Begin forwarded message:
> From: [email protected]
> Subject: Course: Online.Pangenomics.Apr15-17
> Date: 8 December 2023 at 07:17:50 GMT
> To: [email protected]
>
>
>
> Dear all,
>
> Registrations are now open for the 2nd edition of the course "Analysis
> of Prokaryotic Pangenomes" happening from April 15-17, 2024.
>
> Dive into the evolving field of pangenomics and discover the implications
> of genetic variation in closely related prokaryotes. Through theory and
> hands-on practice, you'll explore bacterial genomes, construct pangenomes,
> analyze gene relationships, and more.
>
> Course website: (
> https://ift.tt/UWw9PGb
> )
>
> Program Highlights: Day 1 (Wednesday, 10 am - 6.30 pm Berlin time)
>
> Introduction to pangenomics
>
> Bacterial genomics fundamentals
>
> Genome annotation using Prokka
>
> Pangenome construction using tools like Roary and Panaroo
>
> Day 2 (Thursday, 10 am - 6.30 pm Berlin time)
>
> Relationships between genes in a pangenome
>
> Networks and visualization with Gephi
>
> Running Coinfinder and using Random Forests to predict gene
> presence/absence
>
> Day 3 (Friday, 10 am - 5.30 pm Berlin time)
>
> Final practical: Design your own experiment with provided or personal data
>
> Group discussion on problems and analysis strategies
>
> For the full list of our courses and workshops, please have a look at:
> ( https://ift.tt/PzRM23C )
>
> Best regards, Carlo
>
> Carlo Pecoraro, Ph.D
> Physalia-courses DIRECTOR
> [email protected]
> mobile: +49 17645230846
> Follow us on ( https://ift.tt/n1vk2la )
>
>
>
> "[email protected]"
0 notes
Note
how’d you get into data aggregation and visualization? & what do you use for plotting? I’m an R ggplot enjoyer so I’m curious
i guess i really got into it when i found this site that generates webs of similar artists based on Spotify shared listenerbase data and the associated Gephi software but thats the most advanced i get. its just gephi and google sheets for me i dont even know any R yet
44 notes
·
View notes
Text
Names generated from The Elder Scrolls' Breton names and Old English forenames, excluding the letter "C"
Abera Abien Adelanort Adywyrrya Agnong Agryð Aldard Aleontot Alexant Aline Alleorvart Allin Alolur Alvivin Ambenber Andelley Anreddith Ardereg Aremord Arlinstyr Arodelle Arthibard Asille Asond Asseph Astaudis Astia Astyn Astyrahl Aubeorgan Audistor Augene Augile Auzou...
Babar Barbera Barique Barnara Bashfolre Bastyra Baustyne Bearthel Belan Bellodore Beodaire Berayeorna Berhtmær Berin Berne Berryan Berya Boeuna Boine Boiris Branifyr Broferne Brois Brugavele Brysyliern Daimir Dairie Dalorgan Dastal Daulfgie Daynn Delitine Delvelayn Derry Dette Detternon Dhurand Difyraline Dingh Dolbeoda Dorde Dorrya Dorstine Douzond Dovine Duben Dufola Dultz Dunda Durorgnak Dægent Earard Earbout Edena Edmærb Edrina Edwearey Edwine Eespandel Elairie Elane Elette Elieleon Elielone Ellard Ellere Elloryvan Elynau Emadiste Emiustyvyr Emuna Ennaud Enoise Eopere Eorya Eroxan Ertras Eseriente Estierrya Estonon Etine Evalieryg Evana Evelle Evelline Eveloine Evely Eviely Evyrrin Falip Falysyn Faudie Feliel Feluse Fennovene Ferth Fienort Fierelavo Fierht Floixes Florya Flædmorund Fraoin Fretter Gabezo Gabier Gaele Gaelot Gaelskyr Gaeri Gaeriande Galdranrel Gararique Garoq Gatrandyre Gavebeline Gavelia Gefautrand Gephis Geynis Gimitham Ginaud Ginelette Girena Githyn Gitil Gondayn Gonelsig Gontienew Grane Grenne Griellet Grozone Guele Guina Gustoth Gwine Gwyne Gwyranrie Halard Hamasht Hamernot Harlergine Hawkslarq Heanne Heaurie Heauzabing Helin Hellemps Helouriend Hemont Henrie Hentloq Heredaldel Hernolt Hiellene Hilard Holarg Holor Hugastond Hunesdet Hylous Hywyna Ighouis Ileyoldwyn Illard Imundyvald Inamellou Ingirno Ionnie Irrax Irryð Jadent Jambur Jashsmien Jashstyrah Jasild Jastentis Jearthienn Jehan Jenno Jerananis Jerane Jerton Jeuguy Jolardl Julielle Jutheladri Kaeriste Karelind Karis Karpen Kertin Laistyr Larthier Larwin Lashsle Leauth Legnond Leorheo Lexing Lieven Limord Littannyn Loorle Louare Lozenring Lyeodyven Lynake Lyssan Lyssens Madwynfer Maelixeve Magrane Malauze Malbard Malbeomise Maldamique Malette Mannista Marand Marardine Maratierte Marbera Marbouzint Mariend Marilorene Marinvien Marlaul Marobine Marold Mashry Masimre Mastintond Maten Mathiller Matilley Matthfie Maudeona Maumont Mautine Maxevan Maxever Maxil Maxiseleon Meline Menrialyn Meorylin Mibelle Milban Mitte Miviste Molenna Monariane Mondield Monnen Montan Morettena Morgarth Morht Morier Mortht Moryð Mousse Muien Mundryn Nadnot Naklin Naranise Nauzole Nianierine Nienne Nieny Nitteve Noborine Nurmelmær Nytthalis Ogine Omine Orilzola Oring Orinvie Osaynette Osigafol Oslyr Othelafa Pairrydere Patis Peille Pelasir Penvin Perand Perind Permyn Pertine Phandelian Phele Pierht Pierj Pierra Pilbelle Pilie Pinne Prelles Pujose Pynard Ralanderht Raraneles Rashtrese Rayna Rayne Redam Redræd Reinin Rerri Ribere Robera Rodort Roglael Rolberos Rolda Rommen Rostrane Rothard Rysernis Salynabald Sanne Sebart Senfoles Setteria Shtair Shtwule Sille Slynak Slyne Soringte Sovis Stair Stastand Stianna Stlese Stmurte Store Styria Stystyr Surrina Surthena Swiloin Sybelens Sylver Syvyrrise Tanet Tayet Terie Thard Thelia Thellette Therjaque Thhonona Tibal Tonde Toraiste Torine Trelvie Trierya Trineadne Uleximild Ulrunient Utharierna Vairert Valtz Vanrosan Velgodyne Vergna Verriannan Vierht Viete Vilia Vimoordord Vinis Vintine Vitara Vroldaine Vyris Welle Weodarring Wihtwoor Woodilane Woodique Wuldarie Wuline Wærfal Xandisa Yllever Yssabyvyr Yssant Ysset Ysylvie Yuarjorvie Yvalle Yvyrineque Zavelisa Zazulort Ægenræd Ægmunder Ælfnor Ælfre Ælfweau Ællak Æðelletolm
#444 names#444names#dnd names#fantasy names#name stash#fantasy name#names#markov gen#character names#markovgen
0 notes
Text
Managing Subgraphs: Unlocking Efficiency in Data Analysis
Subgraphs, as a fundamental concept in graph theory and data analysis, offer a powerful means to extract relevant information from complex datasets. Managing subgraphs effectively is crucial for researchers, analysts, and developers seeking to harness the potential of structured data. In this blog post, we will delve into the world of subgraph management, exploring its significance, practical applications, and best practices.
Understanding Subgraphs
A subgraph, in the context of graph theory and data analysis, is a subset of a larger graph that preserves its structural properties and relationships. In simpler terms, it's like zooming in on a specific portion of a complex network to focus on the interactions and connections within that subset.

Subgraphs are commonly used to simplify complex datasets, discover patterns, and extract meaningful insights. They are widely applicable in various domains, including social network analysis, biology, transportation, and computer networks.
The Significance of Subgraph Management
Efficient subgraph management offers several advantages:
Data Reduction: When working with large graphs, subgraphs allow you to narrow your focus to the most relevant data, reducing computational resources and time required for analysis.
Pattern Discovery: Subgraphs are instrumental in uncovering recurring patterns within datasets, which can lead to valuable insights or help identify anomalies.
Network Optimization: Subgraph management is essential for optimizing network performance, identifying bottlenecks, and enhancing overall system efficiency.
Simplification: By isolating specific subgraphs, data complexity is reduced, making it easier to comprehend and work with intricate relationships.
Applications of Subgraph Management
The applications of subgraph management are vast and diverse:
Social Network Analysis: Subgraphs help identify friend circles, influencers, or communities within social networks, aiding in targeted marketing and sociology research.
Biology and Genetics: In biology, subgraphs can represent molecular structures or protein interactions, offering insights into genetic pathways and drug discovery.
Transportation Networks: Subgraphs play a critical role in optimizing traffic flow, identifying critical hubs, and planning transportation systems in urban areas.
Computer Networks: Subgraphs assist in diagnosing network issues, optimizing data routing, and ensuring network security.
Recommendation Systems: In recommendation systems, subgraphs are used to analyze user behavior and suggest relevant content or products based on past interactions.
Best Practices for Subgraph Management
To effectively manage subgraphs, consider these best practices:
Clearly Define Objectives: Begin by defining your objectives and the specific aspects of the dataset you want to explore. This clarity will guide your subgraph creation and analysis.
Choose the Right Tools: Use graph database systems or specialized graph analysis libraries to manage and work with subgraphs efficiently. Popular choices include Neo4j, NetworkX, and Gephi.
Optimize Query Performance: When querying subgraphs, ensure that your query language or code is optimized for performance, as large datasets can be resource-intensive.
Regular Maintenance: Periodically update and maintain your subgraphs to keep them relevant, especially if you're working with dynamic data sources.
Documentation: Document your subgraph management process, including the rationale behind subgraph selection and any transformations applied to the data.
Scalability: Consider the scalability of your subgraph management solution, especially if you're dealing with rapidly growing datasets.
Challenges and Future Trends
While subgraph management offers numerous benefits, it also comes with challenges. These include selecting the right subgraphs, dealing with evolving data sources, and ensuring scalability.
Looking to the future, innovations in graph database technology, machine learning, and distributed computing are likely to enhance subgraph management capabilities. These advancements will enable more efficient handling of ever-expanding datasets, leading to more profound insights and discoveries across various domains.
In conclusion, effective subgraph management is a fundamental skill for anyone working with complex datasets and graphs. It empowers data professionals to extract valuable insights, uncover hidden patterns, and optimize systems. As the world continues to generate increasingly complex data, mastering the art of subgraph management will become an indispensable skill in the toolkit of data analysts and researchers, driving innovation and discovery in countless fields.
1 note
·
View note
Last Seen Blogs

lymil
Untitled

deathmetalboyfriend
All flowers in time bend towards the sun

coeurinterdit
coeurinterdit ♡

squishies
squishy

lookforbifun
Bi Curious M