#npm audit fix
Text
Me, installing some packages:: 6 vulnerabilities (2 moderate, 4 high)
To address issues, run npm audit fix --force
Me, typing, like a stupid, idiot baby::
npm audit fix --force
131 vulnerabilities (1 low, 104 moderate, 22 high, 4 CRITICAL)
#previously on claires life#web development#web dev#fuck package management worst part of my day by far#and this is gonna be a Serious Project handling sensitive data sooo#cant have any vulnerabilities
0 notes
Text
Node.js Security Best Practices

Quick summary: This article presents guidelines for Node.js developers to follow to secure their applications against potential vulnerabilities arising from the use of third-party tools. It complies with essential guidelines, which we will refer to as Node.js security best practices, to ensure the security of Node.js applications.
What is Nodejs?
Node.js is a runtime environment that enables developers to use JavaScript beyond web browsers (or the front end) using various frameworks. It runs on Chrome’s V8 engine, allowing JavaScript developers to apply their skills to back-end development using the same language.
What is Nodejs Security?
While Nodejs is secure itself, it relies on open-source packages as in the fast-paced world, companies and developers do not want to invest their in reinventing the wheel. The packages make development easy and fast. However, this convenience can also introduce vulnerabilities in the application.
NPM, an open-source platform containing over two million packages, serves as a valuable resource by providing millions of packages to JavaScript developers. On the one hand, it makes it easy to use packages. On the other hand, it may pose potential risks.
Node.js developers heavily depend on open-source third-party packages.
In 2021, 77 percent of respondents from the United States report using open source to modernize their IT infrastructure, a report from Statista shows.
Despite the fact that over 78% of organizations make use of open-source projects, only about 40% of organizations use formal security rating tools to assess the security of these packages, while only about 27% of open-source projects are audited on a regular basis, a report reveals.
Like others, Nodejs applications are vulnerable to security breaches. Therefore, it becomes imperative to take the necessary steps to enforce strong security measures.
This article is a compilation of tips and advice from experts on how to secure Node.js applications. However, if you need technical assistance to enforce strong security measures on your existing Nodejs app, you can check out our Nodejs development services. Our team of professional IT experts will thoroughly assess your application for security vulnerabilities.
Best Practices for Nodejs Security
1. Enable Strong Authentication Method
Strong authentication is all about implementing the latest security measures to safeguard sensitive pieces of information. As you know, data breaches are no longer a rarity. They are a daily occurrence, and even the biggest tech companies are not immune. In recent years, Google, Twitter, and other big-name companies have all experienced data breaches that led to them redefining their authentication mechanism. Here are a few methods to be considered:
Limit login attempts in a fixed period of time.
Enables mandatory two-factor authentication to access sensitive data and services.
Enable more than a basic authentication — choose standard authentication methods like OAuth, OpenID, etc.
Implement strong password policies for user management and operations.
2. Make Use of Security-related plugins
These tools help you identify security weaknesses such as unsafe RegEx, unsafe use of eval(), use of non-literal filenames, etc., in your node applications when you write code. Overall, they can help detect these security flaws easily.
Eslint and Tslint are well-known code analytics tools for JavaScript and TypeScript projects for security checks in Node applications.

3. Limit concurrent requests
Limiting concurrent requests helps prevent Nodejs applications from being unresponsive due to overwhelming requests at the same time. By using a middleware or balancer, you can limit the number of requests. Ngnix is a widely used service for load balancing; however, you can also make use of middleware express-rate-limiter or rate-limiter-flexible package.
4. Avoid blocking the Event Loop
Nodejs includes EventLoop to run JavaScript code and Worker Pool for intensive tasks, which makes it a scalable platform that can handle too many requests. All incoming requests and outgoing responses flow through the Event Loop.
Node.js leverages V8 (JavaScript engine) for code executions, which is fairly fast for many common operations. However, if callbacks have large complexities or regexp and JSON operations occur in your program, it can lead to Event Loop blocking.
The common issues that may trigger Event Loop blocking are vulnerable regular expressions. Follow the below tips to avoid Event Loop blocking.
Use asynchronous operation whenever possible. Node can fairly handle asynchronous I/O operations.
Offload the CPU-intensive tasks to prevent blocking.
Complex regular expressions can lead to catastrophic backtracking; therefore, keep your regular expressions simple.
Use promises and async/await
As described above, middleware can help your performance of various operations efficiency; they can also lead to blocking. Don’t use unnecessary middleware.
Reduce the complexity of the callbacks.
Read more at https://www.brilworks.com/blog/node-js-security-best-practices/
0 notes
Video
youtube
PageSpeed Insight Update | What is new in Lighthouse 11
Lighthouse is a website auditing tool that provides developers with chances and diagnostics to improve their sites' user experience.
Lighthouse 11 is instantly available on the command line through npm, in Chrome Canary, and in PageSpeed Insights. Chrome 118 will include it in the stable.
Lighthouse is an open-source, automated tool for enhancing web page quality. You can use it on any web page, whether it is public or requires authentication. It includes audits for performance, accessibility, progressive web apps, SEO, and other factors.
Lighthouse can be executed through Chrome DevTools, from the command line, or as a Node module. Lighthouse receives a URL to audit, performs a series of audits on the page, and then generates a report on how well the page performed. Then, use the failing audits to determine how to enhance the page. Each audit contains a reference document that explains why the audit is essential and how to fix it.
If You want to Increase website visibility and traffic and Need SEO Services for your website.
Contact Us for SEO services and Social Media management:-
If you need any assistance so you can contact the US:-
Email: [email protected]
Contact: 7530817898
#lighthouse11 #lighthouse10 #pagespeed #pagespeedinsights #websitespeed #chrome #chromedevtools #inspect #urlaudit #websiteauditingtool #audit #websiteaudit #googleupdates #developers #websiteoptimization #connections #websitedevelopment
0 notes
Text
This Week in Rust 479
Hello and welcome to another issue of This Week in Rust! Rust is a programming language empowering everyone to build reliable and efficient software. This is a weekly summary of its progress and community. Want something mentioned? Tag us at @ThisWeekInRust on Twitter or @ThisWeekinRust on mastodon.social, or send us a pull request. Want to get involved? We love contributions.
This Week in Rust is openly developed on GitHub. If you find any errors in this week's issue, please submit a PR.
Updates from Rust Community
Official
Officially announcing the types team
Diversifying our Content Delivery Networks
Foundation
Lars Bergstrom Elected as Rust Foundation Board of Directors Chair
Join the Rust Foundation at Rust Nation UK 2023
Newsletters
Project/Tooling Updates
rust-analyzer changelog #165
hyper-ish 2022 in review
Mobc 0.8.1 release with improved stability
Zenoh 0.7.0, a pure Rust Pub/Sub/Query protocol for cloud-to-thing continuum, was released and it is packed with new features.
Fornjot (code-first CAD in Rust) - Weekly Release
Slint 0.3.4 release
Astra: A Blocking HTTP Server Built on Top of Hyper
First steps with NGenate - A dataflow and visual programming platform built with rust
toml vs toml_edit
This Week in Fyrox #11
The year 2022 in Dimforge and our objectives for 2023
Observations/Thoughts
Rust in 2023: Growing up
The State of Developer Ecosystem 2022 in Rust: Discover recent trends
The size of Rust Futures
Capability-Safety I: Prelude
Surprises in the Rust JSON Ecosystem
The Git source code audit, viewed as a Rust programmer
Turning a Rust struct into an enum is not always a major breaking change
14 Rust Tools for Linux Terminal Dwellers
[audio] Rust Magazine with Shuang Zhu
[audio] Rust Nation with Ernest Kissiedu
Rust Walkthroughs
Temporary Values, Borrowing, and Lifetimes
Due to limitations in the borrow checker, this implies a 'static lifetime
Rust concepts I wish I learned earlier
Comparative fuzzing in Rust
domain-specific error macros
Building a Simple DB in Rust - Part 2 - Basic Execution
Rust FFI and cbindgen: Integrating Embedded Rust Code in C
Research
Miscellaneous
The crates.io registry is now a GitHub secret scanning integrator
Six fun things to do with Rust operator overloading
Packaging Rust Applications for the NPM Registry
Announcing Rust Support in CodeSandbox
[video] 10 Reasons Not To Use Rust (The Whole Truth)
[video] Sneaking By The Rust Borrow Checker - Interior Mutability
Crate of the Week
This week's crate is Darkbird, a mnesia-inspired high concurrency, real time, in-memory storage library.
Thanks to DanyalMh for the self-suggestion!
Please submit your suggestions and votes for next week!
Call for Participation
Always wanted to contribute to open-source projects but did not know where to start? Every week we highlight some tasks from the Rust community for you to pick and get started!
Ockam - Implement 'ockam node logs' CLI command
Ockam - Implement 'ockam worker list' CLI command
Ockam - Add a CI check to avoid conflicts in 'TypeTag' ids
If you are a Rust project owner and are looking for contributors, please submit tasks here.
Updates from the Rust Project
378 pull requests were merged in the last week
llvm-wrapper: adapt for LLVM API change
enable sanitizers for s390x-linux
put noundef on all scalars that don't allow uninit
add 'static lifetime suggestion when GAT implied 'static requirement from HRTB
add raw identifier for keyword in suggestion
check ADT fields for copy implementations considering regions
constify TypeId ordering impls
diagnostics: suggest changing s@self::{macro}@::macro for exported
dont randomly use _ to print out const generic arguments
drop tracking Visit break expressions
encode const mir for closures if they're const
fix check macro expansion
label closure captures/generator locals that make opaque types recursive
lazy dominator tree construction in borrowck
make CastError::NeedsDeref create a MachineApplicable suggestion
make error emitted on impl &Trait nicer
refactor basic blocks control flow caches
simplify derive(Debug) output for fieldless enums
suggest remove deref for type mismatch
suggestion for attempted integer identifier in patterns
tweak "borrow closure argument" suggestion
unify stable and unstable sort implementations in same core module
use UnordMap and UnordSet for id collections (DefIdMap, LocalDefIdMap, etc)
various cleanups around pre-TyCtxt queries and functions
add heapsort fallback in select_nth_unstable
implement alloc::vec::IsZero for Option<$NUM> types
lift T: Sized bounds from some strict_provenance pointer methods
add Arc::into_inner for safely discarding Arcs without calling the destructor on the inner type
hashbrown: provide default hasher types to Vacant and Occupied entries
futures: add Either::as_pin_mut and Either::as_pin_ref
futures: implement FusedStream for all streams in ReadyChunks
(cherry-pick) WebAssembly multivalue stackify fix
cargo: stabilize sparse-registry
cargo: wrapper type for data that should never be logged
rustfmt: correct span for structs with const generics
clippy: add multiple_unsafe_ops_per_block lint
clippy: add machine applicable suggestion for bool_assert_comparison
clippy: fix false positive in unnecessary_safety_comment
clippy: fix suggestion in transmutes_expressible_as_ptr_casts when the source type is a borrow
rust-analyzer: don't escape non-snippets in assist
rust-analyzer: don't respond with a ContentModified while loading the workspace
rust-analyzer: fix checkOnSave to check config patching not always working
rust-analyzer: fix markdown removal in hover handling whitespace weirdly
rust-analyzer: handle slice patterns in "Fill match arms"
rust-analyzer: more precise binop inference
rust-analyzer: substitute vscode variables in config.serverPath
rust-analyzer: parse const_closures syntax
rust-analyzer: replace SmolStr usage with lang item enum for lang items
rust-analyzer: use workspace.dependencies to declare local dependencies
Rust Compiler Performance Triage
Largely a win for compiler performance with 100 test cases in real-world crates showing some sort of change in performance with an average 1% improvement. These wins were a combination of many different changes including how doc(hidden) gets more efficiently encoded in metadata, some optimizations in the borrow checker, and simplification of the output from derive(Debug) for fieldless enums.
Triage done by @rylev. Revision range: 1f72129f..c8e6a9e8
Summary:
(instructions:u) mean range count Regressions ❌
(primary) 0.4% [0.2%, 0.7%] 19 Regressions ❌
(secondary) 0.9% [0.2%, 1.5%] 34 Improvements ✅
(primary) -1.3% [-17.2%, -0.2%] 81 Improvements ✅
(secondary) -2.1% [-7.1%, -0.2%] 64 All ❌✅ (primary) -1.0% [-17.2%, 0.7%] 100
2 Regressions, 5 Improvements, 3 Mixed; 1 of them in rollups 34 artifact comparisons made in total
Full report here
Approved RFCs
Changes to Rust follow the Rust RFC (request for comments) process. These are the RFCs that were approved for implementation this week:
No RFCs were approved this week.
Final Comment Period
Every week, the team announces the 'final comment period' for RFCs and key PRs which are reaching a decision. Express your opinions now.
RFCs
No RFCs entered Final Comment Period this week.
Tracking Issues & PRs
[disposition: merge] Autotrait bounds on dyn-safe trait methods
[disposition: close] Stabilize ControlFlow::{BREAK, CONTINUE}
[disposition: merge] Add missing normalization for union fields types
[disposition: merge] rustdoc: change trait bound formatting
New and Updated RFCs
[new] Cargo target features
[new] Avoid non-local definitions in functions
Call for Testing
An important step for RFC implementation is for people to experiment with the implementation and give feedback, especially before stabilization. The following RFCs would benefit from user testing before moving forward:
No RFCs issued a call for testing this week.
If you are a feature implementer and would like your RFC to appear on the above list, add the new call-for-testing label to your RFC along with a comment providing testing instructions and/or guidance on which aspect(s) of the feature need testing.
Upcoming Events
Rusty Events between 2023-01-25 - 2023-02-22 🦀
Virtual
2023-01-25 | Virtual (Redmond, WA, US; San Francisco, CA, US) | Microsoft Reactor Redmond | Microsoft Reactor San Francisco
Primeros pasos con Rust: QA y horas de comunidad | San Francisco Mirror
2023-01-26 | Virtual (Charlottesville, VA, US) | Charlottesville Rust Meetup
Rust Lightning Talks!
2023-01-26 | Virtual (Karlsruhe, DE) | The Karlsruhe Functional Programmers Meetup Group
Stammtisch (gemeinsam mit der C++ UG KA)
2023-01-26 | Virtual (Redmond, WA, US; San Francisco, CA, US; New York, NY, US; Stockholm, SE) | Microsoft Reactor Redmond and Microsoft Reactor New York and Microsoft Reactor San Francisco and Microsoft Reactor Stockholm
Crack code interview problems in Rust - Ep. 3 | New York Mirror | San Francisco Mirror | Stockholm Mirror
2023-01-27 | Virtual (Tunis, TN) | Rust Meetup Tunisia
Rust Meetup Tunisia - Volume I, Number I
2023-01-30 | Virtual (Redmond, WA, US; New York, NY, US; San Francisco, CA, US) | Microsoft Reactor Redmond and Microsoft Reactor New York and Microsoft Reactor San Francisco
Primeros pasos con Rust - Control de errores en Rust | New York Mirror | San Francisco Mirror
2023-01-31 | Virtual (Berlin, DE) | OpenTechSchool Berlin
Rust Hack and Learn
2023-01-31 | Virtual (Dallas, TX, US) | Dallas Rust
Last Tuesday
2023-01-31 | Virtual (Redmond, WA, US; New York, NY, US; San Francisco, CA, US) | Microsoft Reactor Redmond and Microsoft Reactor New York and Microsoft Reactor San Francisco
Primeros pasos con Rust - Compresión de cómo Rust administra la memoria | New York Mirror | San Francisco Mirror
2023-02-01 | Virtual (Cardiff, UK) | Rust and C++ Cardiff
New Year Virtual Social + Share
2023-02-01 | Virtual (Indianapolis, IN, US) | Indy Rust
Indy.rs - with Social Distancing
2023-02-01 | Virtual (Redmond, WA, US; New York, NY, US; San Francisco, CA, US) | Microsoft Reactor Redmond and Microsoft Reactor New York and Microsoft Reactor San Francisco
Primeros pasos con Rust: QA y horas de comunidad | New York Mirror | San Francisco Mirror
2023-02-01 | Virtual (Stuttgart, DE) | Rust Community Stuttgart
Rust-Meetup
2023-02-06 | Virtual (Redmond, WA, US; New York, NY, US; San Francisco, CA, US) | Microsoft Reactor Redmond and Microsoft Reactor New York and Microsoft Reactor San Francisco
Primeros pasos con Rust - Implementación de tipos y rasgos genéricos | New York Mirror | San Francisco Mirror
2023-02-07 | Virtual (Beijing, CN) | WebAssembly and Rust Meetup (Rustlang)
Monthly WasmEdge Community Meeting, a CNCF sandbox WebAssembly runtime
2023-02-07 | Virtual (Buffalo, NY, US) | Buffalo Rust Meetup
Buffalo Rust User Group, First Tuesdays
2023-02-07 | Virtual (Redmond, WA, US; New York, NY, US; San Francisco, CA, US) | Microsoft Reactor Redmond and Microsoft Reactor New York and Microsoft Reactor San Francisco
Primeros pasos con Rust - Módulos, paquetes y contenedores de terceros | New York Mirror | San Francisco Mirror
2023-02-08 | Virtual (Redmond, WA, US; New York, NY, US; San Francisco, CA, US) | Microsoft Reactor Redmond and Microsoft Rector New York and Microsoft Reactor San Francisco
Primeros pasos con Rust: QA y horas de comunidad | New York Mirror | San Francisco Mirror
2023-02-11 | Virtual | Rust GameDev
Rust GameDev Monthly Meetup
2023-02-13 | Virtual (Redmond, WA, US; New York, NY, US; San Francisco, CA, US) | Microsoft Reactor Redmond and Microsoft Rector New York and Microsoft Reactor San Francisco
Primeros pasos con Rust - Escritura de pruebas automatizadas | New York Mirror | San Francisco Mirror
2023-02-14 | Virtual (Berlin, DE) | OpenTechSchool Berlin
Rust Hack and Learn
2023-02-14 | Virtual (Redmond, WA, US; New York, NY, US; San Francisco, CA, US) | Microsoft Reactor Redmond and Microsoft Rector New York and Microsoft Reactor San Francisco
Primeros pasos con Rust - Creamos un programa de ToDos en la línea de comandos | San Francisco Mirror | New York Mirror
2023-02-14 | Virtual (Saarbrücken, DE) | Rust-Saar
Meetup: 26u16
2023-02-15 | Virtual (Redmond, WA, US; New York, NY, US; San Francisco, CA, US; São Paulo, BR) | Microsoft Reactor Redmond and Microsoft Rector New York and Microsoft Reactor San Francisco and Microsoft Reactor São Paulo
Primeros pasos con Rust: QA y horas de comunidad | San Francisco Mirror | New York Mirror | São Paulo Mirror
2023-02-15 | Virtual (Vancouver, BC, CA) | Vancouver Rust
Rust Study/Hack/Hang-out
Asia
2023-02-01 | Kyoto, JP | Kansai Rust
Rust talk: How to implement Iterator on tuples... kind of
Europe
2023-01-25 | Paris, FR | Rust Paris
Rust Paris meetup #55
2023-01-26 | Copenhagen, Dk | Copenhagen Rust Meetup Group
Rust Hack Night #32
2023-02-02 | Berlin, DE | Prenzlauer Berg Software Engineers
PBerg engineers - inaugural meetup; Lukas: Serverless APIs using Rust and Azure functions (Fee)
2023-02-02 | Hamburg, DE | Rust Meetup Hamburg
Rust Hack & Learn February 2023
2023-02-02 | Lyon, FR | Rust Lyon
Rust Lyon meetup #01
2023-02-04 | Brussels, BE | FOSDEM
FOSDEM 2023 Conference: Rust devroom
2023-02-21 | Zurich, CH | Rust Zurich
Practical Cryptography - February Meetup (Registration opens 7 Feb 2023)
North America
2023-01-26 | Lehi, UT, US | Utah Rust
Building a Rust Playground with WASM and Lane and Food!
If you are running a Rust event please add it to the calendar to get it mentioned here. Please remember to add a link to the event too. Email the Rust Community Team for access.
Jobs
Please see the latest Who's Hiring thread on r/rust
Quote of the Week
Rust has demonstrated that you using a type system as a vehicle for separation logic works, even in imperative languages, and it's nothing as arcane as those immutable functional predecessors would suggest. It did this by making sure the language defines a type system that helps you, by making sure core properties of soundness can be expressed in it.
soundness requirement for memory access: lifetimes
soundness requirements for references with value semantics: > &/&mut _
soundness requirements for resources: Copy and Drop
making sure your logic is monotic: traits instead of inheritance, lack of specialization (yes, that's a feature).
(notably missing: no dependent types; apparently not 'necessary' but I'm sure it could be useful; however, research is heavily ongoing; caution is good)
This allows the standard library to encode all of its relevant requirements as types. And doing this everywhere is its soundness property: safe functions have no requirements beyond the sum of its parameter type, unsafe functions can. Nothing new or special there, nothing that makes Rust's notion of soundness special.
Basing your mathematical reasoning on separation logic makes soundness reviews local instead of requiring whole program analysis. This is what makes it practical. It did this pretty successfully and principled, but did no single truly revolutionary thing. It's a sum of good bits from the last decade of type system research. That's probably why people refer to it as 'the soundness definition', it's just a very poignant way to say: "we learned that a practical type systems works as a proof checker".
– HeroicKatora on /r/cpp
Thanks to Stephan Sokolow for the suggestion!
Please submit quotes and vote for next week!
This Week in Rust is edited by: nellshamrell, llogiq, cdmistman, ericseppanen, extrawurst, andrewpollack, U007D, kolharsam, joelmarcey, mariannegoldin, bennyvasquez.
Email list hosting is sponsored by The Rust Foundation
Discuss on r/rust
0 notes
Text
How to fix npm audit fix issues?
┌───────────────┬──────────────────────────────────────────────────────────────┐│ Low │ Prototype Pollution │├───────────────┼──────────────────────────────────────────────────────────────┤│ Package │ lodash │├───────────────┼──────────────────────────────────────────────────────────────┤│ Patched in │ >=4.17.5 │├───────────────┼──────────────────────────────────────────────────────────────┤│ Dependency of │ react-native-cached-image │├───────────────┼──────────────────────────────────────────────────────────────┤│ Path │ react-native-cached-image > lodash │├───────────────┼──────────────────────────────────────────────────────────────┤│ More info │ https://npmjs.com/advisories/577 │└───────────────┴──────────────────────────────────────────────────────────────┘found 11 vulnerabilities (2 low, 8 moderate, 1 high) in 26316 scanned packages 11 vulnerabilities require manual review. See the full report for details.
This shows up when I try to npm install, and all of them required manual review. I've tried to visit this to check for more info and apparently it's because my lodash is of version 4.17.4. So I've then run npm install --save [email protected] and checked my package.json to make sure it's reflecting correctly.
However, it seems the vulnerabilities is still there. Wondering if I fix it the wrong way?
As per requested, the body of package.json
"dependencies": { "lodash": "^4.17.5",}
https://codehunter.cc/a/reactjs/how-to-fix-npm-audit-fix-issues
0 notes
Text
v6.1.0-next.0
Look at that! A feature bump! npm@6 was super-exciting not just because it used a bigger number than ever before, but also because it included a super shiny new command: npm audit. Well, we've kept working on it since then and have some really nice improvements for it. You can expect more of them, and the occasional fix, in the next few releases as more users start playing with it and we get more feedback about what y'all would like to see from something like this.
I, for one, have started running it (and the new subcommand...) in all my projects, and it's one of those things that I don't know how I ever functioned without it! This will make a world of difference to so many people as far as making the npm ecosystem a higher-quality, safer commons for all of us.
This is also a good time to remind y'all that we have a new RFCs repository, along with a new process for them. This repo is open to anyone's RFCs, and has already received some great ideas about where we can take the CLI (and, to a certain extent, the registry). It's a great place to get feedback, and completely replaces feature requests in the main repo, so we won't be accepting feature requests there at all anymore. Check it out if you have something you'd like to suggest, or if you want to keep track of what the future might look like!
NEW FEATURE: npm audit fix
This is the biggie with this release! npm audit fix does exactly what it says on the tin. It takes all the actionable reports from your npm audit and runs the installs automatically for you, so you don't have to try to do all that mechanical work yourself!
Note that by default, npm audit fix will stick to semver-compatible changes, so you should be able to safely run it on most projects and carry on with your day without having to track down what breaking changes were included. If you want your (toplevel) dependencies to accept semver-major bumps as well, you can use npm audit fix --force and it'll toss those in, as well. Since it's running the npm installer under the hood, it also supports --production and --only=dev flags, as well as things like --dry-run, --json, and --package-lock-only, if you want more control over what it does.
Give it a whirl and tell us what you think! See npm help audit for full docs!
3800a660d Add npm audit fix subcommand to automatically fix detected vulnerabilities. (@zkat)
OTHER NEW audit FEATURES
1854b1c7f #20568 Add support for npm audit --json to print the report in JSON format. (@finnp)
85b86169d #20570 Include number of audited packages in npm install summary output. (@zkat)
957cbe275 [email protected]: Overhaul audit install and detail output format. The new format is terser and fits more closely into the visual style of the CLI, while still providing you with the important bits of information you need. They also include a bit more detail on the footer about what actions you can take! (@zkat)
NEW FEATURE: GIT DEPS AND npm init <pkg>!
Another exciting change that came with npm@6 was the new npm init command that allows for community-authored generators. That means you can, for example, do npm init react-app and it'll one-off download, install, and run create-react-app for you, without requiring or keeping around any global installs. That is, it basically just calls out to npx.
The first version of this command only really supported registry dependencies, but now, @jdalton went ahead and extended this feature so you can use hosted git dependencies, and their shorthands.
So go ahead and do npm init facebook/create-react-app and it'll grab the package from the github repo now! Or you can use it with a private github repository to maintain your organizational scaffolding tools or whatnot. ✨
483e01180 #20403 Add support for hosted git packages to npm init <name>. (@jdalton)
BUGFIXES
a41c0393c #20538 Make the new npm view work when the license field is an object instead of a string. (@zkat)
eb7522073 #20582 Add support for environments (like Docker) where the expected binary for opening external URLs is not available. (@bcoe)
212266529 #20536 Fix a spurious colon in the new update notifier message and add support for the npm canary. (@zkat)
5ee1384d0 #20597 Infer a version range when a package.json has a dist-tag instead of a version range in one of its dependency specs. Previously, this would cause dependencies to be flagged as invalid. (@zkat)
4fa68ae41 #20585 Make sure scoped bundled deps are shown in the new publish preview, too. (@zkat)
1f3ee6b7e [email protected]: Stop dropping size from metadata on npm cache verify. (@jfmartinez)
91ef93691 #20513 Fix nested command aliases. (@mmermerkaya)
18b2b3cf7 [email protected]: Make sure different versions of the Path env var on Windows all get node_modules/.bin prepended when running lifecycle scripts. (@laggingreflex)
DOCUMENTATION
a91d87072 #20550 Update required node versions in README. (@legodude17)
bf3cfa7b8 Pull in changelogs from the last npm@5 release. (@iarna)
b2f14b14c #20629 Make tone in publishConfig docs more neutral. (@jeremyckahn)
DEPENDENCY BUMPS
5fca4eae8 [email protected] (@75lb)
d9ef3fba7 [email protected] (@isaacs)
f1baf011a [email protected] (@simonv)
005fa5420 [email protected] (@iarna)
1becdf09a [email protected] (@isaacs)
#npm audit fix#fresh security feeling#push button receive security#all aboard the npm6 feature train#npm6#so pretty#npm init is awesome now
4 notes
·
View notes
Text
@tototavros Oh, actually, I should point out the two things that make JavaScript cursed that actually still do apply to TypeScript:
1. smoosh-gate
If you release a new browser version, and it doesn’t work on a popular website, people will stop using your browser. Therefore, no one does that, so it’s impossible to remove a JavaScript feature that already exists.
One JavaScript feature that already exists is that you can add new functions to existing classes. So, for instance, you could write a library that makes the function `array.flatten` flatten an array. Then, if you wanted to release a browser update that also added an `array.flatten` function that flattened an array, it would make websites using that library stop working.
TC39 (the leaders of JavaScript) made a post saying that they would fix by calling the official function `array.smoosh` instead. Developers were very unhappy about this, so they eventually settled on `array.flat`.
A lot of functions have weird names because of problems like this, such as `array.includes` instead of the more logical `array.contains`, `element of array` instead of the more logical `element in array`, and `array[Symbol.iterator]` instead of the more logical `array.iterator`.
2. leftpad-gate
JavaScript, for a long time, had a very small list of built-in functions, which is why people had to write their own `array.contains` functions (leading to those compatibility issues mentioned above).
Somewhat relatedly, JavaScript programmers prefer a lot of small libraries to a few big libraries. If you want to create a React app the usual way, by running create-react-app, it will install literally one thousand two hundred and seven (1207) libraries, before you write even a single line of your own code and include your own dependencies.
And if one of those 1207 subdependencies, such as left-pad, has a maintainer that wants to stop working on it and delete it, well, your project will simply stop working. This has happened once, breaking a bunch of things including all React apps, before NPM added the rule “you can’t delete your own projects if they’re popular”.
This rule fixes that problem, but it doesn’t fix the related problem of “what if someone adds malware to one of those 1207 subdependencies? Do you really trust all 1207 of them? Have you audited them all yourself?” The answer is of course not, as a bunch of people discovered when one of them tried to steal bitcoins from your computer.
Anyway, this is not to say “don’t use TypeScript”. Most languages suck in one way or another, and I still think TypeScript sucks the least for the widest variety of use-cases.
15 notes
·
View notes
Text
0 notes
Text
Checking mobile site speed and SEO with Google Lighthouse
With Lighthouse you have a new Google tool for checking mobile site speed and SEO. In this post, I explain what this tool is and how to use it to improve the performance of your site.
Lighthouse is a page experience tool built by Google and was initially meant to audit Progressive Web Apps (PWA). The tool executes five audits for accessibility, performance, SEO, Progressive Web Apps and an extended list of best practices. Powered by the new Core Web Vitals, these audits together give you an excellent overview of the quality and performance of your mobile website as well as your desktop site, or web app.
Lighthouse for PureSourceCode.com: we have to work on that
Site speed is all about perception and user experience. Speed in numbers means nothing if your site still feels slow. Loads of users around the world are on rather crappy mobile connections of 3G or less. Even with lightning-fast 5G connections, a site can simply feel laggy and slow. And we all know what a devastating effect a slow site can have on your conversion. Shaving milliseconds of the time needed to load your site could make a world of difference. Not to mention the frustration that happens when a slow-loading ad pushes down the button you just wanted to click.
While testing, Google Lighthouse simulates visiting your mobile site via a flaky 3G connection on a slightly underpowered device. Packets are lost in an attempt to simulate real-world conditions as authentically as possible. These insights are combined with other data. After running the test, you’ll get a report with a score and actionable advice with issues to tackle.
PageSpeed Insights vs. Google Lighthouse
PageSpeed Insights is probably the most used site speed analysis tool out there. It gives you a nice score and a list of possible improvements, plus it gives you an idea of the perceived loading speed of your site.
Also, PageSpeed Insights gives recommendations and identifies opportunities to improve the performance of your page. Some of these do tend to be hard implement, so getting a 100/100 is a pipe dream for most sites.
PageSpeed Insights and Lighthouse used to be two different tools for the job. They both provided valuable insights, but were hard to combine. With the advent of Web Vitals and the page experience update, Google improved the metrics across the board. Not only did they become easier to understand, they were also shared metrics. Of course, each tool is made for a specific subtask and offers specific metrics. These metrics come from different environments.
Field data vs. lab data
Web Vitals introduced new ways of determining performance. Some of these metrics can be calculated in a lab setting — simulated, so to say, while other metric only make sense if there are tested and collected in the field. In addition, some metrics work well in both settings. Google page experience tools use a variety of the metrics to provide you with the data you need to improve your site.
If you look closely, you’ll notice that some metrics only work in lab tools like the Developer Tools and Lighthouse. The field metrics appear in tools like the Web Vitals report in Search Console and PageSpeed Insights. The Core Web Vitals like LCP, FID and CLS will work everywhere.
Core Web Vitals
The brand-new Core Web Vitals will appear in all Google tools that measure site speed, performance and experience — even in the new Web Vitals report in Search Console. Now, you simply have to understand three basic metrics to get a sense of how your site or specific pages are performing. These Core Web Vitals are:
LCP, or Largest Contentful Paint: Or, how long it takes for the largest content element you see in the viewport to load.
FID, or First Input Delay: Or, how long it takes for a browser to respond to an interaction first triggered by the user (clicking a button, for instance)
CLS, or Cumulative Layout Shift: Or, how much of the screen is affected by movement — i.e. does stuff jump around on screen?
These new Web Vitals take a much more practical approach and put user experience front and center. The tools visit your site over a throttled connection on an average device so it can emulate what a real visitor in the real world might experience. Instead of just loading your site like the classic speed tools used to do, these Web Vitals-powered tools check how and when it responds to input — and if stuff happens after the initial load. It finds the exact moment when your content is ready to use, so you can try and optimize that when it feels too slow. Plus, you can find annoyances that hinder a good page experience.
Also, keep in mind that Lighthouse not only measures performance, but also checks SEO, various best practices and accessibility. It is a complete tool that helps you improve your site holistically.
What to look for in Lighthouse results
As I said, Google Lighthouse is trying more realistic angle, taking page experience into account checking mobile site speed and SEO.
The whole concept of speeding up your mobile site is two-pronged; your site must be fast, and it must feel fast. You, therefore, need to get your content on screen as fast as possible. Don’t let people wait. Also, users must be able to interact with your content as soon as possible. Since Google announced that page speed and page experience are ranking factors for SEO, you need to fix these issues.
What should your priority be? Load your content first. Awesome graphics and killer animations can wait. Your message – and what people are looking for – is most likely in the content. You can load the rest of the content in the background and ease it on the screen later on.
Performance metrics used by Lighthouse 6.0
While measuring the performance of your site, Lighthouse 6.0 uses the following metrics:
First Contentful Paint: FCP measures how long it takes the browser to render the first piece of DOM content after a user navigates to your page. This includes, images, non-white <canvas> elements, and SVGs but excludes stuff inside an iframe.
Speed Index: The Speed Index measures how quickly content is visually displayed during page load.
Largest Contentful Paint: The LCP is all about how long it takes for the largest content object (for instance, an image or a block of text) to load. This is one of the most important new metrics. Here, having a good score means users perceive your site as loading quickly.
Time to Interactive: TTI measures the time it takes from loading the page to when it is capable of reliably responding to user input quickly. The page might look quick to load, only to find that pushing some buttons doesn’t do anything yet.
Total Blocking Time: The TBT measures the time between the FCP and TTI where blockades can happen, preventing responsiveness.
Cumulative Layout Shift: The CLS looks at the number of layout shifts that happen during the full loading process of the page. Every time an element jumps around on the screen from frame to frame, this counts as a layout shift. Remember those nasty ads that load at the last moment?
You can see how your score is calculated by going to the Lighthouse Scoring Calculator:

Lighthouse Scoring Calculator
The Lighthouse report also features some opportunities to improve the site speed of your mobile site, including how much loading time they will save. These include reducing render-blocking stylesheets, render-blocking scripts, properly sizing images and fixing offscreen images.
The Lighthouse SEO check
Lighthouse doesn’t do just performance, it also has an accessibility test, suggestions on improving your site based on best practices and a PWA analysis. Another cool Lighthouse feature is the basic SEO check. With this check, you can run a simple SEO audit to uncover basic SEO issues a site may have. It gives you suggestions to fix them as well. Since Lighthouse runs locally in your browser, you can run the checks on your staging environment as well.
Currently, Lighthouse checks:
The mobile-friendliness of a page
If the structured data is valid
Does it have a <meta name="viewport"> tag with width or initial-scale
Does the document have a <title> element?
Is there a meta description?
Does the page have a successful HTTP status code?
Do links have descriptive anchor text?
Does the document use legible font sizes?
Is page not blocked from indexing?
Is the robots.txt valid?
Do images have alt attributes?
Does the document have a valid hreflang implementation?
Does the document have a valid rel=canonical set up?
Are there any unwanted plugins like Java or Flash?
Although basic, the Lighthouse checks will alert you of any SEO problems to fix.
How to install Google Lighthouse
With the new Web Vitals metrics (checking mobile site speed and SEO), Google Lighthouse is trying more realistic angle, taking page experience into account. To use this tool, you have to download Google Chrome and then install a new plug-in.
Getting started with Google Lighthouse is very easy as it is built into Chrome’s Developer Tools Audit panel (Mac: Shift+Cmd+I. Win: Ctrl+Shift+J or F12). From there, you can run the test and get the full report. In addition, there is a separate Chrome add-on for Lighthouse that adds a button to your toolbar, though using it stays the same with a few restrictions: you can’t validate sites on your local server and authenticated pages also won’t work.
You can also run Lighthouse as a Node package. This way, you can incorporate the test into your build process. When using the Node package, you will also see that there are a couple of audits that only work in a Node environment and not in the Audits panel of the DevTools.
To install Lighthouse globally from the command line use:
npm install -g lighthouse
If you want to run a test for https://example.com use:
lighthouse https://example.com
The full results of the audit will be available in the terminal, but also in a separate HTML file.
The post Checking mobile site speed and SEO with Google Lighthouse appeared first on PureSourceCode.
from WordPress https://www.puresourcecode.com/tools/google-tools/checking-mobile-site-speed-and-seo-with-google-lighthouse/
0 notes
Text
Annotated edition of April 26 Week in Ethereum News
Here’s the most clicked for the latest Week in Eth News:

As I always say, the most clicked is determined by what people hadn’t already seen during the week.
My thought is that the annotated edition tries to give people a more high-level overview. If I were only reading a few high-level things this week, I would read
How state channels fits into layer2 post-rollups: immediate finality, no third party necessary, and arbitrary execution.
a MyCrypto guide to reading audit reports. Early adopters beware – you should definitely read audit reports!
Constant function market makers as a zero-to-one DeFi innovation
The fundamental value proposition of ETH
In reverse order, the fundamental value proposition of ETH, because it’s good to have a pithy post to send friends when you’re trying to get them to make their first ETH purchase, often after you’ve sent them some ETH and/or stablecoins to play around with. Of course, we used to have more “visions of web3″ posts, but those are now mostly a few years old.
In the long run, Ethereum’s vision of web3 needs applications built on it - and that comes with a native value transfer layer that is international and censorship-resistant. We do still lack a data layer to serve websites trustlessly though.
One thing those old “this is a vision for web3″ posts don’t usually contain is things like the constant function market makers as a zero-to-one DeFi innovation post. Being able to always source liquidity all over the world from a market even at 11pm at night is neat - and the sort of thing that will be needed for web3. If there’s a native value transfer layer, then all the sudden there is a very long-tail of assets. Things you earn in video games, etc etc.
We need to have a culture of educated users in the early days of web3, and the MyCrypto guide to reading audit reports is something non-devs should peruse. It’s a tough balance between encouraging people to use things - we need to have both a culture of “we use early web3 apps” but also “be educated and informed.” For me, I use lots of web3 apps, but how much I use them definitely depends on what the audit report says. If you imagine how a consultant writes a report to someone paying them, then have a good heuristic to skim. In general, if you don’t see things like “we found the code quality to be very high” then you should be cautious. You should also understand that time does harden these systems to some degree - the Hegic bug got found out within a few days - I think literally on the first day of going live.
Finally, a layer 2 post: how state channels fits into layer2 post-rollups: immediate finality, no third party necessary, and arbitrary execution. It can be hard to suss what is real and what is hype in layer2 - to date, almost all layer2 stuff has ended up being hype. Lightning has been around for years in Bitcoin-land yet has very little adoption and has serious privacy issues (new paper out this week). While we’ve seen simple uses for state channels in production (eg, AdEx’s how we built the largest payment channel network on Eth), we haven’t seen widespread adoption of channel networks nor meaningful uses of Plasma. Rollups are the new hype (and starting to be live, eg Loopring can do 10x throughput), but state channels aren’t dead yet - to use my best Monty Python voice - and should still be the right scaling tool for plenty of apps.
Eth1
Nethermind v1.8.18 beta enables beam sync by default. Stay on v1.7.x for stable releases
A very rough transcript from the latest Stateless Ethereum call. You’ll need to have context for this to make sense.
An EIP1559 implementer call (predictable transaction fees for users plus ETH burn) on April 30
Bit slow week on this front, though there was some stateless Eth work that moved forward - just no writeups yet.
Eth2
Latest Lighthouse client update, next public testnet likely this week, working on testnet interop
Latest Prysmatic client update, Topaz testnet launch, working with Sigma Prime on Lighthouse interop
Latest Eth2 implementer call, with notes from Ben and Mamy
There was also a call on API standardization. No video, but notes from Mamy and Proto
Lightweight clock sync protocol
An online eth2 staking calculator, based on the ConsenSys Codefi spreadsheet
A multi-client testnet launched since publication! It was a low hype event, and if you read the client updates, there’s some low-hanging fruit that will be caught early.
A note on the eth2 chain launch: when it goes into production, it won’t really be doing anything in production. As such, we should try to launch it as soon as possible and be understanding if there are bugs and we can fix/fork them if need be. We really only need a couple production-ready clients (the rest can join later) and we don’t need this multi-client testnet to run for months and months.
This is the way Ethereum launched in 2015. We turned it on, but you literally couldn’t do anything but mine. There were bugs and emergency fixes. It’s also the way the Eth2 upgrade will launch. We’ll turn it on, but you can’t do anything but stake. Then gradually it will start doing more things, and eventually the Ethereum state will be subsumed into the eth2 chain. Let’s launch early but with low expectations for what it does in the short-run.
We’re starting to see more “omg, what do i do when eth2 launches” questions on Reddit. Every rose has its thorns.
Layer2
AZTEC releases code for their zk-zk rollup, implements recursion for SNARKs over a single curve
A spec for account-based anonymous rollup
How state channels fits into layer2 post-rollups: immediate finality, no third party necessary, and arbitrary execution.
Private, scalable payments from Aztec using the magic of SNARKs. The next thing they’ll implement is some of the recent breakthroughs (plookup) to get the computation time down so that these things are cheaper and more scalable.
A completely under-hyped thing in Ethereum is AZTEC’s roadmap which includes “Code privacy — hiding asset/code being spent/run.” web3 business models all change when you can obfuscate your code. I have no idea when this is coming - but you can kinda make something out if you look out on the horizon.
Stuff for developers
Truffle v5.1.23 – Solidity stacktraces for debugging
web3js v1.2.7 – new Websocket provider with auto-reconnect, lots of bugfixes
OpenZeppelin Contracts v3, migrated to Solidity v0.6
How to use accesscontrol.sol in OpenZeppelin
Two posts on inheritance in Solidity from Sheraz Arshad and Igor Yalovoy
Source liquidity with the 0x API
Coinbase price oracle: signed price feed available via API
Quick start to building a governance interface for Compound
Zerion SDK – on-chain decoder of complex ERC20 tokens and an onchain registry of protocol metadata
Real time front end data with Embark’s Subspace library and Infura
Using TrailofBits’ Echidna fuzzer to find transactions with high gas consumption
For Pythonistas, a 3 part series to getting started in Brownie
Getting revert reasons in an NPM package
any.sender transaction relayer is on mainnet, with a CyberDice competition ending Monday (showing how to use the any.sender API) to win 3 eth
OpenZeppelin to re-focus on security, thus deprecating its networkJS library, Gas Station Network libraries, and starter kits. Gas Station Network lives on at opengsn.org
Post-lendfme, a defense of ERC777 tokens
The lendfme attacker gave all assets (value ~25m USD) back, apparently because the attacker’s IP address was on a server from accessing 1inch’s frontend.
Hegic Options had a bug, and thus a function can never be called. It will reimburse its users for over 150 ETH that is locked forever
Some cool stuff in there this week. Solidity stacktraces in Truffle, the new big release of Zeppelin contracts, Zerion SDK, getting revert reasons easily, etc.
It’s been suggested for awhile that more exchanges sign a price feed, and now Coinbase is doing it. I think they’re first.
I saw a couple people suggest this week that the Ethereum wannabe chains should have natively included things like price feeds and stablecoins. All of the late 2017 VC coins have really underwhelmed in both execution and imagination.
Ecosystem
Videos from EY Global Blockchain virtual summit
Cloudflare is now a Rinkeby testnet signer
Ideas for EthGlobal’s Hackathon.money
a MyCrypto guide to reading audit reports. Early adopters beware – you should definitely read audit reports!
Thanks to Cloudflare for being a Rinkeby signer. Very cool, some of the Rinkeby signers have not been very stable, so this should be a substantial upgrade in testnet stability.
The spreadsheet of hackathon ideas doubles as a “startup ideas.” I’ve heard people say they wish someone would collect people’s problems and post them weekly.
Enterprise
Italy’s ANSA newswire registers a hash of articles to combat fake news, including transparency about updates
Citing the pandemic, Indian shipping ministry wants to use CargoX for bills of lading on Ethereum
Two neat uses. It’s often hard to separate fact from fiction (and hype) in the enterprise space but these seemed legit.
Governance, DAOs, and standards
Greg Colvin put ProgPoW on the agenda for the next core devs call
A walkthrough of TheLAO, launching April 28. They’re using a TCRParty-fork called LAOScout to put startups on radar for funding from TheLAO.
ERC2615: Non funglible property standard
ERC2612: Permit extension for ERC20
It’s inexplicable that Colvin is bringing up ProgPoW again without any change in argument. He’s doing serious damage to the chance that we are able to put ProgPoW in if we need it - and I’ve learned some things that makes me think that we might need it.
It’s interesting to me to see how TheLAO does. I never thought TheDAO was a good idea - direct democracy + money doesn’t sound to me like the way to improve venture funding - but I wonder whether our space gets excited about anything that gets KYC’d.
Application layer
Gnosis launches Corona virus prediction markets, subsidized with Gnosis liquidity
cent v2. new version of seeding, aimed at monthly subscriptions for content creators. Also a separate tipping feature, and winner-takes-all-bounties
dYdX perpetual BTCUSD contracts with 10x leverage is in private alpha (not available on front end in US).
Futureswap live on mainnet with perpetual ETHDAI contracts with 20x leverage, a closed source alpha that did over 10m in volume, and is now effectively shut down
Opyn gets a front end with an order book
Maker stability fees changed, now 6% for USDC, 0% for ETH/BAT, (DSR obviously still 0). 12 hour governance delay
rTrees users planted 1541 trees for Earth Day
Golem re-writing their codebase, migrating the token to be ERC20 compliant
RequestNetwork hits 1m USD invoiced
Signal vs Telegram vs Status
NexusMutual: how Solidity cover will evolve to be able to cover the demand for large policies
TrustlessFund is live on mainnet (but unaudited!) – specify a lock date and a beneficiary
PoolTogether Pods – now you can trustlessly buy your pooltogether tickets as a group
Aave updates: adds a UI for manual liquidations, as well as a UI to see burnt LEND, to go with its new risk framework
2key: internationally monetize your calls with an Eth-based paywall Zoom plugin
Dharma social payments: send USD instantly to any Twitter user anywhere around the globe
The eternal (and eternally arbitrary) how much is DeFi metric: 12/16, though that’s not counting prediction markets as DeFi, and whether I count prediction markets as DeFi probably changes from week-to-week.
This was an exciting week at the app layer. Coronavirus markets, onchain futures so folks don’t YOLO gamble on centralized sites that know your liquidation point and trade against you, the Zoom paywall, etc.
Cent is quite neat. It was obvious that previous seeding wasn’t quite right, I’ll have to try the new one. The idea of getting paid for discovering new content and creators is super appealing. I remember the feeling once upon a time that I should get paid for all the new bands I was discovering and getting people to buy records for. This is what Cent is going for, and it’s very cool
Dharma social payments is very cool, a nice emulation of web2, but automatically earning interest. Of course Twitter is giving them troubles. The whole point of web3 is not getting capriciously censored. And Twitter is the worst at that - I remember when they randomly locked my account ~4 times in a month last year, including twice in one day!
Tokens/Business/Regulation
Constant function market makers as a zero-to-one DeFi innovation
Jacob Horne on redeemable tokens and Saint Fame
Securitize uses white-label AirSwap for US securities transfer
Token Terminal has an interesting P/E metric
The fundamental value proposition of ETH
Take some of the P/E with a grain of salt, especially if you aren’t comparing apples-to-oranges, but if you sort by PE, I think it’s obvious which layer 1 chains are massively overvalued right now.
General
Post-Black Thursday, is Dai still safe to use?
Dappnode makes it easier to run non-Eth chains (but why!) and prepares for Eth2
Bobbin Threadbare’s STARK-based VM in Rust
Libra changes to being multi-fiat stablecoins that will always be permissioned
How much your new browser in iOS is spewing data to the world about you
Like anything, “safe to use” is an evaluation. Even holding USD requires an evaluation of all of your goals, tolerance for risk, timeframes, where you are, how you’re holding it, etc. It’s the reason why “this is not financial advice” is a thing, even outside of trying to discourage idiots from suing you. So to me saying anything is safe is a tough goal. But it is safe to say that Dai is getting more hardened.
Libra shifting away from its goal of going permissionless isn’t surprising. I said at the start that if they ever launched anything, it wouldn’t be anything like what they announced. Seems like they’re solidly on track for that.
Do people know that much of Libra’s Move comes from work funded by the Ethereum Foundation?
This newsletter is made possible by ConsenSys
I own 100% Week In Ethereum News. Editorial control has always been me.

If you’re wondering “why didn’t my post make it into Week in Ethereum News,” then here’s a hint: don’t email me. Do put it on Reddit.
Permalink: https://weekinethereumnews.com/week-in-ethereum-news-april-25-2020/
Dates of Note
Upcoming dates of note (new/changes in bold):
Apr 29-30 – SoliditySummit (Berlin)
May 8-9 – Ethereal Summit (NYC)
May 22-31 – Ethereum Madrid public health virtual hackathon
May 29-June 16 – SOSHackathon
June 17 – EthBarcelona R&D workshop
Did you get forwarded this newsletter? Sign up to receive it weekly
0 notes
Text
Build a Node.js Tool to Record and Compare Google Lighthouse Reports
In this tutorial, I’ll show you step by step how to create a simple tool in Node.js to run Google Lighthouse audits via the command line, save the reports they generate in JSON format and then compare them so web performance can be monitored as the website grows and develops.
I’m hopeful this can serve as a good introduction for any developer interested in learning about how to work with Google Lighthouse programmatically.
But first, for the uninitiated...
What is Google Lighthouse?
Google Lighthouse is one of the best-automated tools available on a web developer's utility belt. It allows you to quickly audit a website in a number of key areas which together can form a measure of its overall quality. These are:
Performance
Accessibility
Best Practices
SEO
Progressive Web App
Once the audit is complete, a report is then generated on what your website does well… and not so well, with the latter intending to serve as an indicator for what your next steps should be to improve the page.
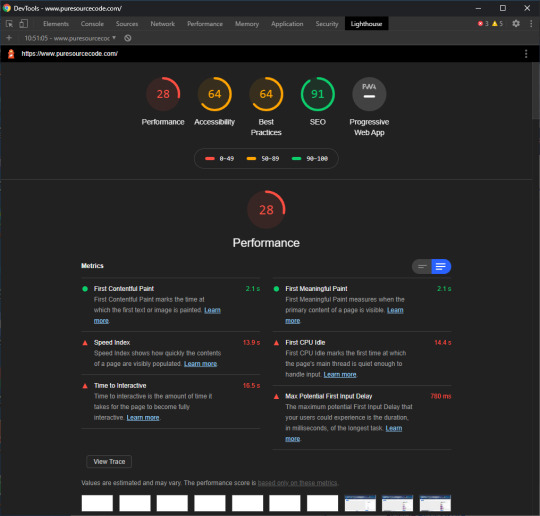
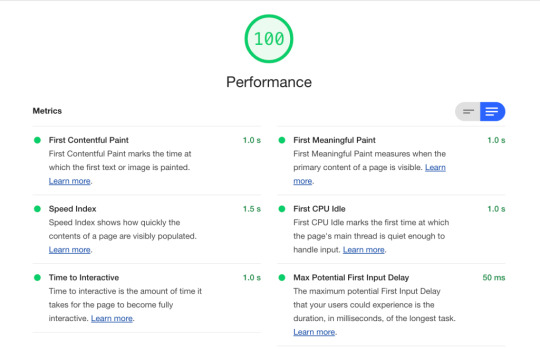
Here’s what a full report looks like.
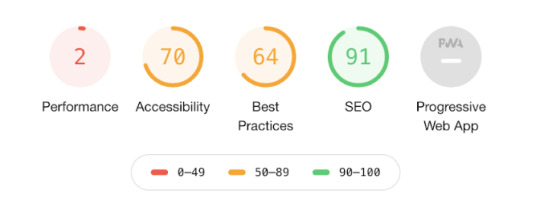
Along with other general diagnostics and web performance metrics, a really useful feature of the report is that each of the key areas is aggregated into color-coded scores between 0-100.
Not only does this allow developers to quickly gauge the quality of a website without further analysis, but it also allows non-technical folk such as stakeholders or clients to understand as well.
For example, this means, it’s much easier to share the win with Heather from marketing after spending time improving website accessibility as she’s more able to appreciate the effort after seeing the Lighthouse accessibility score go up 50 points into the green.
But equally, Simon the project manager may not understand what Speed Index or First Contentful Paint means, but when he sees the Lighthouse report showing website performance score knee deep in the red, he knows you still have work to do.
If you’re in Chrome or the latest version of Edge, you can run a Lighthouse audit for yourself right now using DevTools. Here’s how:
You can also run a Lighthouse audit online via PageSpeed Insights or through popular performance tools, such as WebPageTest.
However, today, we’re only interested in Lighthouse as a Node module, as this allows us to use the tool programmatically to audit, record and compare web performance metrics.
Let’s find out how.
Setup
First off, if you don’t already have it, you’re going to need Node.js. There are a million different ways to install it. I use the Homebrew package manager, but you can also download an installer straight from the Node.js website if you prefer. This tutorial was written with Node.js v10.17.0 in mind, but will very likely work just fine on the most versions released in the last few years.
You’re also going to need Chrome installed, as that’s how we’ll be running the Lighthouse audits.
Next, create a new directory for the project and then cd into it in the console. Then run npm init to begin to create a package.json file. At this point, I’d recommend just bashing the Enter key over and over to skip as much of this as possible until the file is created.
Now, let’s create a new file in the project directory. I called mine lh.js, but feel free to call it whatever you want. This will contain all of JavaScript for the tool. Open it in your text editor of choice, and for now, write a console.log statement.
console.log('Hello world');
Then in the console, make sure your CWD (current working directory) is your project directory and run node lh.js, substituting my file name for whatever you’ve used.
You should see:
$ node lh.js Hello world
If not, then check your Node installation is working and you’re definitely in the correct project directory.
Now that’s out of the way, we can move on to developing the tool itself.
Opening Chrome with Node.js
Let’s install our project’s first dependency: Lighthouse itself.
npm install lighthouse --save-dev
This creates a node_modules directory that contains all of the package’s files. If you’re using Git, the only thing you’ll want to do with this is add it to your .gitignore file.
In lh.js, you’ll next want to delete the test console.log() and import the Lighthouse module so you can use it in your code. Like so:
const lighthouse = require('lighthouse');
Below it, you’ll also need to import a module called chrome-launcher, which is one of Lighthouse’s dependencies and allows Node to launch Chrome by itself so the audit can be run.
const lighthouse = require('lighthouse'); const chromeLauncher = require('chrome-launcher');
Now that we have access to these two modules, let’s create a simple script which just opens Chrome, runs a Lighthouse audit, and then prints the report to the console.
Create a new function that accepts a URL as a parameter. Because we’ll be running this using Node.js, we’re able to safely use ES6 syntax as we don’t have to worry about those pesky Internet Explorer users.
const launchChrome = (url) => { }
Within the function, the first thing we need to do is open Chrome using the chrome-launcher module we imported and send it to whatever argument is passed through the url parameter.
We can do this using its launch() method and its startingUrl option.
const launchChrome = url => { chromeLauncher.launch({ startingUrl: url }); };
Calling the function below and passing a URL of your choice results in Chrome being opened at the URL when the Node script is run.
launchChrome('https://www.lukeharrison.dev');
The launch function actually returns a promise, which allows us to access an object containing a few useful methods and properties.
For example, using the code below, we can open Chrome, print the object to the console, and then close Chrome three seconds later using its kill() method.
const launchChrome = url => { chromeLauncher .launch({ startingUrl: url }) .then(chrome => { console.log(chrome); setTimeout(() => chrome.kill(), 3000); }); }; launchChrome("https://www.lukeharrison.dev");
Now that we’ve got Chrome figured out, let’s move on to Lighthouse.
Running Lighthouse programmatically
First off, let’s rename our launchChrome() function to something more reflective of its final functionality: launchChromeAndRunLighthouse(). With the hard part out of the way, we can now use the Lighthouse module we imported earlier in the tutorial.
In the Chrome launcher’s then function, which only executes once the browser is open, we’ll pass Lighthouse the function’s url argument and trigger an audit of this website.
const launchChromeAndRunLighthouse = url => { chromeLauncher .launch({ startingUrl: url }) .then(chrome => { const opts = { port: chrome.port }; lighthouse(url, opts); }); }; launchChromeAndRunLighthouse("https://www.lukeharrison.dev");
To link the lighthouse instance to our Chrome browser window, we have to pass its port along with the URL.
If you were to run this script now, you will hit an error in the console:
(node:47714) UnhandledPromiseRejectionWarning: Error: You probably have multiple tabs open to the same origin.
To fix this, we just need to remove the startingUrl option from Chrome Launcher and let Lighthouse handle URL navigation from here on out.
const launchChromeAndRunLighthouse = url => { chromeLauncher.launch().then(chrome => { const opts = { port: chrome.port }; lighthouse(url, opts); }); };
If you were to execute this code, you’ll notice that something definitely seems to be happening. We just aren’t getting any feedback in the console to confirm the Lighthouse audit has definitely run, nor is the Chrome instance closing by itself like before.
Thankfully, the lighthouse() function returns a promise which lets us access the audit results.
Let’s kill Chrome and then print those results to the terminal in JSON format via the report property of the results object.
const launchChromeAndRunLighthouse = url => { chromeLauncher.launch().then(chrome => { const opts = { port: chrome.port }; lighthouse(url, opts).then(results => { chrome.kill(); console.log(results.report); }); }); };
While the console isn’t the best way to display these results, if you were to copy them to your clipboard and visit the Lighthouse Report Viewer, pasting here will show the report in all of its glory.
At this point, it’s important to tidy up the code a little to make the launchChromeAndRunLighthouse() function return the report once it's finished executing. This allows us to process the report later without resulting in a messy pyramid of JavaScript.
const lighthouse = require("lighthouse"); const chromeLauncher = require("chrome-launcher"); const launchChromeAndRunLighthouse = url => { return chromeLauncher.launch().then(chrome => { const opts = { port: chrome.port }; return lighthouse(url, opts).then(results => { return chrome.kill().then(() => results.report); }); }); }; launchChromeAndRunLighthouse("https://www.lukeharrison.dev").then(results => { console.log(results); });
One thing you may have noticed is that our tool is only able to audit a single website at the moment. Let’s change this so you can pass the URL as an argument via the command line.
To take the pain out of working with command-line arguments, we’ll handle them with a package called yargs.
npm install --save-dev yargs
Then import it at the top of your script along with Chrome Launcher and Lighthouse. We only need its argv function here.
const lighthouse = require('lighthouse'); const chromeLauncher = require('chrome-launcher'); const argv = require('yargs').argv;
This means if you were to pass a command line argument in the terminal like so:
node lh.js --url https://www.google.co.uk
...you can access the argument in the script like so:
const url = argv.url // https://www.google.co.uk
Let’s edit our script to pass the command line URL argument to the function’s url parameter. It’s important to add a little safety net via the if statement and error message in case no argument is passed.
if (argv.url) { launchChromeAndRunLighthouse(argv.url).then(results => { console.log(results); }); } else { throw "You haven't passed a URL to Lighthouse"; }
Tada! We have a tool that launches Chrome and runs a Lighthouse audit programmatically before printing the report to the terminal in JSON format.
Saving Lighthouse reports
Having the report printed to the console isn’t very useful as you can’t easily read its contents, nor are they aren’t saved for future use. In this section of the tutorial, we’ll change this behavior so each report is saved into its own JSON file.
To stop reports from different websites getting mixed up, we’ll organize them like so:
lukeharrison.dev
2020-01-31T18:18:12.648Z.json
2020-01-31T19:10:24.110Z.json
cnn.com
2020-01-14T22:15:10.396Z.json
lh.js
We’ll name the reports with a timestamp indicating when the date/time the report was generated. This will mean no two report file names will ever be the same, and it’ll help us easily distinguish between reports.
There is one issue with Windows that requires our attention: the colon (:) is an illegal character for file names. To mitigate this issue, we’ll replace any colons with underscores (_), so a typical report filename will look like:
2020-01-31T18_18_12.648Z.json
Creating the directory
First, we need to manipulate the command line URL argument so we can use it for the directory name.
This involves more than just removing the www, as it needs to account for audits run on web pages which don’t sit at the root (eg: www.foo.com/bar), as the slashes are invalid characters for directory names.
For these URLs, we’ll replace the invalid characters with underscores again. That way, if you run an audit on https://www.foo.com/bar, the resulting directory name containing the report would be foo.com_bar.
To make dealing with URLs easier, we’ll use a native Node.js module called url. This can be imported like any other package and without having to add it to thepackage.json and pull it via npm.
const lighthouse = require('lighthouse'); const chromeLauncher = require('chrome-launcher'); const argv = require('yargs').argv; const url = require('url');
Next, let’s use it to instantiate a new URL object.
if (argv.url) { const urlObj = new URL(argv.url); launchChromeAndRunLighthouse(argv.url).then(results => { console.log(results); }); }
If you were to print urlObj to the console, you would see lots of useful URL data we can use.
$ node lh.js --url https://www.foo.com/bar URL { href: 'https://www.foo.com/bar', origin: 'https://www.foo.com', protocol: 'https:', username: '', password: '', host: 'www.foo.com', hostname: 'www.foo.com', port: '', pathname: '/bar', search: '', searchParams: URLSearchParams {}, hash: '' }
Create a new variable called dirName, and use the string replace() method on the host property of our URL to get rid of the www in addition to the https protocol:
const urlObj = new URL(argv.url); let dirName = urlObj.host.replace('www.','');
We’ve used let here, which unlike const can be reassigned, as we’ll need to update the reference if the URL has a pathname, to replace slashes with underscores. This can be done with a regular expression pattern, and looks like this:
const urlObj = new URL(argv.url); let dirName = urlObj.host.replace("www.", ""); if (urlObj.pathname !== "/") { dirName = dirName + urlObj.pathname.replace(/\//g, "_"); }
Now we can create the directory itself. This can be done through the use of another native Node.js module called fs (short for "file system").
const lighthouse = require('lighthouse'); const chromeLauncher = require('chrome-launcher'); const argv = require('yargs').argv; const url = require('url'); const fs = require('fs');
We can use its mkdir() method to create a directory, but first have to use its existsSync() method to check if the directory already exists, as Node.js would otherwise throw an error:
const urlObj = new URL(argv.url); let dirName = urlObj.host.replace("www.", ""); if (urlObj.pathname !== "/") { dirName = dirName + urlObj.pathname.replace(/\//g, "_"); } if (!fs.existsSync(dirName)) { fs.mkdirSync(dirName); }
Testing the script at the point should result in a new directory being created. Passing https://www.bbc.co.uk/news as the URL argument would result in a directory named bbc.co.uk_news.
Saving the report
In the then function for launchChromeAndRunLighthouse(), we want to replace the existing console.log with logic to write the report to disk. This can be done using the fs module’s writeFile() method.
launchChromeAndRunLighthouse(argv.url).then(results => { fs.writeFile("report.json", results, err => { if (err) throw err; }); });
The first parameter represents the file name, the second is the content of the file and the third is a callback containing an error object should something go wrong during the write process. This would create a new file called report.json containing the returning Lighthouse report JSON object.
We still need to send it to the correct directory, with a timestamp as its file name. The former is simple — we pass the dirName variable we created earlier, like so:
launchChromeAndRunLighthouse(argv.url).then(results => { fs.writeFile(`${dirName}/report.json`, results, err => { if (err) throw err; }); });
The latter though requires us to somehow retrieve a timestamp of when the report was generated. Thankfully, the report itself captures this as a data point, and is stored as the fetchTime property.
We just need to remember to swap any colons (:) for underscores (_) so it plays nice with the Windows file system.
launchChromeAndRunLighthouse(argv.url).then(results => { fs.writeFile( `${dirName}/${results["fetchTime"].replace(/:/g, "_")}.json`, results, err => { if (err) throw err; } ); });
If you were to run this now, rather than a timestamped.json filename, instead you would likely see an error similar to:
UnhandledPromiseRejectionWarning: TypeError: Cannot read property 'replace' of undefined
This is happening because Lighthouse is currently returning the report in JSON format, rather than an object consumable by JavaScript.
Thankfully, instead of parsing the JSON ourselves, we can just ask Lighthouse to return the report as a regular JavaScript object instead.
This requires editing the below line from:
return chrome.kill().then(() => results.report);
...to:
return chrome.kill().then(() => results.lhr);
Now, if you rerun the script, the file will be named correctly. However, when opened, it’s only content will unfortunately be...
[object Object]
This is because we’ve now got the opposite problem as before. We’re trying to render a JavaScript object without stringifying it into a JSON object first.
The solution is simple. To avoid having to waste resources on parsing or stringifying this huge object, we can return both types from Lighthouse:
return lighthouse(url, opts).then(results => { return chrome.kill().then(() => { return { js: results.lhr, json: results.report }; }); });
Then we can modify the writeFile instance to this:
fs.writeFile( `${dirName}/${results.js["fetchTime"].replace(/:/g, "_")}.json`, results.json, err => { if (err) throw err; } );
Sorted! On completion of the Lighthouse audit, our tool should now save the report to a file with a unique timestamped filename in a directory named after the website URL.
This means reports are now much more efficiently organized and won’t override each other no matter how many reports are saved.
Comparing Lighthouse reports
During everyday development, when I’m focused on improving performance, the ability to very quickly compare reports directly in the console and see if I’m headed in the right direction could be extremely useful. With this in mind, the requirements of this compare functionality ought to be:
If a previous report already exists for the same website when a Lighthouse audit is complete, automatically perform a comparison against it and show any changes to key performance metrics.
I should also be able to compare key performance metrics from any two reports, from any two websites, without having to generate a new Lighthouse report which I may not need.
What parts of a report should be compared? These are the numerical key performance metrics collected as part of any Lighthouse report. They provide insight into the objective and perceived performance of a website.
In addition, Lighthouse also collects other metrics that aren’t listed in this part of the report but are still in an appropriate format to be included in the comparison. These are:
Time to first byte - Time To First Byte identifies the time at which your server sends a response.
Total blocking time - Sum of all time periods between FCP and Time to Interactive, when task length exceeded 50ms, expressed in milliseconds.
Estimated input latency - Estimated Input Latency is an estimate of how long your app takes to respond to user input, in milliseconds, during the busiest 5s window of page load. If your latency is higher than 50ms, users may perceive your app as laggy.
How should the metric comparison be output to the console? We’ll create a simple percentage-based comparison using the old and new metrics to see how they’ve changed from report to report.
To allow for quick scanning, we’ll also color-code individual metrics depending on if they’re faster, slower or unchanged.
We’ll aim for this output:

Compare the new report against the previous report
Let’s get started by creating a new function called compareReports() just below our launchChromeAndRunLighthouse() function, which will contain all the comparison logic. We’ll give it two parameters —from and to — to accept the two reports used for the comparison.
For now, as a placeholder, we’ll just print out some data from each report to the console to validate that it’s receiving them correctly.
const compareReports = (from, to) => { console.log(from["finalUrl"] + " " + from["fetchTime"]); console.log(to["finalUrl"] + " " + to["fetchTime"]); };
As this comparison would begin after the creation of a new report, the logic to execute this function should sit in the then function for launchChromeAndRunLighthouse().
If, for example, you have 30 reports sitting in a directory, we need to determine which one is the most recent and set it as the previous report which the new one will be compared against. Thankfully, we already decided to use a timestamp as the filename for a report, so this gives us something to work with.
First off, we need to collect any existing reports. To make this process easy, we’ll install a new dependency called glob, which allows for pattern matching when searching for files. This is critical because we can’t predict how many reports will exist or what they’ll be called.
Install it like any other dependency:
npm install glob --save-dev
Then import it at the top of the file the same way as usual:
const lighthouse = require('lighthouse'); const chromeLauncher = require('chrome-launcher'); const argv = require('yargs').argv; const url = require('url'); const fs = require('fs'); const glob = require('glob');
We’ll use glob to collect all of the reports in the directory, which we already know the name of via the dirName variable. It’s important to set its sync option to true as we don’t want JavaScript execution to continue until we know how many other reports exist.
launchChromeAndRunLighthouse(argv.url).then(results => { const prevReports = glob(`${dirName}/*.json`, { sync: true }); // et al });
This process returns an array of paths. So if the report directory looked like this:
lukeharrison.dev
2020-01-31T10_18_12.648Z.json
2020-01-31T10_18_24.110Z.json
...then the resulting array would look like this:
[ 'lukeharrison.dev/2020-01-31T10_18_12.648Z.json', 'lukeharrison.dev/2020-01-31T10_18_24.110Z.json' ]
Because we can only perform a comparison if a previous report exists, let’s use this array as a conditional for the comparison logic:
const prevReports = glob(`${dirName}/*.json`, { sync: true }); if (prevReports.length) { }
We have a list of report file paths and we need to compare their timestamped filenames to determine which one is the most recent.
This means we first need to collect a list of all the file names, trim any irrelevant data such as directory names, and taking care to replace the underscores (_) back with colons (:) to turn them back into valid dates again. The easiest way to do this is using path, another Node.js native module.
const path = require('path');
Passing the path as an argument to its parse method, like so:
path.parse('lukeharrison.dev/2020-01-31T10_18_24.110Z.json');
Returns this useful object:
{ root: '', dir: 'lukeharrison.dev', base: '2020-01-31T10_18_24.110Z.json', ext: '.json', name: '2020-01-31T10_18_24.110Z' }
Therefore, to get a list of all the timestamp file names, we can do this:
if (prevReports.length) { dates = []; for (report in prevReports) { dates.push( new Date(path.parse(prevReports[report]).name.replace(/_/g, ":")) ); } }
Which again if our directory looked like:
lukeharrison.dev
2020-01-31T10_18_12.648Z.json
2020-01-31T10_18_24.110Z.json
Would result in:
[ '2020-01-31T10:18:12.648Z', '2020-01-31T10:18:24.110Z' ]
A useful thing about dates is that they’re inherently comparable by default:
const alpha = new Date('2020-01-31'); const bravo = new Date('2020-02-15'); console.log(alpha > bravo); // false console.log(bravo > alpha); // true
So by using a reduce function, we can reduce our array of dates down until only the most recent remains:
dates = []; for (report in prevReports) { dates.push(new Date(path.parse(prevReports[report]).name.replace(/_/g, ":"))); } const max = dates.reduce(function(a, b) { return Math.max(a, b); });
If you were to print the contents of max to the console, it would throw up a UNIX timestamp, so now, we just have to add another line to convert our most recent date back into the correct ISO format:
const max = dates.reduce(function(a, b) { return Math.max(a, b); }); const recentReport = new Date(max).toISOString();
Assuming these are the list of reports:
2020-01-31T23_24_41.786Z.json
2020-01-31T23_25_36.827Z.json
2020-01-31T23_37_56.856Z.json
2020-01-31T23_39_20.459Z.json
2020-01-31T23_56_50.959Z.json
The value of recentReport would be 2020-01-31T23:56:50.959Z.
Now that we know the most recent report, we next need to extract its contents. Create a new variable called recentReportContents beneath the recentReport variable and assign it an empty function.
As we know this function will always need to execute, rather than manually calling it, it makes sense to turn it into an IFFE (Immediately invoked function expression), which will run by itself when the JavaScript parser reaches it. This is signified by the extra parenthesis:
const recentReportContents = (() => { })();
In this function, we can return the contents of the most recent report using the readFileSync() method of the native fs module. Because this will be in JSON format, it’s important to parse it into a regular JavaScript object.
const recentReportContents = (() => { const output = fs.readFileSync( dirName + "/" + recentReport.replace(/:/g, "_") + ".json", "utf8", (err, results) => { return results; } ); return JSON.parse(output); })();
And then, it’s a matter of calling the compareReports() function and passing both the current report and the most recent report as arguments.
compareReports(recentReportContents, results.js);
At the moment this just print out a few details to the console so we can test the report data is coming through OK:
https://www.lukeharrison.dev/ 2020-02-01T00:25:06.918Z https://www.lukeharrison.dev/ 2020-02-01T00:25:42.169Z
If you’re getting any errors at this point, try deleting any report.json files or reports without valid content from earlier in the tutorial.
Compare any two reports
The remaining key requirement was the ability to compare any two reports from any two websites. The easiest way to implement this would be to allow the user to pass the full report file paths as command line arguments which we’ll then send to the compareReports() function.
In the command line, this would look like:
node lh.js --from lukeharrison.dev/2020-02-01T00:25:06.918Z --to cnn.com/2019-12-16T15:12:07.169Z
Achieving this requires editing the conditional if statement which checks for the presence of a URL command line argument. We’ll add an additional check to see if the user has just passed a from and to path, otherwise check for the URL as before. This way we’ll prevent a new Lighthouse audit.
if (argv.from && argv.to) { } else if (argv.url) { // et al }
Let’s extract the contents of these JSON files, parse them into JavaScript objects, and then pass them along to the compareReports() function.
We’ve already parsed JSON before when retrieving the most recent report. We can just extrapolate this functionality into its own helper function and use it in both locations.
Using the recentReportContents() function as a base, create a new function called getContents() which accepts a file path as an argument. Make sure this is just a regular function, rather than an IFFE, as we don’t want it executing as soon as the JavaScript parser finds it.
const getContents = pathStr => { const output = fs.readFileSync(pathStr, "utf8", (err, results) => { return results; }); return JSON.parse(output); }; const compareReports = (from, to) => { console.log(from["finalUrl"] + " " + from["fetchTime"]); console.log(to["finalUrl"] + " " + to["fetchTime"]); };
Then update the recentReportContents() function to use this extrapolated helper function instead:
const recentReportContents = getContents(dirName + '/' + recentReport.replace(/:/g, '_') + '.json');
Back in our new conditional, we need to pass the contents of the comparison reports to the compareReports() function.
if (argv.from && argv.to) { compareReports( getContents(argv.from + ".json"), getContents(argv.to + ".json") ); }
Like before, this should print out some basic information about the reports in the console to let us know it’s all working fine.
node lh.js --from lukeharrison.dev/2020-01-31T23_24_41.786Z --to lukeharrison.dev/2020-02-01T11_16_25.221Z
Would lead to:
https://www.lukeharrison.dev/ 2020-01-31T23_24_41.786Z https://www.lukeharrison.dev/ 2020-02-01T11_16_25.221Z
Comparison logic
This part of development involves building comparison logic to compare the two reports received by the compareReports() function.
Within the object which Lighthouse returns, there’s a property called audits that contains another object listing performance metrics, opportunities, and information. There’s a lot of information here, much of which we aren’t interested in for the purposes of this tool.
Here’s the entry for First Contentful Paint, one of the nine performance metrics we wish to compare:
"first-contentful-paint": { "id": "first-contentful-paint", "title": "First Contentful Paint", "description": "First Contentful Paint marks the time at which the first text or image is painted. [Learn more](https://web.dev/first-contentful-paint).", "score": 1, "scoreDisplayMode": "numeric", "numericValue": 1081.661, "displayValue": "1.1 s" }
Create an array listing the keys of these nine performance metrics. We can use this to filter the audit object:
const compareReports = (from, to) => { const metricFilter = [ "first-contentful-paint", "first-meaningful-paint", "speed-index", "estimated-input-latency", "total-blocking-time", "max-potential-fid", "time-to-first-byte", "first-cpu-idle", "interactive" ]; };
Then we’ll loop through one of the report’s audits object and then cross-reference its name against our filter list. (It doesn’t matter which audit object, as they both have the same content structure.)
If it’s in there, then brilliant, we want to use it.
const metricFilter = [ "first-contentful-paint", "first-meaningful-paint", "speed-index", "estimated-input-latency", "total-blocking-time", "max-potential-fid", "time-to-first-byte", "first-cpu-idle", "interactive" ]; for (let auditObj in from["audits"]) { if (metricFilter.includes(auditObj)) { console.log(auditObj); } }
This console.log() would print the below keys to the console:
first-contentful-paint first-meaningful-paint speed-index estimated-input-latency total-blocking-time max-potential-fid time-to-first-byte first-cpu-idle interactive
Which means we would use from['audits'][auditObj].numericValue and to['audits'][auditObj].numericValue respectively in this loop to access the metrics themselves.
If we were to print these to the console with the key, it would result in output like this:
first-contentful-paint 1081.661 890.774 first-meaningful-paint 1081.661 954.774 speed-index 15576.70313351777 1098.622294504341 estimated-input-latency 12.8 12.8 total-blocking-time 59 31.5 max-potential-fid 153 102 time-to-first-byte 16.859999999999985 16.096000000000004 first-cpu-idle 1704.8490000000002 1918.774 interactive 2266.2835 2374.3615
We have all the data we need now. We just need to calculate the percentage difference between these two values and then log it to the console using the color-coded format outlined earlier.
Do you know how to calculate the percentage change between two values? Me neither. Thankfully, everybody's favorite monolith search engine came to the rescue.
The formula is:
((From - To) / From) x 100
So, let's say we have a Speed Index of 5.7s for the first report (from), and then a value of 2.1s for the second (to). The calculation would be:
5.7 - 2.1 = 3.6 3.6 / 5.7 = 0.63157895 0.63157895 * 100 = 63.157895
Rounding to two decimal places would yield a decrease in the speed index of 63.16%.
Let’s put this into a helper function inside the compareReports() function, below the metricFilter array.
const calcPercentageDiff = (from, to) => { const per = ((to - from) / from) * 100; return Math.round(per * 100) / 100; };
Back in our auditObj conditional, we can begin to put together the final report comparison output.
First off, use the helper function to generate the percentage difference for each metric.
for (let auditObj in from["audits"]) { if (metricFilter.includes(auditObj)) { const percentageDiff = calcPercentageDiff( from["audits"][auditObj].numericValue, to["audits"][auditObj].numericValue ); } }
Next, we need to output values in this format to the console:
This requires adding color to the console output. In Node.js, this can be done by passing a color code as an argument to the console.log() function like so:
console.log('\x1b[36m', 'hello') // Would print 'hello' in cyan

You can get a full reference of color codes in this Stackoverflow question. We need green and red, so that’s \x1b[32m and \x1b[31m respectively. For metrics where the value remains unchanged, we’ll just use white. This would be \x1b[37m.
Depending on if the percentage increase is a positive or negative number, the following things need to happen:
Log color needs to change (Green for negative, red for positive, white for unchanged)
Log text contents change.
‘[Name] is X% slower for positive numbers
‘[Name] is X% faster’ for negative numbers
‘[Name] is unchanged’ for numbers with no percentage difference.
If the number is negative, we want to remove the minus/negative symbol, as otherwise, you'd have a sentence like ‘Speed Index is -92.95% faster’ which doesn’t make sense.
There are many ways this could be done. Here, we’ll use the Math.sign() function, which returns 1 if its argument is positive, 0 if well… 0, and -1 if the number is negative. That’ll do.
for (let auditObj in from["audits"]) { if (metricFilter.includes(auditObj)) { const percentageDiff = calcPercentageDiff( from["audits"][auditObj].numericValue, to["audits"][auditObj].numericValue ); let logColor = "\x1b[37m"; const log = (() => { if (Math.sign(percentageDiff) === 1) { logColor = "\x1b[31m"; return `${percentageDiff + "%"} slower`; } else if (Math.sign(percentageDiff) === 0) { return "unchanged"; } else { logColor = "\x1b[32m"; return `${percentageDiff + "%"} faster`; } })(); console.log(logColor, `${from["audits"][auditObj].title} is ${log}`); } }
So, there we have it.
You can create new Lighthouse reports, and if a previous one exists, a comparison is made.
And you can also compare any two reports from any two sites.
Complete source code
Here’s the completed source code for the tool, which you can also view in a Gist via the link below.
const lighthouse = require("lighthouse"); const chromeLauncher = require("chrome-launcher"); const argv = require("yargs").argv; const url = require("url"); const fs = require("fs"); const glob = require("glob"); const path = require("path"); const launchChromeAndRunLighthouse = url => { return chromeLauncher.launch().then(chrome => { const opts = { port: chrome.port }; return lighthouse(url, opts).then(results => { return chrome.kill().then(() => { return { js: results.lhr, json: results.report }; }); }); }); }; const getContents = pathStr => { const output = fs.readFileSync(pathStr, "utf8", (err, results) => { return results; }); return JSON.parse(output); }; const compareReports = (from, to) => { const metricFilter = [ "first-contentful-paint", "first-meaningful-paint", "speed-index", "estimated-input-latency", "total-blocking-time", "max-potential-fid", "time-to-first-byte", "first-cpu-idle", "interactive" ]; const calcPercentageDiff = (from, to) => { const per = ((to - from) / from) * 100; return Math.round(per * 100) / 100; }; for (let auditObj in from["audits"]) { if (metricFilter.includes(auditObj)) { const percentageDiff = calcPercentageDiff( from["audits"][auditObj].numericValue, to["audits"][auditObj].numericValue ); let logColor = "\x1b[37m"; const log = (() => { if (Math.sign(percentageDiff) === 1) { logColor = "\x1b[31m"; return `${percentageDiff.toString().replace("-", "") + "%"} slower`; } else if (Math.sign(percentageDiff) === 0) { return "unchanged"; } else { logColor = "\x1b[32m"; return `${percentageDiff.toString().replace("-", "") + "%"} faster`; } })(); console.log(logColor, `${from["audits"][auditObj].title} is ${log}`); } } }; if (argv.from && argv.to) { compareReports( getContents(argv.from + ".json"), getContents(argv.to + ".json") ); } else if (argv.url) { const urlObj = new URL(argv.url); let dirName = urlObj.host.replace("www.", ""); if (urlObj.pathname !== "/") { dirName = dirName + urlObj.pathname.replace(/\//g, "_"); } if (!fs.existsSync(dirName)) { fs.mkdirSync(dirName); } launchChromeAndRunLighthouse(argv.url).then(results => { const prevReports = glob(`${dirName}/*.json`, { sync: true }); if (prevReports.length) { dates = []; for (report in prevReports) { dates.push( new Date(path.parse(prevReports[report]).name.replace(/_/g, ":")) ); } const max = dates.reduce(function(a, b) { return Math.max(a, b); }); const recentReport = new Date(max).toISOString(); const recentReportContents = getContents( dirName + "/" + recentReport.replace(/:/g, "_") + ".json" ); compareReports(recentReportContents, results.js); } fs.writeFile( `${dirName}/${results.js["fetchTime"].replace(/:/g, "_")}.json`, results.json, err => { if (err) throw err; } ); }); } else { throw "You haven't passed a URL to Lighthouse"; }
View Gist
Next steps
With the completion of this basic Google Lighthouse tool, there’s plenty of ways to develop it further. For example:
Some kind of simple online dashboard that allows non-technical users to run Lighthouse audits and view metrics develop over time. Getting stakeholders behind web performance can be challenging, so something tangible they can interest with themselves could pique their interest.
Build support for performance budgets, so if a report is generated and performance metrics are slower than they should be, then the tool outputs useful advice on how to improve them (or calls you names).
Good luck!
The post Build a Node.js Tool to Record and Compare Google Lighthouse Reports appeared first on CSS-Tricks.
Build a Node.js Tool to Record and Compare Google Lighthouse Reports published first on https://deskbysnafu.tumblr.com/
0 notes
Text
Reactを使ったモダンなフロントエンド開発の環境構築 - Qiita

はじめに
Reactを中心としたフロントエンド開発において、以下のような構成を見かけることが多いと思います。
UIライブラリとしてReact
型のある言語としてTypeScript
スタイル定義としてstyled-components
コンポーネントの開発環境としてStorybook
LinterとしてESLint
FormatterとしてPrettier
この記事では、各種ライブラリについて紹介したのち、それらを使う場合の環境構築についてハンズオン形式で説明します。
各種ライブラリの紹介
まず、各ライブラリがどのようなものなのかを簡単に紹介します。
ライブラリの使い方などは公式ドキュメントなどを参照するようにしてください。
React
ドキュメント
ReactはUI(ボタンやフォームなど)コンポーネントを作成するためのJavaScriptライブラリです。
似た立ち位置として、Vue.jsが上げられることも多いと思います。
公式ドキュメントが非常に充実しているので、初めての方は、Tutorialをやってみるのが良さそうです。
TypeScript
ドキュメント
TypeScriptは型を持ったJavaScriptのスーパーセットとして人気なプログラミング言語です。
コンパイルすると、JavaScriptのソースコードになります。
公式ドキュメント以外に、TypeScript Deep Diveが情報量が多く、分かりやすいと思います。
styled-components
ドキュメント
styled-componentsは、 CSSとほぼ同様のシンタックスを使ってスタイリングされたReactコンポーネントを作成できるライブラリです。
.cssファイルにCSSを書くのではなく、.jsや.tsxファイル内でCSSを書くようなイメージです。
公式ドキュメントを参照しながら、使ってみるのが良いと思います。
Storybook
ドキュメント
Storybookは、UIコンポーネントをアプリケーションとは独立した環境で開発できるツールです。
静的サイトとしてビルドすることで、コンポーネントのカタログとしても利用できます。
React用のチュートリアルも用意されています。
ESLint
ドキュメント
ESLintはJavaScriptのLinterです。
Linterを使うことで、コードの一貫性を高め、バグを未然に防げる可能性が高まります。
@typescript-eslint/eslint-pluginを使うことで、TypeScriptでも利用可能です。
Prettier
ドキュメント
Prettierはフロントエンド開発において人気なコードフォーマッターです。
JavaScriptをはじめとした複数の言語をサポートしています。
Prettierを使うことで、コードのフォーマットを意識することなく統一することができます。
環境構築
GitHubでリポジトリの作成から各種ライブラリのインストール、設定ファイルの作成などを行います。
最終的に、以下の事ができたらOKです。
npm run storybook: Storybookを起動して、React+TypeScript+styled-componentsで作成したコンポーネントが表示できる
npm run lint: ESLint + Prettierを使ってコードのチェックが行える
npm run tsc: TypeScriptのコードに対してコンパイルチェックが行える
Step0 事前準備
npm/Node.js/gitがインストールされていることを確認してください。
$ git --version
git version 2.20.1 (Apple Git-117)
$ node -v
v12.4.0
$ npm -v
6.9.0
バージョンを揃える必要はありませんが、必要に応じてLTSまたは最新版を利用するようにしましょう。
Step1 リポジトリの作成/git clone/gitignore
GitHubで今回作業をするリポジトリを作成しましょう。
新しいリポジトリを作成
リポジトリを作成後は、そのリポジトリをクローンしておいてください。
また、好きなgitignoreをリポジトリに配置しておきます。
例) Node.gitignoreを利用する場合
$ wget https://raw.githubusercontent.com/github/gitignore/master/Node.gitignore
$ mv Node.gitignore .gitignore
これでリポジトリの準備は整いました!
Step2 package.jsonを作成する
npmのinitコマンドを使って、package.jsonの雛形を作成しましょう。
$ npm init -y
Wrote to /dev/github.com/toshi-toma/todo-app-react/package.json:
{
"name": "todo-app-react",
"version": "1.0.0",
"description": "A Todo Application built with React, styled-components, TypeScript, E
SLint, Prettier, and Storybook",
"main": "index.js",
"scripts": {
"test": "echo \"Error: no test specified\" && exit 1"
},
"repository": {
"type": "git",
"url": "git+ssh://[email protected]/toshi-toma/todo-app-react.git"
},
"keywords": [],
"author": "",
"license": "ISC",
"bugs": {
"url": "https://github.com/toshi-toma/todo-app-react/issues"
},
"homepage": "https://github.com/toshi-toma/todo-app-react#readme"
}
npmのCLIには便利なコマンドがたくさん用意されています。ドキュメントをさっと見るだけでも面白いと思います。
Step3 Reactでコンポーネントを作成して、Storybookに表示する
Reactでコンポーネントを作成して、そのコンポーネントをStorybookに表示して動作や見た目を確認していくとスムーズな開発が行えます。
まずはReactとstyled-componentsでシンプルなコンポーネントを作成してみましょう。
必要なライブラリをインストールします。
$ npm i react react-dom styled-components
...
+ [email protected]
+ [email protected]
+ [email protected]
added 11 packages from 12 contributors, updated 2 packages and audited 31753 packages in 5.34s
Reactとstyled-componentsでシンプルなボタンを作成してみましょう。
src/index.js
import React from "react";
import styled from "styled-components";
const Button = styled.button`
background-color: #454545;
color: #fff;
`;
const SimpleButton = () => <Button>button</Button>; // 省略可能
export default SimpleButton;
次に、作成したボタンをStorybookで表示しましょう。
Googleで「Storybook React」と検索するとStorybook for Reactというタイトルの公式ドキュメントが出てくると思います。
Storybook for React
ドキュメントを読むと、Automatic setupコマンドが用意されているようです。
実行してみましょう。
$ npx -p @storybook/cli sb init --type react
...
+ @storybook/[email protected]
+ @storybook/[email protected]
+ @babel/[email protected]
+ [email protected]
+ @storybook/[email protected]
+ @storybook/[email protected]
added 1147 packages from 843 contributors and audited 31533 packages in 41.347s
...
• Installing dependencies. ✓
To run your storybook, type:
npm run storybook
For more information visit: https://storybook.js.org
これでStorybookの環境構築及びReactコンポーネントを表示する準備が整いました!簡単ですね。
npm run storybookを実行するとStorybookが表示されると思います。
あとは、先程作成したボタンをStorybookに表示しましょう。
stories/index.stories.js
import React from 'react';
import { storiesOf } from '@storybook/react';
import { action } from '@storybook/addon-actions';
import Button from '../src/index';
storiesOf('Button', module)
.add('with text', () => <Button onClick={action('clicked')}>Hello Button</Button>);
無事にReactとstyled-componentsで作成したコンポーネントをStorybookに表示することができました🎉
Step4 TypeScriptでコンポーネントを作成して、Storybookに表示する
次はReactとstyled-componentsに加えてTypeScriptを使ってコンポーネントを作成して、そのコンポーネントをStorybookに表示します。
まずはStep3で作成したコンポーネントをTypeScript化しましょう。
必要なライブラリをインストールします。
TypeScriptに加えて、型情報もインストールします。
$ npm i -D typescript
$ npm i -D @types/{react,react-dom,styled-components}
TypeScriptの設定ファイルの雛形をtscコマンドで作成します。
$ npx tsc --init
message TS6071: Successfully created a tsconfig.json file.
tsconfig.jsonというファイルが作成されたので、React用に編集します。
tsconfig.json
{
"compilerOptions": {
"target": "es5",
"module": "commonjs",
"lib": ["es2018", "dom"],
"jsx": "react",
"strict": true,
"rootDirs": [
"src"
],
"types": [
"react"
],
"esModuleInterop": true
},
"include": [
"./src/**/*"
],
"exclode": [
"node_modules/"
]
}
これでTypeScriptを使う準備が整っ���ので、コンポーネントをTypeScriptで書き換えてみます。
ReactとTypeScriptを使う場合のコンポーネントファイルの拡張子は.tsxになります。
mv src/index.js src/index.tsx
src/index.tsx
import React, { FC } from "react";
import styled from "styled-components";
const Button = styled.button`
background-color: #454545;
color: #fff;
`;
interface Props {
onClick: () => void;
}
const SimpleButton: FC<Props> = () => <Button>Done</Button>;
export default SimpleButton;
最後に書き換えたコンポーネントをStorybookで表示します。
TypeScriptを使う場合、別途Storybookの設定が必要です。
必要な設定については、公式ドキュメントが用意されています。
ドキュメントを読むと、必要な設定が@storybook/preset-typescriptとして用意されているので、これを利用します。
必要なライブラリをインストールしましょう。
$ npm i -D @storybook/preset-typescript react-docgen-typescript-loader ts-loader
$ npm i -D @types/{storybook__addon-actions,storybook__react}
...
...
+ @types/[email protected]
+ @types/[email protected]
npm i -D xxxを実行したログに以下のようなWarningが表示されていると思います。
...
npm WARN @storybook/[email protected] requires a peer of @types/webpack@* but none is installed. You must install peer dependencies yourself
...
@storybook/[email protected]は@types/webpack@*をpeer dependencyとしているようです。
@storybook/preset-typescriptのリポジトリを開いて、package.jsonを見てみましょう。
preset-typescript/package.json
...
"peerDependencies": {
"@types/webpack": "*",
"react-docgen-typescript-loader": "*",
"ts-loader": "*"
}
peerDependenciesとして@types/webpackが指定されているので、インストールしておきましょう。
$ npm i -D @types/webpack
+ @types/[email protected]
あとは.storybook/presets.jsを作成して、.storybook/presets.jsと.storybook/config.jsを以下のように編集するだけです。
presets.js
module.exports = ["@storybook/preset-typescript"];
config.js
import { configure } from '@storybook/react';
// automatically import all files ending in *.stories.js
- const req = require.context('../stories', true, /\.stories\.js$/);
+ const req = require.context('../src', true, /\.stories\.tsx$/);
function loadStories() {
req.keys().forEach(filename => req(filename));
}
configure(loadStories, module);
storiesファイルの拡張子も.jsから.tsxに変更しましょう。
$ mkdir src/stories
$ mv stories/index.stories.js src/stories/index.stories.tsx
$ rm -rf stories
npm run storybookでコンポーネントが表示されたら成功です🎉
また、TypeScriptで書いたコードはコンパイルを実行することで静的型付けによる型チェックを行えます。
型チェックを行なうnpm scriptsを追加しておきましょう。
package.json
"scripts": {
...
+ "tsc": "tsc --noEmit",
ここまでの作業によるpackage.jsonの差分を出しておきます。
...
"description": "A Todo Application built with React, styled-components, TypeScript, ESLint, Prettier, and Storybook",
"main": "index.js",
"scripts": {
- "test": "echo \"Error: no test specified\" && exit 1"
+ "test": "echo \"Error: no test specified\" && exit 1",
+ "tsc": "tsc --noEmit",
+ "storybook": "start-storybook -p 6006",
+ "build-storybook": "build-storybook"
},
"repository": {
"type": "git",
@@ -16,5 +18,28 @@
"bugs": {
"url": "https://github.com/toshi-toma/todo-app-react/issues"
},
- "homepage": "https://github.com/toshi-toma/todo-app-react#readme"
+ "homepage": "https://github.com/toshi-toma/todo-app-react#readme",
+ "dependencies": {
+ "react": "^16.9.0",
+ "react-dom": "^16.9.0",
+ "styled-components": "^4.3.2"
+ },
+ "devDependencies": {
+ "@babel/core": "^7.5.5",
+ "@storybook/addon-actions": "^5.1.10",
+ "@storybook/addon-links": "^5.1.10",
+ "@storybook/addons": "^5.1.10",
+ "@storybook/preset-typescript": "^1.1.0",
+ "@storybook/react": "^5.1.10",
+ "@types/react": "^16.9.1",
+ "@types/react-dom": "^16.8.5",
+ "@types/storybook__addon-actions": "^3.4.3",
+ "@types/storybook__react": "^4.0.2",
+ "@types/styled-components": "^4.1.18",
+ "@types/webpack": "^4.32.1",
+ "babel-loader": "^8.0.6",
+ "react-docgen-typescript-loader": "^3.1.1",
+ "ts-loader": "^6.0.4",
+ "typescript": "^3.5.3"
+ }
}
Step5 ESLintとPrettierでLintとFormatを導入する
TypeScriptのコードをESLintでLint、PrettierでFormatできるようにしましょう。
今回は手順をいくつか省略できるように、npmで公開されているeslint-configを利用します。
ここで利用するルールは自分の好みに応じてカスタマイズしてOKです。
npmの検索窓で「eslint typescript prettier」と検索してみましょう。
以下の手順では、airbnbが提供しているeslint-config-airbnbとTypeScript、Prettierのサポートが入ったeslint-config-airbnb-typescript-prettierを利用します。
eslint-config-airbnb-typescript-prettier
パッケージのページに書いてある説明を参考に、必要なライブラリをインストールします。
$ npm i -D eslint@^5.3.0 prettier@^1.18.2 eslint-config-airbnb-typescript-prettier
+ [email protected]
+ [email protected]
+ [email protected]
added 106 packages from 69 contributors and audited 32518 packages in 10.364s
次にESLintの設定ファイルである.eslintrc.jsを作成して、以下のように設定を書きます。
.eslintrc.js
module.exports = {
extends: "airbnb-typescript-prettier"
};
ESLintの設定が終わったら、npm scriptsを追加しておきましょう。
package.json
"scripts": {
+ "lint": "eslint --ext .ts,.tsx src/",
+ "lint:fix": "eslint --ext .ts,.tsx src/ --fix",
これで次からnpm run lintを実行することで、srcディレクトリ以下のTypeScriptファイルに対してLintとFormatチェックが実行されます。
$ npm run lint
> eslint --ext .ts,.tsx src/
/dev/github.com/toshi-toma/todo-app-react/src/index.tsx
15:23 error Insert `⏎` prettier/prettier
/dev/github.com/toshi-toma/todo-app-react/src/stories/index.stories.tsx
1:19 error Replace `'react'` with `"react"` prettier/prettier
3:1 error '@storybook/react' should be listed in the project's dependencies, not devDependencies import/no-extraneous-dependencies
....
✖ 8 problems (8 errors, 0 warnings)
6 errors and 0 warnings potentially fixable with the `--fix` option.
FormatやいくつかのLintエラーは自動で修正が可能です。
npm run lint:fixを実行してみましょう。
$ npm run lint:fix
> [email protected] lint:fix /dev/github.com/toshi-toma/todo-app-react
> eslint --ext .ts,.tsx src/ --fix
/dev/github.com/toshi-toma/todo-app-react/src/stories/index.stories.tsx
3:1 error '@storybook/react' should be listed in the project's dependencies, not devDependencies import/no-extraneous-dependencies
4:1 error '@storybook/addon-actions' should be listed in the project's dependencies, not devDependencies import/no-extraneous-dependencies
✖ 2 problems (2 errors, 0 warnings)
自動で修正されました🎉
... should be listed in the project's dependencies, not devDependencies import/no-extraneous-dependenciesとエラーがでています。
ESLintの設定は必要に応じて調整しましょう。
以下のように設定を変更することで、エラーが直るはずです。
.eslintrc.js
module.exports = {
extends: "airbnb-typescript-prettier",
rules: {
"import/no-extraneous-dependencies": ["error", {
devDependencies: ["**/*.stories.tsx"],
peerDependencies: false
}]
}
};
Step6 VSCodeでファイル保存時に自動でフォーマットする
最後に、エディタにVSCodeを利用している人を想定して、ファイル保存時にフォーマットエラーなどの自動修正を行えるようにします。
まず、VSCodeのExtensionsでVSCode ESLintをインストールしておきましょう。
あとは、以下のように.vscode/settings.jsonを修正します。
{
"eslint.autoFixOnSave": true,
"eslint.validate": [
"javascript",
"javascriptreact",
{ "language": "typescript", "autoFix": true },
{ "language": "typescriptreact", "autoFix": true }
]
}
さいごに
これで
React+styled-components+TypeScriptでコンポーネントを開発
作成したコンポーネントはStorybookで動作確認
適宜ESLintやPrettierを利用してコーディングを行い、ファイル保存時に自動で修正
が行えるようになり、環境構築終了です🎉
実際にWebアプリを開発する場合、webpackやwebpack-dev-serverなどをインストールして、設定をする必要があります。それについては余裕があれば別途追記します🙏
0 notes
Text
Migrating to Android X (even though I didn’t want to)
My project was using React Native 0.59, and after having to run ‘npm audit fix’ my project suddenly got updated to 0.60.4. After lots of tears this is what worked for me finally.
Open the gradle.properties file and add in the two lines as shown here
android.useAndroidX=true
android.enableJetifier=true
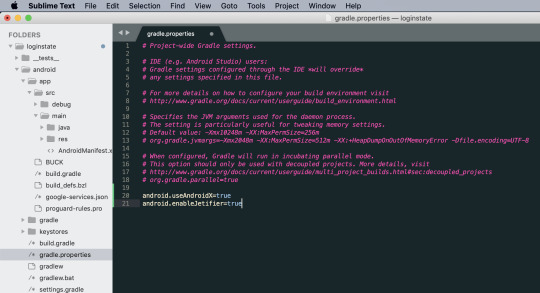
Next open the android folder (project_name/android) in Android Studio
Check that your <project_name> is selected on the left sidebar, then go to Refactor, and click Migrate to Android X.

After confirmation of a backup and selecting Migrate, click Do Refactor in the bottom area.
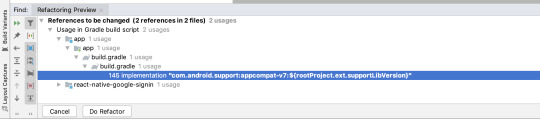
And that should be the migration done without any errors. Now to make react-native-fbsdk work again... sigh.
0 notes
Text
Found 4 vulnerabilities on npm install
I am just getting started with react-native. On installing this package
npm install --save react-native-validator-form
https://github.com/NewOldMax/react-native-validator-form/issues/3
I was prompted to npm audit and I was shown 4 vulnerabilities (listed above)
After running the 2 helper commands, I was prompted with another 2 vulnerabilities (see link)
How can I fix the remaining issues?
Updating the respective npm packages didn't work.
Not sure how to proceed?
https://codehunter.cc/a/reactjs/found-4-vulnerabilities-on-npm-install
0 notes
Text
npm v7 Series - Introduction
>> Arborist Deep Dive
Quite a lot has happened in npm since our last update way back in 2019. We're overdue for a status update on npm v7.
Despite some massive distracting changes (some unfortunate, some very fortunate), development work has been proceeding steadily.
Yesterday, Edward Thomson presented a demo of a few of the features coming in npm v7 at GitHub Satellite. The Q&A session was awesome, and it was clear that a lot of you are excited for this update to the npm CLI, and have a lot of questions that unfortunately couldn't be adequately answered in such a short time.
This post started as a brief update on what we've been doing, intended to go live along with the talk, but it got long. So, instead, this is the first post, with more to come, where I take you all through some of the major changes coming in npm v7, the thinking and motivation behind them, and how they might affect you and your work.
Vision
npm v7 is based on a handful of technical and user experience principles, and each post in this series will tie back to one or more of these in some way.
Reduce noise that is not actionable. Or, in other words "make npm yell at you less". We've gone through the entire project from the data management to the presentation layers, stripping output that doesn't provide worthwhile information.
Manage your packages for you. There are a handful of places in npm where v6 and earlier versions sort of throw up their hands and make you fix stuff by yourself. But npm is a package manager! It shouldn't make you manage packages, that's its job!
Strict separation of concerns. Moving forward, the npm CLI itself is becoming strictly the user-interface layer, and we've moved out all complex tree management and registry interactions to @npmcli/arborist, pacote, and the various libnpm* modules.
Be as fast as possible while behaving correctly. The key to fast software is to do as little as possible, including doing as little waiting as possible. From the refactor to use Minipass streams to refactoring out a decade's worth of compatibility fixes for long-dead Node.js versions, npm v7 is leaner and faster because it's lazier.
If we know the right thing to do, let's not yell at you to do it. Let's just do it for you, and do it all the way the first time. That's what npm loves you means. It means taking care of you and your project like a good and faithful assistant, only troubling you to get involved when absolutely necessary.
Coming Attractions
In the coming npm v7 posts, we'll cover:
A deep dive on Arborist, the tree management and analysis utility that does a lot of heavy lifting in npm v7.
Updates and impacts from some of the major refactoring that's happened in the npm CLI dependency stack over the last year.
Automatically installing peerDependencies: why, how, and what you might want to be aware of.
Improvements to the performance, effectiveness, and UI of npm audit.
Updates to the package-lock.json format, added handling for yarn.lock files, and why we are going to keep using package-lock.json.
Support for acceptDependencies
Changes to how npm handles install scripts (RFC0021 RFC0022 and RFC0024)
Fixing the "noisy chokidar/fsevents" problem, and how this is related to npm fund.
Updates to permission handling while running as root.
Dropping the --depth config in npm update and npm outdated.
Changes to config options (especially, config options that determine what gets installed).
Improvements to the handling of "files" in package.json.
Workspaces
Overrides
Staged publishes
And, presumably, updates about the beta and eventual GA releases, because this is going to take a minute :)
RFC Process
The npm CLI team has been running an open RFC process for the last several months now, and the impact on our development process has been great.
Usually, writing the code is the easy part. The hard part is all the thinking and talking that goes into making sure we're writing code for a feature that users will benefit from, and that we've explored the edge cases well enough to be confident we're not overlooking something important.
If you're interested in getting involved with npm's design process, we want you to participate! Building something like this is a team effort, and we all benefit from getting a broad range of perspectives from our community.
Is there something that you really wish npm would do, or do differently, or stop doing? Head over to npm/rfcs and give us a proposal. Obviously the more engaged and thorough you can be, the more easy it'll be for us to get it done, but every great idea has to start somewhere, so don't feel like you have to have all the answers before you begin :)
Thanks!
If there's something you'd like to see covered around npm v7, you can post an issue on the npm/npm-v7-blog repo.
Stay tuned for more from us, and I hope these posts prove to be fun and informative!
>> Arborist Deep Dive
9 notes
·
View notes
Text
npm audit fix - the security problem with dependencies
As anyone who's worked with frontend, particularly with npm packages would know - dependency management can be the bane of your existence. The reason is that as time goes on, things get outdated and security vulnerabilities arise. Since many packages are left unmaintained because of the package author losing interest in the product, often security vulnerabilities are just left unfixed. Even if the author does issue a security fix, this often means that the dependencies that the dependency itself relies on, have to be updated. Engineers like myself are reluctant to update dependencies because it typically means that something unexpected will break, and you'll have no idea why. This only reinforces the age old saying - "if it ain't broke, don't fix it".
Here is a screenshot of what I see whenever I run 'npm install', which reinstalls all the project's dependencies. NPM stands for node package manager, and is a tool used for package management. Yikes!

0 notes
Last Seen Blogs

avast-activation-code-blog
Avast Activation Code


aleshaxd
ayo alesha

zyciejestbessesu
nie rozumiesz mnie

nicholsonbertram83
The Blogging of Hvidberg 664