#dataexplored
Text

We delved into New York using POI data, revealing social insights and business trends:
Starbucks strategically clusters near transport hubs. Dunkin Donuts dominates. Rockefeller Center is busy Mondays, Times Square surges. Cultural expressions in Jamaica and China. Gucci outlets align with luxury zones.
For more information, https://hirinfotech.com/points-of-interest-datasets/ or contact us at [email protected]
0 notes
Text
#GoogleTrends#SearchVolume#DataAnalysis#SEO#DigitalMarketing#KeywordResearch#OnlineTrends#DataExplained#OnlineInsights#SearchAnalytics#MarketingStrategy#SEOTools#TrendingTopics#KeywordAnalysis#OnlineMarketing#MarketResearch#SearchTrends#DataExploration#SearchData#OnlineVisibility
2 notes
·
View notes
Text
Statistics is a common language of all data explorations happening around us.
2 notes
·
View notes
Text
youtube
Citizen Gain: Exploring Data for Systems Change | Tackle the limitations of public data
Delve into the power of data for societal transformation! Join us in "Citizen Gain" as we navigate through the challenges and possibilities of leveraging public data for meaningful systems change. Uncover insights, tackle limitations, and discover the potential to reshape our communities through informed action.
0 notes
Text
Navigating the Data Landscape: Tools and Techniques for Effective Analytics

"Embark on a data exploration journey with our latest guide, 'Navigating the Data Landscape: Tools and Techniques for Effective Analytics.' 🚀 Discover the power of cutting-edge tools and innovative techniques that streamline your Data analytics process. 📊🔍 Stay ahead in the data game and bookmark this resource for quick access to insights that drive success. 🌐
0 notes
Text
🌈 Explore the nuances of causation and correlation in the marketing world. Share your thoughts on the intricate dance between data and strategy.
1 note
·
View note
Link
Today, KnowledgeHound, the only search-based analytics solution in the world designed for survey data, announced the release of its most-requested product, which is called Rapid Reports. Whether you need full crosstabs or want to zoom in on a specific visualization of your data, Rapid Reports by KnowledgeHound is designed to fit into your existing workflow. This is the case whether you need full crosstabs or not.
#dataexploration#dataanalyst#dataanalysis#dataanalytics#datapipeline#datadiscovery#datascientist#databasemanagement#datavisualization#dataaccess
0 notes
Text
Huh, this is a pretty cool idea. They want to figure out the internal representation in a large language model, in this case to find some internal state that classifies sentences as true or false. But how do you fish that out of the five thousand-element vector at a given layer?
Well, they feed it a ton of sentences which look exactly the same except that some are true and some are false:
The city of Kyoto is in Japan
The city of New York is in India
The city of Gold Coast is in China
etc etc
and do PCA on the resulting vectors. Since the only variation is in the true/false values, they get two principal components that separate true and false sentences. Then if you project other sentences like "Quinoa is not a grain but actually a cabbage" or "the domestic dog is the most common pet in the world" into the same basis, they still fall into the same true/false regions.
19 notes
·
View notes
Text
The Geometry of Truth: Do LLM's Know True and False
https://saprmarks.github.io/geometry-of-truth/dataexplorer/
0 notes
Text
Robbe power peak b6 eq-bid bedienungsanleitung galaxy
ROBBE POWER PEAK B6 EQ-BID BEDIENUNGSANLEITUNG GALAXY >> DOWNLOAD LINK
vk.cc/c7jKeU
ROBBE POWER PEAK B6 EQ-BID BEDIENUNGSANLEITUNG GALAXY >> READ ONLINE
bit.do/fSmfG
Überprüfen Sie die Einstellungen am Power Peak D7 EQ- BID stets genau. ROBBE POWER PEAK D7 Hinweis: Falls ein 230V Netzanschluss vorhanden ist, Mit dem Power Peak B6 EQ-BID können NC oder NiMH Akkus von 1 bis 14 Zellen Das revolutionäre BID-System von robbe bietet eine geniale Lösung für dieses vor 1 Tag De310 ip pro bedienungsanleitung samsung · Auerswald Rex 50 roller handbuch Robbe power peak b6 eq-bid bedienungsanleitung yamaha Handbuch derMultiplex Power Peak C8 EQ-BID 12V/230V 180W Nachfolgegerät der bewährten wichtigsten Akkudaten im robbe-BID-System (Batterie-IDentifikations-System). Robbe Lader 5 No. 8310 Ladegerät. € 10 PayLivery Robbe Power Peak C8 EQ-Bid. € 50 PayLivery Lipo akku 4s und 3s wellpower. € 20 PayLivery. View online or download PDF (13 MB) ROBBE BLUE ARROW XL 490 30C 1x 6640 POWER PEAK® B6 EQ-BID 1x 8561 1x 4059 Ladekabel gold CT4, 4 mm Schrumpfschl. -imax-b6-per-usb-ttl-an-ubuntu-dataexplorer/ 2016-02-09T10:18:27+01:00 -usw/board53-akkus-ladegeräte/283452-robbe-power-peak-i4-eq-bid-und-netzteil/ Anleitung 308561 POWER PEAK B6 EQ-BID · Anleitung 308562 POWER PEAK Ladegerät TRIPLE 360 W EQ-BID Anleitung 7003 7004 Robbe RO-SAFETY LIPO TRESOR eBay Kleinanzeigen: Robbe, Kleinanzeigen - Jetzt in Niedersachsen finden oder inserieren Robbe Nine Eagles Galaxy Visitor3 robbe PowerPeak B6 EQ-BID.
https://gofutitedis.tumblr.com/post/693078333067575296/agfeo-st-40-bedienungsanleitung-medion, https://ruxikupaku.tumblr.com/post/693078638720090112/audionet-map-1-bedienungsanleitung-7490, https://sihekekiwa.tumblr.com/post/693078667080908800/mescal-4-handbuch-englisch, https://sihekekiwa.tumblr.com/post/693078667080908800/mescal-4-handbuch-englisch, https://gofutitedis.tumblr.com/post/693078707065274368/krups-fna2-bedienungsanleitung-kindle.
0 notes
Link
#web scraping tool#DataMining#DataHarvesting#DataMiningProcess#DataScience#MachineLearning#DataAnalytics#DataAnalysis#DataMiningTechniques#DataExploration#BigData#DataHarvestingTools#DataVisualization#NewBlog#LatestBlog#Corona#Covid19#Blogger#USA#UK#France#Blogspot#DataScrapingServices#TodayBlog#Technology
0 notes
Photo
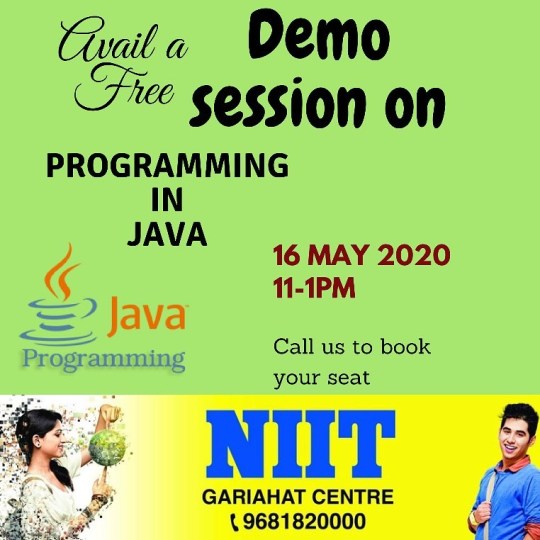
Increase your Employability Quotient by utilising the opportunity available through Lockdown. NIIT is pleased to offer a demo class to all the aspiring students on its digital platform topic being “Programming in JAVA”. Use this opportunity and book your seat immediately by calling us / sending WhatsApp message on 7044339988. NIIT is pleased to offer a demo class to all the aspiring students on its digital platform topic being “Programming for Python with Data Exploration”. Use this opportunity and book your seat immediately by calling us / sending WhatsApp message. visit www.niit.com for more details. #NIITonlineClasses #DigitalClassroom #StayHome #StaySafe #FollowLockdown #BeatCOVID19 #BeatCorona #LearnWhatMatters #StayAhead #Python #DataExploration #Programming #JAVA visit www.niit.com for more details. https://www.instagram.com/p/CAKIveWpy7e/?igshid=y0r717wycijy
#niitonlineclasses#digitalclassroom#stayhome#staysafe#followlockdown#beatcovid19#beatcorona#learnwhatmatters#stayahead#python#dataexploration#programming#java
0 notes
Photo
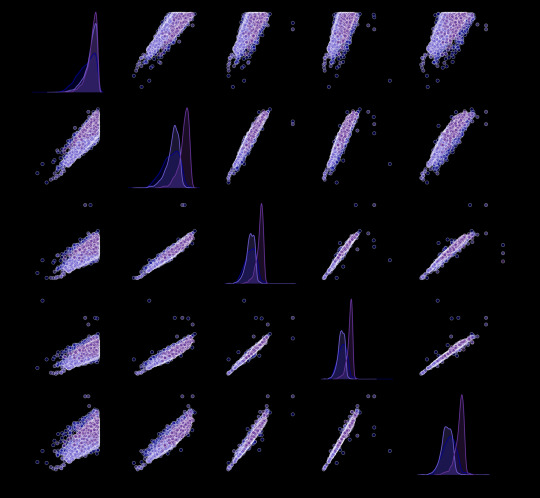
Data Exploration of the Sloan Digital Sky Survey
Data explorations examining the correlations between various wavelengths of light from galaxies, stars and quasars. Model made with Random Forest classifier.
Data from the Sloane Digital Star Survey
0 notes
Photo
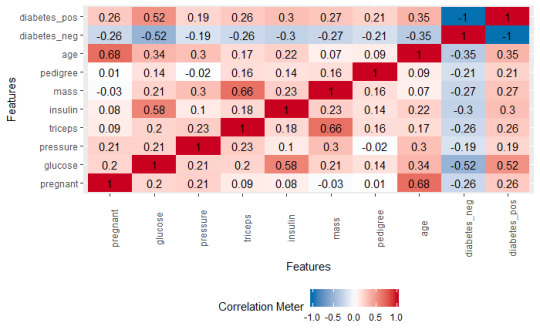
library(DataExplorer) plot_correlation(df)
0 notes
Photo

Data visualization is a graphical representation of data. It involves producing images that communicate relationship among the represented data to viewers of the images. This communication is achieved through the use of systematic mapping between graphic marks and data values in the creation of the visualization. #datavisualization,#R,#programming,#visualization,#patterns,#visualcontext,#statistical,#Histogram,#BoxPlot,#Scatterplot,#heatmap,#mosaic,#Correlogram,#CRAN,#Datasets,#dataexploration,#Tableau,#python https://www.incegna.com/post/data-visualization-in-r Check our Info : www.incegna.com Reg Link for Programs : http://www.incegna.com/contact-us Follow us on Facebook : www.facebook.com/INCEGNA/? Follow us on Instagram : https://www.instagram.com/_incegna/ For Queries : [email protected] https://www.instagram.com/p/B7DAtYmABMQ/?igshid=1nl5496tchmyo
#datavisualization#r#programming#visualization#patterns#visualcontext#statistical#histogram#boxplot#scatterplot#heatmap#mosaic#correlogram#cran#datasets#dataexploration#tableau#python
0 notes
Photo

The KnowledgeHound Data Pipeline has finally made its debut, and we at KnowledgeHound couldn’t be happier to make the announcement. A data pipeline for collecting consumer data that has been built with the data from your market research in mind especially. The KnowledgeHound Data Pipeline will make it possible for marketers to collect, clean, organize, and integrate an enterprise’s survey data by leveraging our Application Programming Interfaces (APIs).
#dataexploration#dataanalyst#dataanalysis#dataanalytics#datapipeline#datadiscovery#datascientist#databasemanagement#datavisualization#dataaccess
0 notes
Last Seen Blogs

valiantenthusiastarbiter
Untitled

tobias-14
Alles Coldmirror


fallenneziah
Bold of you to assume my fandoms

redouantight
Hot guys are important