
dragonflycap
Dragonfly Capital Tumblr
Gregory W. Harmon, CMT, CFA, is founder and president of Dragonfly Capital Management, a company that offers Managed Accounts and a Premium Trading Service. He has more than 30 years of trading experience.
3165 posts
Don't wanna be here? Send us removal request.
Last Seen Blogs

zaner210
210 Underground

ready-set-woah
Ready.
SET.
Woah.

gayxfullbuster
fifty shades of gray fullbuster

romimemoir
Untitled

splittervonmir
My secret sweet little trubbel Me
Text
What to expect from the stock market this week

Last week, the review of the macro market indicators saw with the April options expiry in the books, equity markets finished the week black and blue after taking a beating. Elsewhere looked for Gold ($GLD) to continue its consolidation at all-time highs in the uptrend while Crude Oil ($USO) pulled back in its uptrend. The US Dollar Index ($DXY) continued to drift to the upside while US Treasuries ($TLT) pulled back in their downtrend. The Shanghai Composite ($ASHR) looked to continue the consolidation in its short term uptrend while Emerging Markets ($EEM) dropped in broad consolidation.
The Volatility Index ($VXX) looked to remain low but rising keeping the pressure on equity markets. Their charts looked weak, especially on the shorter timeframe. On the longer timeframe both the $QQQ and $SPY remained above break out levels from the start of the year, not a problem yet. The $IWM had fallen back into its long channel consolidation though, a failed break out. Those often lead to fast moves lower.
The week played out with Gold dropping back and finding quickly support while Crude Oil found support and started back higher late in the week. The US Dollar built a bull flag while Treasuries continued their move lower. The Shanghai Composite continued to consolidate under resistance while Emerging Markets found support and rose toward the top of the consolidation range.
Volatility fell back to the mid teens. This relieved the pressure on equities and they responded by starting the week with a 2 day move higher. All found stalled Wednesday and pulled back, but the drove higher again Thursday and Friday. This resulted in the SPY, IWM and QQQ ending off last week’s lows, but a little more work to put in to convince the pullback is over. What does this mean for the coming week? Let’s look at some charts.
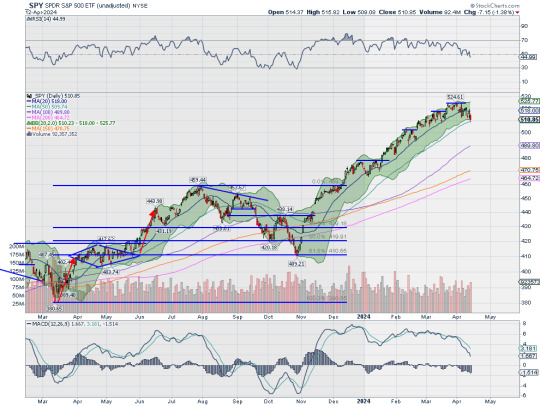
SPY Daily, $SPY

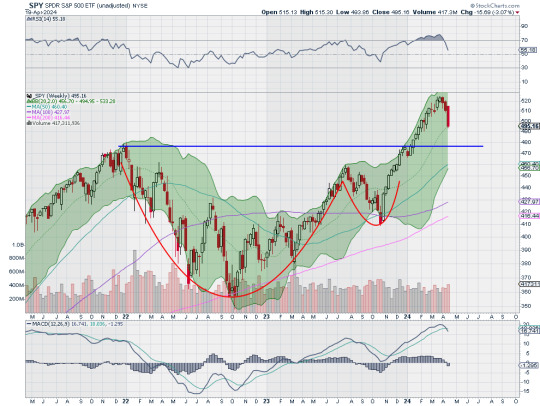
The SPY came into the week with its first 5% pullback of the year. It bounced Monday and printed an inside real body candle. It followed with a move higher Tuesday before getting stalled Wednesday and opening with a gap down Thursday. It rose all day though and followed higher on Friday to touch the 20 day SMA before closing just below it. The RSI on the daily chart is rising at the midline with the MACD curled up and moving towards a cross.
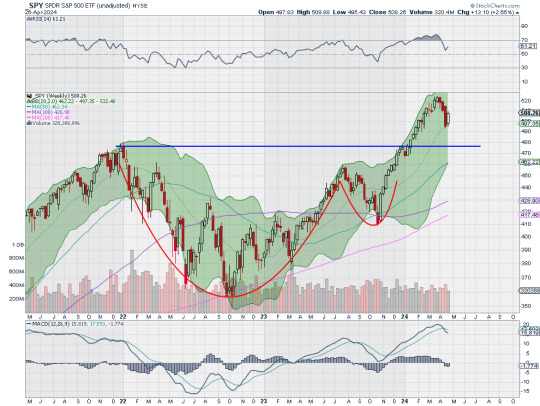
The weekly chart had an inside print, a possible reversal signal, holding over the 20 week SMA. The RSI is moving higher in the bullish zone with the MACD crossed down and falling but with the slope leveling. There is support at 503.50 and 501.50 then 498.50 and 495 before 491 and 488. Resistance is at 510 and 513.50 then 517.50 and 520.50 before 524.50. Pause in Uptrend.
SPY Weekly, $SPY
With just 2 trading days left in April, equity markets showed some resilience with a rebound from their first 5% or more pullbacks this year. Elsewhere look for Gold to continue its uptrend while Crude Oil pauses in its move higher. The US Dollar Index continues to drift to the top of consolidation while US Treasuries resume their downtrend. The Shanghai Composite shifts into short term consolidation while Emerging Markets consolidate near the top of a broad range.
The Volatility Index looks to remain low making the path easier for equity markets to the upside. The SPY and QQQ charts look strong, especially on the longer timeframe. On the shorter timeframe both the QQQ and SPY as well as the IWM are working on reversing their pullbacks. Use this information as you prepare for the coming week and trad’em well.
Join the Premium Users and you can view the Full Version with 20 detailed charts and analysis: Macro Week in Review/Preview April 26, 2024
0 notes
Text
4 Trade Ideas for Johnson & Johnson: Bonus Idea

Johnson & Johnson, $JNJ, comes into the week trying to round off a bottom. The RSI is rising out of an oversold condition with the MACD curling up towards a potential cross. There is resistance at 151 and 152 then 153.25 and 156 before 157.50 and 160 then 162.50. Support lower is at 144 and 140.50 then 136.50. Short interest is low under 1%. The stock pays a dividend with an annual yield of 3.35% and does not begin to trade ex-dividend until May 20th.
The company is expected to report earnings next on July 17th. The May options chain shows the largest open interest at the 145 then 150 and 140 strikes on the put side. The call side builds from 145 to a peak at 165. In the June chain it builds from 165 to a peak at 150 then tails to 130 on the put side. On the call side it builds from 145 to a peak at 170 then tails to 185. Finally, in the July chain, covering earnings, open interest builds from 160 to a peak at 105 before tailing to 135 on the put side. The call side is biggest at 160 and 170.
Johnson & Johnson, Ticker: $JNJ

Trade Idea 1: Buy the stock on a move over 148.25 with a stop at 143.
Trade Idea 2: Buy the stock on a move over 148.25 and add a May 145/140 Put Spread (85 cents) while selling the June 160 Call (40 cents).
Trade Idea 3: Buy the May/June 150 Call Calendar ($1.05) while selling the May 140 Put (50 cents).
Trade Idea 4: Buy the July 140/155 Bullish Risk Reversal.
If you like what you see sign up for more ideas and deeper analysis using this Get Premium link.
After reviewing over 1,000 charts, I have found some good setups for the week. These were selected and should be viewed in the context of the broad Market Macro picture reviewed Friday which with the April options expiry in the books, equity markets finished the week black and blue after taking a beating.
Elsewhere look for Gold to continue its consolidation at all-time highs in the uptrend while Crude Oil pulls back in its uptrend. The US Dollar Index continues to drift to the upside while US Treasuries pullback in their downtrend. The Shanghai Composite looks to continue the consolidation in its short term uptrend while Emerging Markets drop in broad consolidation.
The Volatility Index looks to remain low but rising keeping the pressure on equity markets. Their charts look weak, especially on the shorter timeframe. On the longer timeframe both the QQQ and SPY remain above break out levels from the start of the year, not a problem yet. The IWM has fallen back into its long channel consolidation though a failed break out. These often lead to fast moves lower. Use this information as you prepare for the coming week and trad’em well.
1 note
·
View note
Text
5 Trade Ideas for Monday: Analog Devices, Broadcom, Fedex, Lilly and Prudential
5 Trade ideas excerpted from the detailed analysis and plan for premium subscribers:
Analog Devices, Ticker: $ADI

Analog Devices, $ADI, comes into the week approaching support. It has a RSI dipping into the bearish zone with the MACD negative. Look for a break of support to participate…..
Broadcom, Ticker: $AVGO

Broadcom, $AVGO, comes into the week approaching support. It has a RSI in the bearish zone with the MACD negative. Look for ap drop through support to participate…..
Fedex, Ticker: $FDX
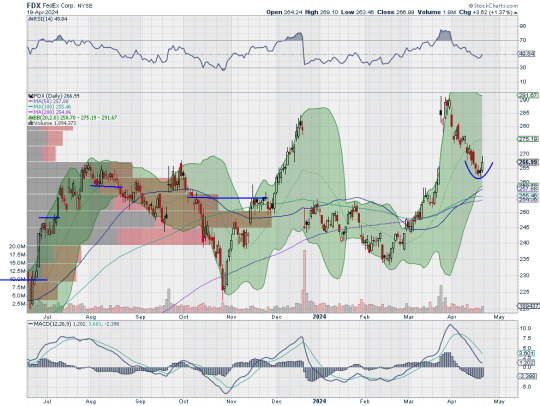
Fedex, $FDX, comes into the week possibly reversing higher. It has a RSI in the bullish zone with the MACD positive. Look for continuation to participate…..
Lilly, Ticker: $LLY
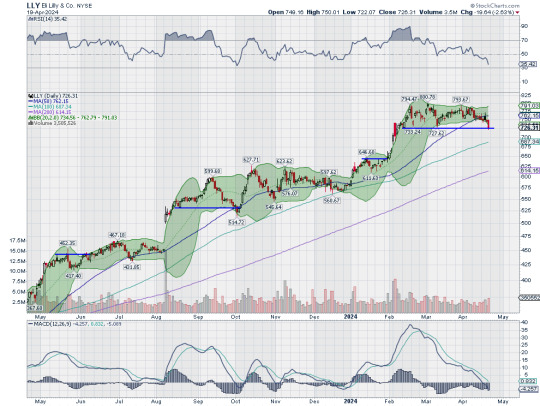
Lilly, $LLY, comes into the week at support. It has a RSI in the bearish zone with the MACD negative. Look for a push through support to participate…..
Prudential, Ticker: $PRU

Prudential, $PRU, comes into the week reversing higher. It has a RSI at the midline with the MACD negative but curling up. Look for continuation to participate…..
If you like what you see sign up for more ideas and deeper analysis using this Get Premium link.
After reviewing over 1,000 charts, I have found some good setups for the week. These were selected and should be viewed in the context of the broad Market Macro picture reviewed Friday which with the April options expiry in the books, equity markets finished the week black and blue after taking a beating.
Elsewhere look for Gold to continue its consolidation at all-time highs in the uptrend while Crude Oil pulls back in its uptrend. The US Dollar Index continues to drift to the upside while US Treasuries pullback in their downtrend. The Shanghai Composite looks to continue the consolidation in its short term uptrend while Emerging Markets drop in broad consolidation.
The Volatility Index looks to remain low but rising keeping the pressure on equity markets. Their charts look weak, especially on the shorter timeframe. On the longer timeframe both the QQQ and SPY remain above break out levels from the start of the year, not a problem yet. The IWM has fallen back into its long channel consolidation though a failed break out. These often lead to fast moves lower. Use this information as you prepare for the coming week and trad’em well.
1 note
·
View note
Text
What to expect from the stock market this week

Last week, the review of the macro market indicators saw heading into the April options expiration, equity markets showed some cracks in the uptrends. Elsewhere looked for Gold ($GLD) to continue its uptrend, but with perhaps a short term pause while Crude Oil ($USO) consolidated the move higher. The US Dollar Index ($DXY) looked to break to the upside while US Treasuries ($TLT) resumed their downtrend. The Shanghai Composite (ASHR) looked to consolidate in its move higher while Emerging Markets ($EEM) consolidated in a broad channel.
The Volatility Index ($VXX) looked to continue to slowly move higher keeping pressure on equity markets. The $QQQ looked the strongest, especially on the longer timeframe as it consolidates while the $SPY digested its strong move with a pullback. The $IWM seemed to have given up any chance of breaking out of the long consolidation as it fell back into the channel.
The week played out with Gold pushing up to 2400 per ounce and consolidating while Crude Oil moved lower out of consolidation. The US Dollar paused in its move higher while Treasuries printed new 5 month lows. The Shanghai Composite continued to consolidate around its moving average at resistance while Emerging Markets fell to fresh 2 month lows.
Volatility continued to rise in a slow fashion, reaching the October highs. This continued the pressure on equities and they moved lower all week. This resulted in the SPY, IWM and QQQ ending at 2 month lows and continuing to look weak. What does this mean for the coming week? Let’s look at some charts.
SPY Daily, $SPY
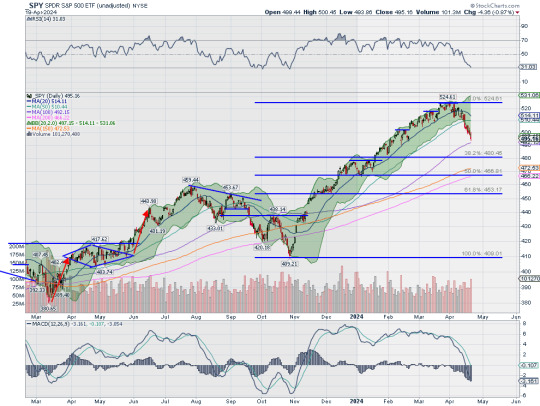
The SPY came into the week sitting on the 50 day SMA on the daily chart after a slow rolling pullback from a top at the end of March. It dropped down through that 50 day SMA Monday and continued lower the rest of the week. It closed Friday just above the 100 day SMA after a 6 day losing streak. This was the first time it had dropped 6 days in a row since marking the October 2022 market bottom, the last time. It is approaching a 38.2% retracement of the leg higher since October 2023. The RSI is falling in the bearish zone and about to push into oversold territory with the MACD negative and dropping.
The weekly chart show nearly a bearish Marubozu candle, suggesting more downside, ending at the 20 week SMA. The RSI is falling toward the midline in the bullish zone with the MACD crossed down and dropping. There is support lower at 491.50 and 488 then 478 and 473.50 before 470 and 466. Resistance higher is at 495 and 498.50 then 501.50 and 503.50 before 510 and 513.50. Pullback in Uptrend.
SPY Weekly, $SPY
With the April options expiry in the books, equity markets have finished the week black and blue after taking a beating. Elsewhere look for Gold to continue its consolidation at all-time highs in the uptrend while Crude Oil pulls back in its uptrend. The US Dollar Index continues to drift to the upside while US Treasuries pullback in their downtrend. The Shanghai Composite looks to continue the consolidation in its short term uptrend while Emerging Markets drop in broad consolidation.
The Volatility Index looks to remain low but rising keeping the pressure on equity markets. Their charts look weak, especially on the shorter timeframe. On the longer timeframe both the QQQ and SPY remain above break out levels from the start of the year, not a problem yet. The IWM has fallen back into its long channel consolidation though, a failed break out. These often lead to fast moves lower. Use this information as you prepare for the coming week and trad’em well.
Join the Premium Users and you can view the Full Version with 20 detailed charts and analysis: Macro Week in Review/Preview April 19, 2024
1 note
·
View note
Text
4 Trade Ideas for Costco: Bonus Idea

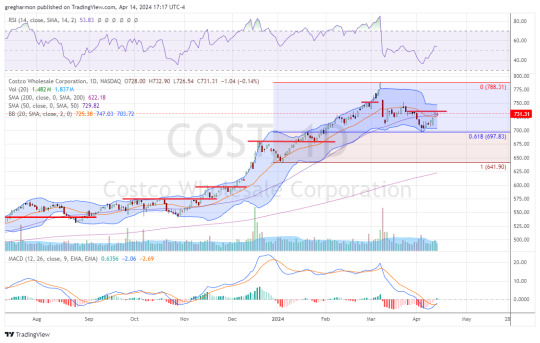
Costco, $COST, comes into the week back at its 20 and 50 day SMA's after a pullback that started with a gap down in early March. The RSI is trying to rise into the bullish zone with the MACD crossing up but negative. The leg up this time began after a 61.8% retracement of the last leg higher. There is resistance at 735 and 743 then 752 and 784. Support lower comes at 725 and 713 before 702.75. The stock pays a dividend with an annual yield of 0.63% and will begin to trade ex-dividend on April 25th.
The company is expected to report earnings next on May 30th. The April options chain shows the biggest open interest at the 720 put strike and the 735 call strike. In the May chain it is biggest at the 725 put and 750 call. The May 31st Expiry is just getting started but shows an expected move of 6.57% between now and expiry, covering the earnings report, or about $48. Finally, the June chain has biggest open interest at the 720 put and 745 call.
Costco, Ticker: $COST
Trade Idea 1: Buy the stock on a move over 735 with a stop at 710.
Trade Idea 2: Buy the stock on a move over 735 and add a May 730/710 Put Spread ($11.95) while selling the May 760 Calls ($11.00).
Trade Idea 3: Buy the May/June 750 Call Calendar ($12.60) and sell the May 720 Put ($11.50).
Trade Idea 4: Buy the June 710/740/790 Call Spread Risk Reversal (85 cents).
If you like what you see sign up for more ideas and deeper analysis using this Get Premium link.
After reviewing over 1,000 charts, I have found some good setups for the week. These were selected and should be viewed in the context of the broad Market Macro picture reviewed Friday which heading into the April options expiration saw equity markets showing some cracks in the uptrends.
Elsewhere look for Gold to continue its uptrend, but with perhaps a short term pause while Crude Oil consolidates the move higher. The US Dollar Index looks to break to the upside while US Treasuries resume their downtrend. The Shanghai Composite looks to consolidate in its move higher while Emerging Markets consolidate in a broad channel.
The Volatility Index looks to continue to slow move higher keeping pressure on equity markets. The QQQ looks the strongest, especially on the longer timeframe as it consolidates while the SPY digests its strong move with a pullback. The IWM seems to have given up any chance of breaking out of the long consolidation as it falls back into the channel. Use this information as you prepare for the coming week and trad’em well.
0 notes
Text
Dragonfly Capital - 5 Trade Ideas for Monday: Apple, Caterpillar, Mastercard, Nasdaq and RTX
Trade ideas excerpted from the detailed analysis and plan for premium subscribers:
Apple, Ticker: $AAPL
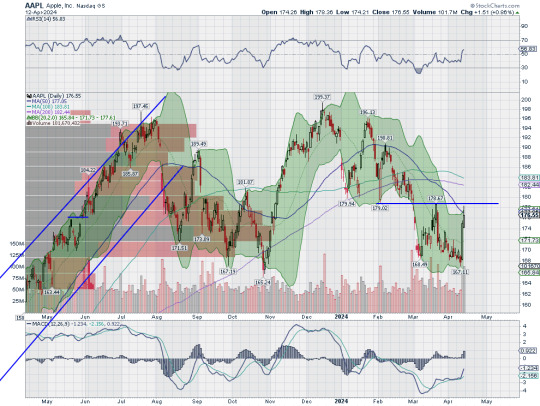
Apple, $AAPL, comes into the week approaching resistance. It has a RSI rising over the midline with the MACD moving higher. Look for a push over resistance to participate…..
Caterpillar, Ticker: $CAT

Caterpillar, $CAT, comes into the week pulling back from a top. It has a RSI dropping in the bullish zone with the MACD crossed down. Look for continuation to participate…..
Mastercard, Ticker: $MA
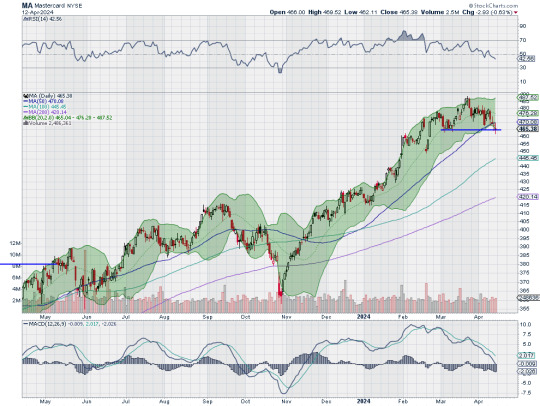
Mastercard, $MA, comes into the week pulling back to support. It has a RSI dropping in the bullish zone with the MACD negative. Look for a break of support to participate…..
Nasdaq, Ticker: $NDAQ
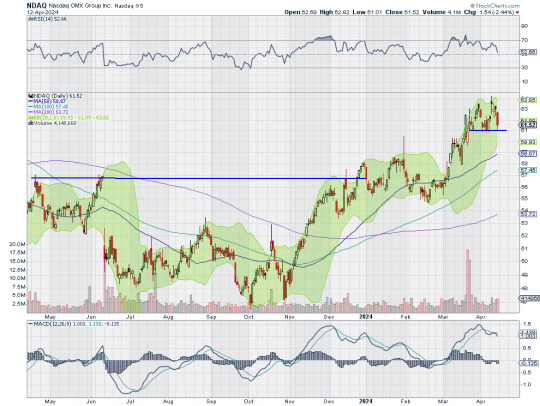
Nasdaq, $NDAQ, comes into the week at support. It has a RSI in the bullish zone with the MACD dropping. Look for a drop through support to participate…..
RTX, Ticker: $RTX

RTX, $RTX, comes into the week at support. It has a RSI dropping out of overbought territory with the MACD curling to cross down. Look for a drop through support to participate…..
If you like what you see sign up for more ideas and deeper analysis using this Get Premium link.
After reviewing over 1,000 charts, I have found some good setups for the week. These were selected and should be viewed in the context of the broad Market Macro picture reviewed Friday which heading into the April options expiration saw equity markets showing some cracks in the uptrends.
Elsewhere look for Gold to continue its uptrend, but with perhaps a short term pause while Crude Oil consolidates the move higher. The US Dollar Index looks to break to the upside while US Treasuries resume their downtrend. The Shanghai Composite looks to consolidate in its move higher while Emerging Markets consolidate in a broad channel.
The Volatility Index looks to continue to slow move higher keeping pressure on equity markets. The QQQ looks the strongest, especially on the longer timeframe as it consolidates while the SPY digests its strong move with a pullback. The IWM seems to have given up any chance of breaking out of the long consolidation as it falls back into the channel. Use this information as you prepare for the coming week and trad’em well.
11 notes
·
View notes
Text
What to expect from the stock market this week
Last week, the review of the macro market indicators saw with the first week of April in the books, equity markets looked in need of a rest. Elsewhere looked for Gold ($GLD) to continue its record run higher while Crude Oil ($USO) continued its move to the upside as well. The US Dollar Index ($DXY) continued to short term trend to the upside while US Treasuries ($TLT) might resume their downtrend. The Shanghai Composite ($ASHR) looked to continue the short term move higher while Emerging Markets ($EEM) consolidated under long term resistance.
The Volatility Index ($VXX) looked to remain low making the path easier for equity markets to the upside. Their charts also looked strong, especially on the longer timeframe. On the shorter timeframe the $QQQ was at risk for some downside with the $IWM in a messy short term uptrend and the $SPY the strongest but also seeing some profit taking show up.
The week played out with Gold continuing it run of record highs while Crude Oil met resistance and consolidated at 5½ month highs. The US Dollar found strength and pushed to 5½ month highs as well while Treasuries made new 4 month lows before a bounce Friday. The Shanghai Composite pulled back from a lower high while Emerging Markets broke down out of the rising short term channel.
Volatility rose up from a short term consolidation to the top of a rising wedge. This put pressure on equities late in the week and they responded by moving lower. This resulted in the IWM back at support which was prior resistance for 2 years, the QQQ continuing sideways in consolidation near the highs and the SPY touching a 1 month low. What does this mean for the coming week? Let’s look at some charts.
SPY Daily, $SPY
The SPY came into the week holding at the 20 day SMA on the daily chart after a pullback from the top. It held there Monday and Tuesday and then dropped below Wednesday in a reaction to the hotter than expected CPI print. Thursday saw it rise to retest the 20 day SMA and then fall back Friday to touch the 50 day SMA for the first time since the beginning of November. Price ended at the lower of the Bollinger Bands® with the RSI heading toward the bottom of the bullish zone and the MACD positive but dropping and approaching zero.
The weekly chart shows a second week headed lower, this one with a longer red candle. The RSI on this timeframe has dropped out of overbought territory with the MACD about to cross down. There is support lower at 510 and 503.50 then 501.50 and 498.50 before 495 and 491.50 with the retest of the Cup and Handle breakout at 476.75 lower. Resistance above is at 513.50 and 517.50 then 520.50 and 524.50. The 138.2% extension of the retracement of the 2022 pullback is above at 530 and then the Cup and Handle target at 560. Pullback in Uptrend.
SPY Weekly, $SPY

Heading into the April options expiration, equity markets showed some cracks in the uptrends. Elsewhere look for Gold to continue its uptrend, but with perhaps a short term pause while Crude Oil consolidates the move higher. The US Dollar Index looks to break to the upside while US Treasuries resume their downtrend. The Shanghai Composite looks to consolidate in its move higher while Emerging Markets consolidate in a broad channel.
The Volatility Index looks to continue to slow move higher keeping pressure on equity markets. The QQQ looks the strongest, especially on the longer timeframe as it consolidates while the SPY digests its strong move with a pullback. The IWM seems to have given up any chance of breaking out of the long consolidation as it falls back into the channel. Use this information as you prepare for the coming week and trad’em well.
Join the Premium Users and you can view the Full Version with 20 detailed charts and analysis: Macro Week in Review/Preview April 12, 2024
5 notes
·
View notes
Text
4 Trade Ideas for Old Dominion Freight Line: Bonus Idea

Old Dominion Freight Line, $ODFL, comes into the week breaking resistance to a new all-time high. The RSI is rising in the bullish zone with the MACD crossing up and positive. The Bollinger Bands® may be opening to the upside. There is no resistance higher. Support below 224.50 sits at 218 and 214 before 210. Short interest is low at 2.2%. The stock pays a small dividend yielding 0.46% and has traded ex-dividend since March 5th.
The company is expected to report earnings next on April 24th. The April options chain has open interest spread from 220 to 195 on the put side. The call side has it focused at 220 then 230. In the May chain the is a slug at 205 on the put side and at 215 and 220 on the call side. Finally, the June chain sees open interest focused from 195 to 185 on the put side and at 250 and 260 on the call side.
Old Dominion Freight Line, Ticker: $ODFL

Trade Idea 1: Buy the stock on a move over 225 with a stop at 216.
Trade Idea 2: Buy the stock on a move over 225 and add a May 220/205 Put Spread ($5.55) while selling the May 240 Call ($4.40).
Trade Idea 3: Buy the April/May 230 Call Calendar ($5.90) while selling the May 205 Put ($2.35).
Trade Idea 4: Buy the June 210/230/250 Call Spread Risk Reversal ($1.70).
If you like what you see sign up for more ideas and deeper analysis using this Get Premium link.
After reviewing over 1,000 charts, I have found some good setups for the week. These were selected and should be viewed in the context of the broad Market Macro picture reviewed Friday which with the first week of April in the books, saw equity markets in need of a rest.
Elsewhere looked for Gold to continue its record run higher while Crude Oil continue its move to the upside as well. The US Dollar Index to continue the short term trend to the upside while US Treasuries may resume their downtrend. The Shanghai Composite looks to continue the short term move higher while Emerging Markets consolidate under long term resistance.
The Volatility Index looks to remain low making the path easier for equity markets to the upside. Their charts also look strong, especially on the longer timeframe. On the shorter timeframe the QQQ is at risk for some downside with the IWM in a messy short term uptrend and the SPY the strongest but also seeing some profit taking show up. Use this information as you prepare for the coming week and trad’em well.
1 note
·
View note
Text
5 Trade Ideas for Monday: Avantor, Deere, Hartford, KKR and Meta
5 Trade ideas excerpted from the detailed analysis and plan for premium subscribers:
Avantor, Ticker: $AVTR

Avantor, $AVTR, comes into the week approaching resistance. It has a RSI in the bullish zone and a MACD positive. Look for a push over resistance to participate…..
Deere, Ticker: $DE

Deere, $DE, comes into the week at resistance. It has a RSI in the bullish zone with the MACD flat but positive. Look for a push over resistance to participate…..
Hartford Financial Services Group, Ticker: $HIG
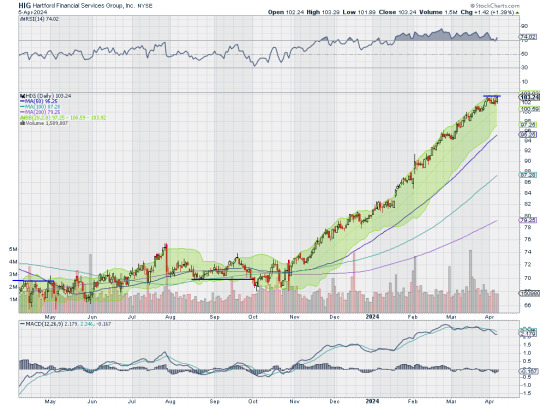
Hartford Financial Services Group, $HIG, comes into the week at resistance. It has a RSI in the bullish zone with the MACD positive. Look for a push over resistance to participate…..
KKR, Ticker: $KKR
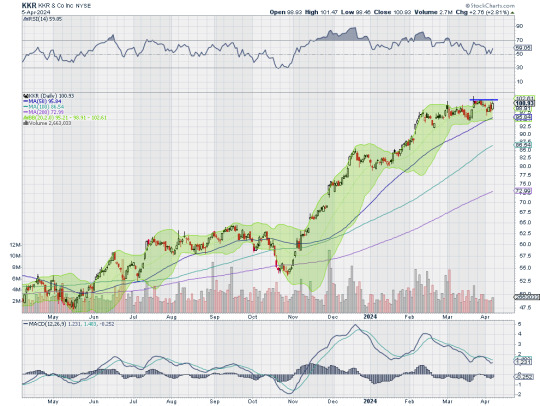
KKR, $KKR, comes into the week approaching resistance. It has a RSI in the bullish zone with the MACD positive. Look for a push over resistance to participate…..
Meta Platforms, Ticker: $META

Meta Platforms, $META, comes into the week breaking resistance. It has a RSI in the bullish zone with the MACD positive and crossing up. Look for continuation to participate…..
If you like what you see sign up for more ideas and deeper analysis using this Get Premium link.
After reviewing over 1,000 charts, I have found some good setups for the week. These were selected and should be viewed in the context of the broad Market Macro picture reviewed Friday which with the first week of April in the books, saw equity markets in need of a rest.
Elsewhere looked for Gold to continue its record run higher while Crude Oil continue its move to the upside as well. The US Dollar Index to continue the short term trend to the upside while US Treasuries may resume their downtrend. The Shanghai Composite looks to continue the short term move higher while Emerging Markets consolidate under long term resistance.
The Volatility Index looks to remain low making the path easier for equity markets to the upside. Their charts also look strong, especially on the longer timeframe. On the shorter timeframe the QQQ is at risk for some downside with the IWM in a messy short term uptrend and the SPY the strongest but also seeing some profit taking show up. Use this information as you prepare for the coming week and trad’em well.
1 note
·
View note
Text
What to expect from the stock market this week

Last week, the review of the macro market indicators saw with the First Quarter of the year in the books, equity markets exhibited strength. Elsewhere looked for Gold ($GLD) to continue its uptrend while Crude Oil ($USO) built on its move higher. The US Dollar Index ($DXY) continued to drift to the upside in consolidation while US Treasuries ($TLT) consolidated in their downtrend. The Shanghai Composite ($ASHR) looked to reverse the short term uptrend while Emerging Markets ($EEM) consolidated in a broad range.
The Volatility Index ($VXX) looked to remain very low and stable making the path easier for equity markets to the upside. Their charts looked strong, especially the $SPY on both timeframes. The $QQQ was showing some momentum divergence that could lead to more consolidation or a pullback while the $IWM looked to step up as it broke to 2 year highs.
The week played out with Gold continuing to the upside, printing 4 new all-time highs and ending the week at one while Crude Oil also continued higher making 5 month highs. The US Dollar met resistance and then held in a tight range while Treasuries continued to flirt with a new move lower. The Shanghai Composite jumped to resistance and held there through Wednesday before closing for the week while Emerging Markets are threatening to break the rising channel to the downside.
Volatility rose to 5 month highs and held there Friday. This put pressure on equities mid week and they responded with a move lower. The SPY joined the QQQ pulling back from recent tops with the IWM looking like a possible failed break out. What does this mean for the coming week? Let’s look at some charts.
SPY Daily, $SPY
The SPY came into the week just pennies off the all-time high it set the day before. It held there Monday but then gapped down Tuesday to the 20 day SMA. It held there Wednesday and then opened higher in the typical bounce Thursday back at the all-time high. But that did not hold up as 4 Fed Presidents delivered the message that rate hikes will be delayed. It fell back and printed a bearish engulfing Marubozu candle, a potential reversal. Friday, however, did not deliver another move lower, but instead an inside day to the upside had it close back over the 20 day SMA. The RSI is moving back higher after a touch at the midline with the MACD leveling and positive.
The weekly chart, however, printed a bearish engulfing candle. This comes with the RSI overbought but now pulling back and the MACD starting to roll over after a 6 month move higher. The Bollinger Bands® do continue to point higher though. There is resistance at 520.50 and 524.50 with the 138.2% extension of the retracement of the 2022 pullback at 530 then the Cup and Handle target at 560. Support lower is at 517.50 and 513.50 then 510 and 503.50 before 501.50 and 498.50. Uptrend.
SPY Weekly, $SPY

With the first week of April in the books, equity markets are looking in need of a rest. Elsewhere look for Gold to continue its record run higher while Crude Oil continues its move to the upside as well. The US Dollar Index continues to short term trend to the upside while US Treasuries may resume their downtrend. The Shanghai Composite looks to continue the short term move higher while Emerging Markets consolidate under long term resistance.
The Volatility Index looks to remain low making the path easier for equity markets to the upside. Their charts also look strong, especially on the longer timeframe. On the shorter timeframe the QQQ is at risk for some downside with the IWM in a messy short term uptrend and the SPY the strongest but also seeing some profit taking show up. Use this information as you prepare for the coming week and trad’em well.
Join the Premium Users and you can view the Full Version with 20 detailed charts and analysis: Macro Week in Review/Preview April 5, 2024
2 notes
·
View notes
Text
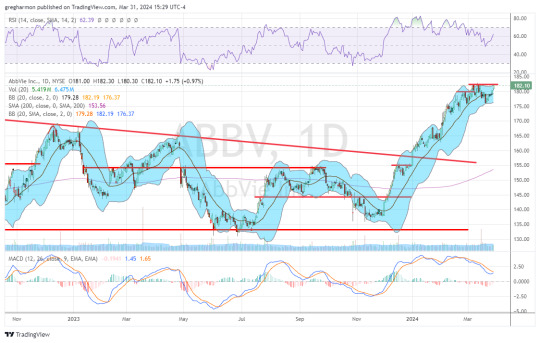
4 Trade Ideas for AbbVie: Bonus Idea

AbbVie, $ABBV, comes into the week approaching resistance and at an all-time high. It is still short of the target to 200 from a break of the descending triangle. The RSI has reset lower in the bullish zone and now has lots of room to the upside. The MACD is curling to cross up and positive after resetting lower. The Bollinger Bands® are starting to turn higher. There is no resistance above 182.50. Support lower sits at 180 and 176. Short interest is low under 1%. The stock pays a dividend with an annual yield of 3.4% and will begin trading ex-dividend on April 12th.
The company is expected to report earnings next on April 25th. The April options chain shows open interest focused at the 175 strike on the put side and building from the 170 strike to a peak at 180 then tailing to 190 on the call side. The April 26 Expiry chain estimates a move of just under $10 by expiry. The May chain has a grouping of open interest from 170 to 165 then biggest at 140 on the put side. The call side shows a plateau from 165 to 190. The June chain has biggest open interest at the 165 and 150 put strikes and sees it build from 135 to a peak at 190 on the call side.
AbbVie, Ticker: $ABBV
Trade Idea 1: Buy the stock on a move over 182.50 with a stop at 175.
Trade Idea 2: Buy the stock on a move over 182.50 and add an April 26 Expiry 180/170 Put Spread ($3.55) while selling the June 190 Calls (3.45).
Trade Idea 3: Buy the April/May 185 Call Calendar ($2.80) and sell the April 26 Expiry 170 Put (85 cents).
Trade Idea 4: Buy the June 165/185/195 Call Spread Risk Reversal ($1.85).
If you like what you see sign up for more ideas and deeper analysis using this Get Premium link.
After reviewing over 1,000 charts, I have found some good setups for the week. These were selected and should be viewed in the context of the broad Market Macro picture reviewed Friday which with the First Quarter of the year in the books, saw equity markets exhibited strength.
Elsewhere look for Gold to continue its uptrend while Crude Oil builds on its move higher. The US Dollar Index continues to drift to the upside in consolidation while US Treasuries consolidate in their downtrend. The Shanghai Composite looks to reverse the short term uptrend while Emerging Markets consolidate in a broad range.
The Volatility Index looks to remain very low and stable making the path easier for equity markets to the upside. Their charts look strong, especially the SPY on both timeframes. The QQQ is showing some momentum divergence that could lead to more consolidation or a pullback while the IWM looks top step up as it breaks to 2 year highs. Use this information as you prepare for the coming week and trad’em well.
0 notes
Text
5 Trade Ideas for Monday: Ally, Bristol-Myers, Comerica, eBay and JB Hunt
5 Trade ideas excerpted from the detailed analysis and plan for premium subscribers:
Ally Financial, Ticker: $ALLY
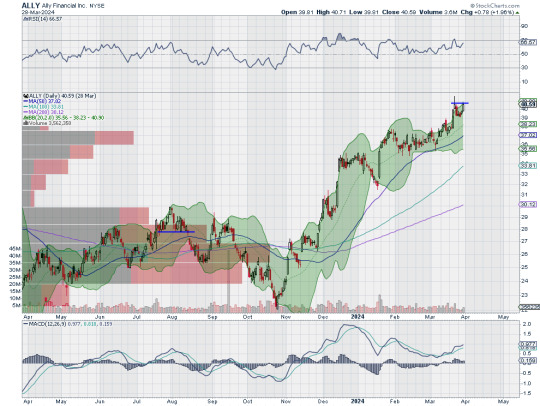
Ally Financial, $ALLY, comes into the week at resistance. The RSI is in the bullish zone with the MACD positive and rising. Look for a push over resistance to participate…..
Bristol-Myers Squibb, Ticker: $BMY

Bristol-Myers Squibb, $BMY, comes into the week at resistance. It has a RSI in the bullish zone with the MACD crossing up and positive. Look for a push over resistance to participate…..
Comerica, Ticker: $CMA
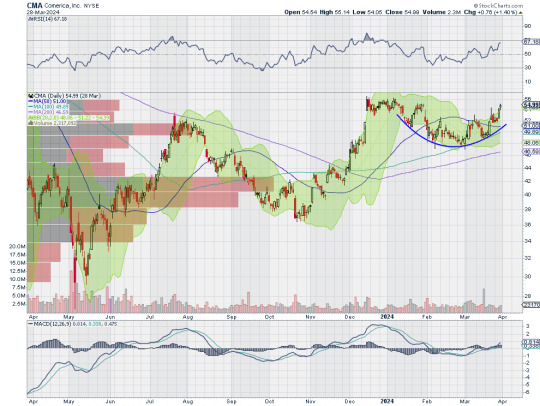
Comerica, $CMA, comes into the week moving higher. It has a RSI in the bullish zone with the MACD positive. Look for continuation to participate…..
eBay, Ticker: $EBAY
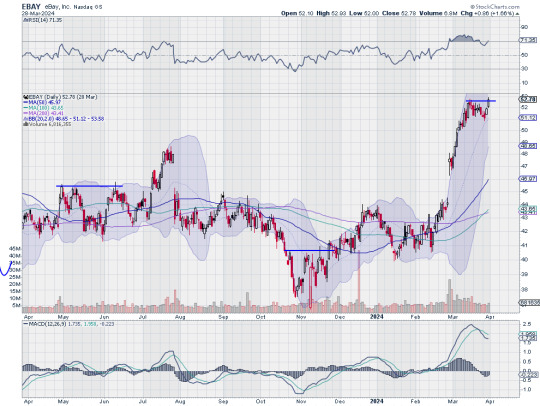
eBay, $EBAY, comes into the week breaking resistance. It has a RSI is the bullish zone with the MACD crossed down but positive. Look for continuation to participate…..
JB Hunt Transport Services, Ticker: $JBHT
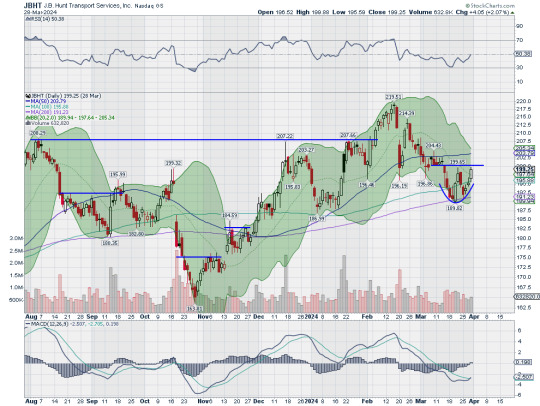
JB Hunt Transport Services, $JBHT, comes into the week approaching resistance. It has a RSI at the midline with the MACD negative and crossing up. Look for a push over resistance to participate…..
If you like what you see sign up for more ideas and deeper analysis using this Get Premium link.
After reviewing over 1,000 charts, I have found some good setups for the week. These were selected and should be viewed in the context of the broad Market Macro picture reviewed Friday which with the First Quarter of the year in the books, saw equity markets exhibited strength.
Elsewhere look for Gold to continue its uptrend while Crude Oil builds on its move higher. The US Dollar Index continues to drift to the upside in consolidation while US Treasuries consolidate in their downtrend. The Shanghai Composite looks to reverse the short term uptrend while Emerging Markets consolidate in a broad range.
The Volatility Index looks to remain very low and stable making the path easier for equity markets to the upside. Their charts look strong, especially the SPY on both timeframes. The QQQ is showing some momentum divergence that could lead to more consolidation or a pullback while the IWM looks top step up as it breaks to 2 year highs. Use this information as you prepare for the coming week and trad’em well.
0 notes
Text
What to expect from the stock market this week

Last week, the review of the macro market indicators saw with the March FOMC meeting in the books, equity markets showed strength moving higher despite the continued tone of rates staying higher for longer. Elsewhere looked for Gold ($GLD) to continue its consolidation in a bull flag at the highs while Crude Oil ($USO) continued the messy uptrend. The US Dollar Index ($DXY) looked to drift to the upside in consolidation while US Treasuries ($TLT) consolidated in their downtrend. The Shanghai Composite ($ASHR) looked to continue the short term uptrend while Emerging Markets ($EEM) consolidated in a broad range.
The Volatility Index ($VXX) looked to remain very low and stable making the path easier for equity markets to the upside. Their charts looked strong, especially on the longer timeframe with the $SPY at a weekly high and the $IWM and $QQQ consolidating the recent moves higher. On the shorter timeframe both the QQQ and SPY also looked strong making fresh all-time highs Thursday before dropping toward filling gaps Friday on profit taking. The IWM looked to have established a higher range.
The week played out with Gold breaking consolidation and moving to a new all-time high while Crude Oil also rounded up to a new 5 month high. The US Dollar drifted slightly higher while Treasuries moved higher in a tightening consolidation. The Shanghai Composite pulled back, ending the uptrend while Emerging Markets held in a tight range.
Volatility rose early in the week but fell back quickly and ended the week little changes at very low levels. This put initial pressure on equities and they fell to start the week. The damage was short lived and minimal though with the SPY and QQQ building short bull flags and the IWM slightly deeper. The SPY and IWM broke to the upside Thursday making new highs with the QQQ lagging and holding in consolidation. What does this mean for the coming week? Let’s look at some charts.
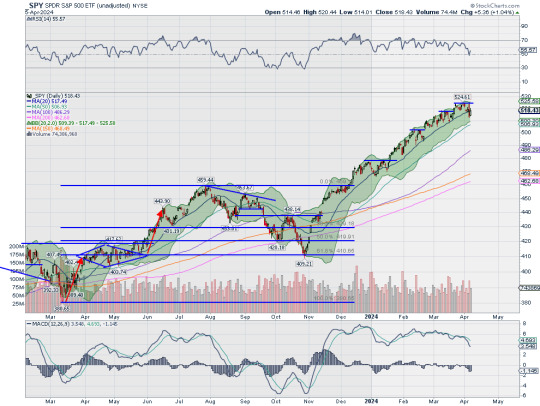
SPY Daily, $SPY
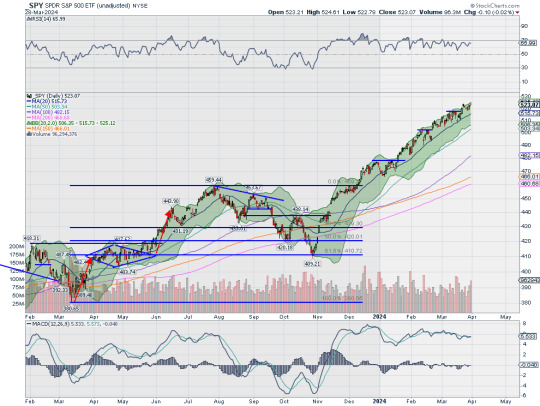
The SPY came into the week after seeing profit taking following a new all-time high on Thursday. It continued lower Monday and Tuesday but then reversed Wednesday to set a new all-time high. Thursday it gave back marginally and closed the week positive. The daily chart shows price has but broken below the 20 day SMA since January 17th in the rising Bollinger Bands®. The RSI is strong in the bullish zone with the MACD flat and positive.
The weekly chart shows a second week high after the brief 2 week consolidation. The Bollinger Bands on this timeframe also continue to point higher. The RSI is strong in overbought territory in the bullish zone with the MACD positive and rising. There is resistance higher at 524.50 and then the 138.2% extension of the retracement of the 2022 pullback at 530 and the target on the Cup and Handle at 560. Support lower sits at 520.50 and 517.50 then 513.50 and 510 before 503.50 and 501.50. Uptrend.
SPY Weekly, $SPY

With the First Quarter of the year in the books, equity markets have exhibited strength. Elsewhere look for Gold to continue its uptrend while Crude Oil builds on its move higher. The US Dollar Index continues to drift to the upside in consolidation while US Treasuries consolidate in their downtrend. The Shanghai Composite looks to reverse the short term uptrend while Emerging Markets consolidate in a broad range.
The Volatility Index looks to remain very low and stable making the path easier for equity markets to the upside. Their charts look strong, especially the SPY on both timeframes. The QQQ is showing some momentum divergence that could lead to more consolidation or a pullback while the IWM looks top step up as it breaks to 2 year highs. Use this information as you prepare for the coming week and trad’em well.
Join the Premium Users and you can view the Full Version with 20 detailed charts and analysis: Macro Week in Review/Preview March 29, 2024
5 notes
·
View notes
Text
4 Trade Ideas for Amgen: Bonus Idea

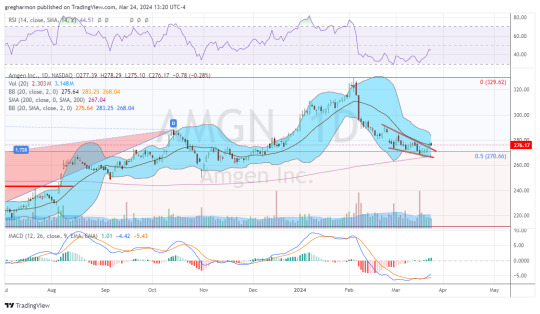
Amgen, $AMGN, comes into the week pushing back over its 20 day SMA and out of a mini falling wedge. This was after bottoming at the 50% retracement of the prior leg high and near the 200 day SMA. The RSI is rising up off a consolidation in the bearish zone with the MACD crossed up and moving higher. The Bollinger Bands® have squeezed in, often a precursor to a move. There is resistance at 278.50 and 283.50 then 290.25 and 301 before 306 and 311. Support lower sits at 274 and 268.50 then 261.50. Short interest is low at 2.1%. The stock pays a dividend with an annual yield of 3.26% and will not trade ex-dividend until May 16th.
The company is expected to report earnings next on April 25th. The April options chain shows biggest open interest at the 265 strike on the put side and rising activity from 270 to a peak at 300 on the call side. The May chain has biggest open interest at the 280 put and at the 285 and 310 call strikes. The June chain shows open interest spread from 300 to 200, biggest at 270 and 200 on the put side. The call side has it spread from 280 to 380, biggest at 300 and 350.
Amgen, Ticker: $AMGN
Trade Idea 1: Buy the stock on a move over 279 with a stop at 268.50.
Trade Idea 2: Buy the stock on a move over 279 and add an April 267.50 Put ($2.80) while also selling the May 305 Call ($2.27).
Trade Idea 3: Buy the April/May 300 Call Calendar ($2.55) while selling the April 265 Put ($2.14).
Trade Idea 4: Buy the June 250/290/310 Call Spread Risk Reversal ($1.05).
If you like what you see sign up for more ideas and deeper analysis using this Get Premium link.
After reviewing over 1,000 charts, I have found some good setups for the week. These were selected and should be viewed in the context of the broad Market Macro picture reviewed Friday which with the March FOMC meeting in the books, saw equity markets showed strength moving higher despite the continued tone of rates staying higher for longer.
Elsewhere look for Gold to continue its consolidation in a bull flag at the highs while Crude Oil continues the messy uptrend. The US Dollar Index looks to drift to the upside in consolidation while US Treasuries consolidate in their downtrend. The Shanghai Composite looks to continue the short term uptrend while Emerging Markets consolidate in a broad range.
The Volatility Index looks to remain very low and stable making the path easier for equity markets to the upside. Their charts look strong, especially on the longer timeframe with the SPY at a weekly high and the IWM and QQQ consolidating the recent moves higher. On the shorter timeframe both the QQQ and SPY also look strong making fresh all-time highs Thursday before dropping toward filling gaps Friday on profit taking. The IWM looks to have established a higher range. Use this information as you prepare for the coming week and trad’em well.
1 note
·
View note
Text
5 Trade Ideas for Monday: Allstate, Alphabet, Kraft Heinz, TJX and UPS
5 Trade ideas excerpted from the detailed analysis and plan for premium subscribers:
Allstate, Ticker: $ALL

Allstate, $ALL, comes into the week breaking resistance. It has a RSI in the bullish zone and a MACD positive. Look for continuation to participate…..
Alphabet, Ticker: $GOOGL

Alphabet, $GOOGL, comes into the week approaching the all-time high. It has a RSI in the bullish zone with the MACD positive. Look for continuation to participate…..
Kraft Heinz, Ticker: $KHC

Kraft Heinz, $KHC, comes into the week rising toward resistance. It has a RSI moving up from the midline with the MACD crossed up. Look for a break of resistance to participate…..
TJX, Ticker: $TJX

TJX, $TJX, comes into the week moving toward the all-time high. It has a RSI in the bullish zone with the MACD positive. Look for continuation to participate…..
United Parcel Service, Ticker: $UPS

United Parcel Service, $UPS, comes into the week pushing on resistance. It has a RSI in the bullish zone with the MACD positive. Look for a push over resistance to participate…..
If you like what you see sign up for more ideas and deeper analysis using this Get Premium link.
After reviewing over 1,000 charts, I have found some good setups for the week. These were selected and should be viewed in the context of the broad Market Macro picture reviewed Friday which with the March FOMC meeting in the books, saw equity markets showed strength moving higher despite the continued tone of rates staying higher for longer.
Elsewhere look for Gold to continue its consolidation in a bull flag at the highs while Crude Oil continues the messy uptrend. The US Dollar Index looks to drift to the upside in consolidation while US Treasuries consolidate in their downtrend. The Shanghai Composite looks to continue the short term uptrend while Emerging Markets consolidate in a broad range.
The Volatility Index looks to remain very low and stable making the path easier for equity markets to the upside. Their charts look strong, especially on the longer timeframe with the SPY at a weekly high and the IWM and QQQ consolidating the recent moves higher. On the shorter timeframe both the QQQ and SPY also look strong making fresh all-time highs Thursday before dropping toward filling gaps Friday on profit taking. The IWM looks to have established a higher range. Use this information as you prepare for the coming week and trad’em well.
1 note
·
View note
Text
What to expect from the stock market this week
Last week, the review of the macro market indicators saw with the March Quadruple Witching in the books and heading into the March FOMC meeting, equity markets showed some weakness after the long run higher. Elsewhere looked for Gold ($GLD) to continue its uptrend while Crude Oil ($USO) showed short term strength. The US Dollar Index ($DXY) continued in consolidation while US Treasuries ($TLT) consolidated in their downtrend. The Shanghai Composite ($ASHR) looked to continue the short term move higher while Emerging Markets ($EEM) consolidated.
The Volatility Index ($VXX) looked to remain very low and stable making the path easier for equity markets to the upside. The $SPY and $QQQ charts looked strong on the longer timeframe, perhaps building bull flags. On the shorter timeframe though both were showing some weakness as they reset momentum measures lower in the bullish range. The short term weakness in the $IWM was threatening to turn into a failed break out.
The week played out with Gold consolidating in a tightening range while Crude Oil met some resistance early in the week and pulled back. The US Dollar pushed up to recent resistance while Treasuries lifted higher in consolidation. The Shanghai Composite held in a narrow range around the 200 day SMA while Emerging Markets continued in consolidation in the rising channel.
Volatility continued to move lower, breaking its rising channel to a 1 month low. This took pressure off equities and they started moving higher Tuesday. By Wednesday the SPY had set anew all-time high, following that with another Thursday. The QQQ was one day beyond making a new high on Thursday and the IWM printing a new 23 month high as well. Friday all saw some profit taking. What does this mean for the coming week? Let’s look at some charts.
SPY Daily, $SPY
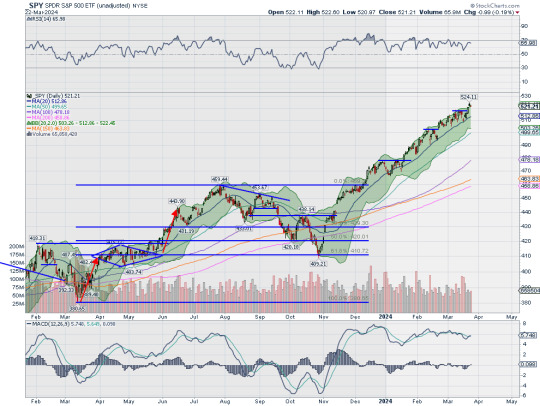
The SPY came into the week after pulling back to the 20 day SMA on Friday from a new all-time high 3 days earlier. It gapped up Monday and added to it Tuesday before a strong move Wednesday following the FOMC meeting saw it end at a new all-time high. Thursday printed another high with a gap up outside of the Bollinger Bands®. Friday then saw a tight range give back a small amount of the gains but move back within the Bollinger Bands. The RSI is strong in the bullish zone with the MACD crossing back up as the Bollinger Bands open higher again.
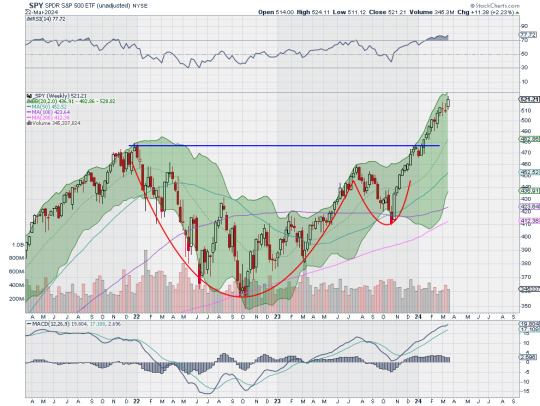
The weekly chart shows a strong move out of the short bull flag to the upside. The Bollinger Bands on this timeframe are pointing higher with the RSI strong, slightly overbought, but running flat and the MACD positive and rising. There is resistance at 524 and then the 138.2% extension of the retracement of the 2022 drop at 530 and the target on the Cup and Handle at 560. Support lower is at 520.50 and 517.50 then 513.50 and 510 before 503.50 and 501.50. Uptrend.
SPY Weekly, $SPY
With the March FOMC meeting in the books, equity markets showed strength moving higher despite the continued tone of rates staying higher for longer. Elsewhere look for Gold to continue its consolidation in a bull flag at the highs while Crude Oil continues the messy uptrend. The US Dollar Index looks to drift to the upside in consolidation while US Treasuries consolidate in their downtrend. The Shanghai Composite looks to continue the short term uptrend while Emerging Markets consolidate in a broad range.
The Volatility Index looks to remain very low and stable making the path easier for equity markets to the upside. Their charts look strong, especially on the longer timeframe with the SPY at a weekly high and the IWM and QQQ consolidating the recent moves higher. On the shorter timeframe both the QQQ and SPY also look strong making fresh all-time highs Thursday before dropping toward filling gaps Friday on profit taking. The IWM looks to have established a higher range. Use this information as you prepare for the coming week and trad’em well.
Join the Premium Users and you can view the Full Version with 20 detailed charts and analysis: Macro Week in Review/Preview March 22, 2024
4 notes
·
View notes
Text
4 Trade Ideas for Prudential Financial: Bonus Idea

Prudential Financial, $PRU, comes into the week at resistance. The Bollinger Bands® are open higher as price has been following them up. The RSI is in the bullish zone with the MACD positive and rising. Both have room below prior peaks. There is resistance at 113 then back to early 2022 at 115 and 120 before back to early 2018 at 126. There is support at 109.50 and 107. Short interest is low at 1.6%. The stock pays a dividend with an annual yield of 4.61% and has traded ex-dividend since February 16th.
The company is expected to report earnings next on April 30th. The April options chain shows open interest build from 100 to a peak at 97.50 on the put side and it is focused form 110 to 120, biggest at 115, on the call side. The May chain is just getting started. The June chain has big open interest at the 105 and 80 put strikes then at 115 and 100. On the call side it is spread from 80 to 120.
Prudential Financial, Ticker: $PRU
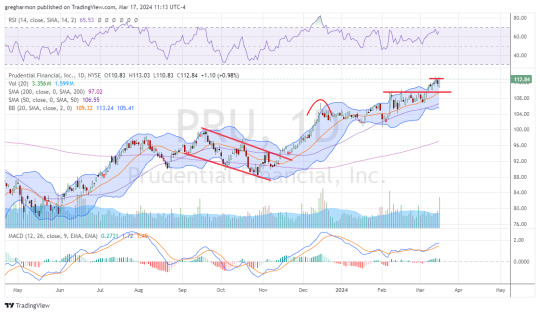
Trade Idea 1: Buy the stock on a move over 113 with a stop at 107.
Trade Idea 2: Buy the stock on a move over 113 and add an April 110/105 Put Spread (95 cents) while selling the May 125 Call (55 cents).
Trade Idea 3: Buy the April/May 120 Call Calendar ($1.15) while selling the May 105 Put ($1.10).
Trade Idea 4: Buy the June 105/120/130 Call Spread Risk Reversal (5 cent credit).
If you like what you see sign up for more ideas and deeper analysis using this Get Premium link.
After reviewing over 1,000 charts, I have found some good setups for the week. These were selected and should be viewed in the context of the broad Market Macro picture reviewed Friday which with the March Quadruple Witching in the books and heading into the March FOMC meeting, saw equity markets showing some weakness after the long run higher.
Elsewhere look for Gold to continue its uptrend while Crude Oil shows short term strength. The US Dollar Index continues in consolidation while US Treasuries consolidate in their downtrend. The Shanghai Composite looks to continue the short term move higher while Emerging Markets consolidate.
The Volatility Index looks to remain very low and stable making the path easier for equity markets to the upside. The SPY and QQQ charts look strong on the longer timeframe, perhaps building bull flags. On the shorter timeframe though both are showing some weakness as they reset momentum measures lower in the bullish range. The short term weakness in the IWM is threatening to turn into a failed break out. Use this information as you prepare for the coming week and trad’em well.
0 notes