#homeloss
Photo
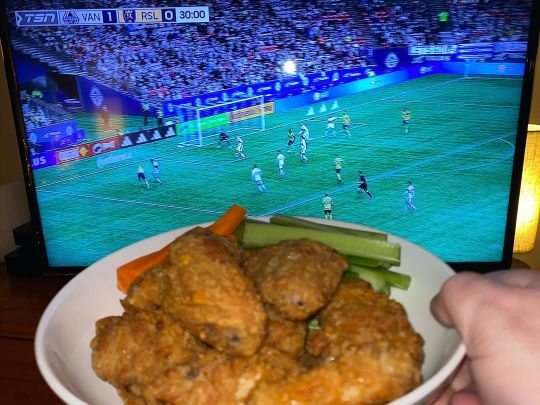
I remember watching the first half of the @whitecapsfc season opener at @bcplacestadium against Real Salt Lake and chowing on a whole plate of crispy Louisiana-style wings and dippin’ veggies, and thinking this year’s edition of the ‘Caps looked like a real contender. But then the second half happened. Thankfully, I at least had the wings. #whitecapsfc #vancouverwhitecapsfc #whitecaps #mls #seasonopener #wings #louisianastylewings #dippinveggies #homeloss #latergram https://www.instagram.com/p/CpHiNLfuSwr/?igshid=NGJjMDIxMWI=
#whitecapsfc#vancouverwhitecapsfc#whitecaps#mls#seasonopener#wings#louisianastylewings#dippinveggies#homeloss#latergram
0 notes
Photo
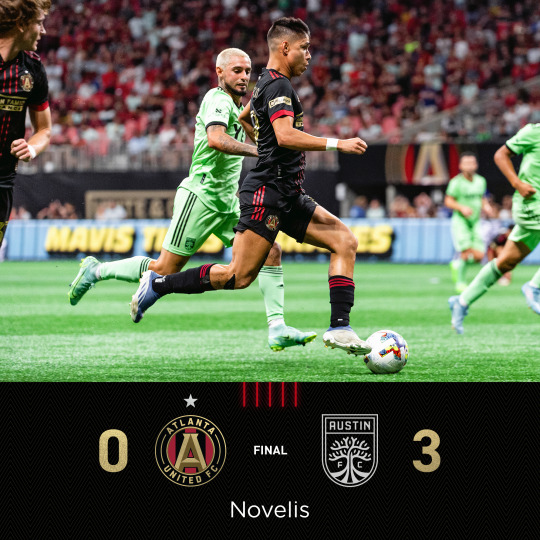
Atlanta United gets blank at home 0-3 vs. Austin FC
ATLANTA, GEORGIA—The dream of Atlanta United to have a gallant stand in front of its fans did not materialize as the team got demolished inside the Mercedes-Benz Stadium 0-3 by the visiting Austin FC on July 9. The home team was very focused on the game as all three designated players were in the starting lineup for head coach Gonzalo Pineda.
https://atlantasoccer.news/atlanta-united-gets-blank-at.../
#homedefeatforatlantaunited #anotherhomedefeatforatlantaunited #MLS #osccer #atlantaunited #mercedesbenzstadium #atlunitedgetsblakedathome #homelossforatlantaunited
0 notes
Photo

Five of Coins
https://www.deviantart.com/sylviaritter/art/Five-of-Coins-855244476
Here is my latest tarot card. :)
Created with Krita.
Copyright © 2020 Sylvia Ritter.
#art#digitalart#tarot#tarotreading#artists on tumblr#illustrators on tumblr#meerkat#animal#coins#fiveofcoins#nature#isolation#insecurity#poverty#friendships#homeloss#desert#loss#krita#sylviaritterart#artoftheday
152 notes
·
View notes
Photo
#bmo #sundaybball #lionsloss #nfcnorth #postgameselfies #nodefense. #jones&stafford #homeloss (at Corpus Christi Catholic Community Detroit Michigan) https://www.instagram.com/p/B33S6Q0j2XhjOqA3k6Kwee7i0IRnosX799rAAY0/?igshid=1mn8tj9lgqlhv
0 notes
Link
It's been a bit of a rough start for Massachusetts Sen. Elizabeth Warren's 2020 presidential campaign.
She knows what poverty caused by illness feels like!
Sherrie Miranda's historically based, coming of age, Adventure novel “Secrets & Lies in El Salvador” is about an American girl in war-torn El Salvador: http://tinyurl.com/klxbt4yHer husband made a video for her novel. He wrote the song too:https://www.youtube.com/watch?v=P11Ch5chkAc
0 notes
Text
Homeloss
This is a prescription for our hyperfaceted and hypochondritic object obsession.
When we appear as beings of an eroding history; landmarks always fading out.
Our punctuated losses compel us to fight the tide of impermanence and hold them.
Hold them so dearly it hurts us.
Cleave to elements of our formation.
These irretrievable meanings, stuffed beneath the object surface.
However, there’s another story of loss,
One that occurs beyond the point of this fear-establishment.
One that occurs after one has associated their own objects with a supposition of longevity. This cracking of the paradigm of having.
This story invests all its energy of having and loving and then has it broken.
Nearly past the point of learning moral lessons.
The result is a compulsion to never keep again.
To never find a home again...
2 notes
·
View notes
Photo

bobo is homeloss
3 notes
·
View notes
Text
NCAA Basketball Data
We have almost a full season of men's basketball and are well into tournament time. I wanted to play around a bit with the data and see if anything interesting was there. I used the statistics from college basketball reference http://www.sports-reference.com/cbb/seasons/2017-advanced-school-stats.html.
I wanted to look at what correlated highly with win percentage. To even be the least bit intellectually honest, you have to assume that you can hold any of these independent from each other (since I'm looking at these separately), when there's all kinds of correlation. For instance, true shooting percentage and assist rate are correlated because teams that make assists get assists because people are hitting shots. This is just exploratory playing around on an internet site, so I think we can violate few rules of reality in the name of a little fun. It's sports!
First, I looked at pace, which is a measure of possessions per 40 minutes.
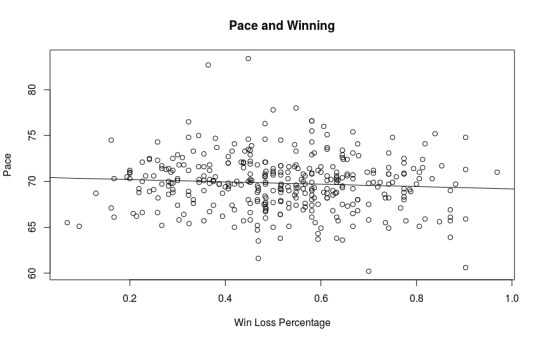
Oof. Rough start. A slight negative correlation and a fair amount of variance. Interestingly, some of the outliers that play slower are better. Anyway, not a lot here.
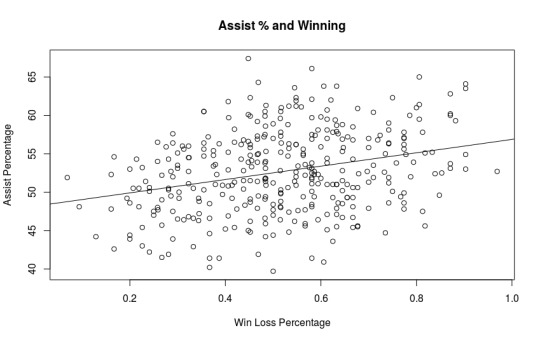
Assist Percentage is a measure of how many field goals made were assisted by a teammate. An assist is a pass that leads to a score (not I pass it to you and you dribble around for 15 seconds).
This one's a bit of a mess. There is a positive correlation but there's a ton of variance. This might be one to look at in a bit more detail.
3 point attempt rate measures the percentage of field goal attempts measures the percentage of shots that were 3 pointers. If you've watched the college game lately, there is an absolute plague of 3 point chuckers who are not that good but take a lot of threes since the line is so close.
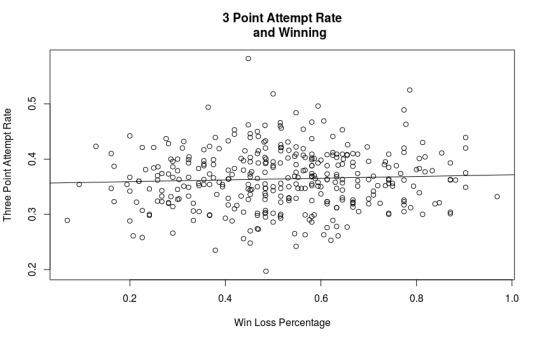
Yeah, that's about what I guessed. A decent amount of variance, but not a lot of relationship to winning. By the looks of this plot, this one might could use some transformation.
A better measure of whether you're actually a good 3 point shooter is true shooting percentage which measures your shooting percentage, but is then weighted for the value of your shots. That is, shooting 40 percent on threes is considered as 60 percent. Likely, if you have a high true shooting percentage you're not only taking a lot of threes, you're actually good at them.
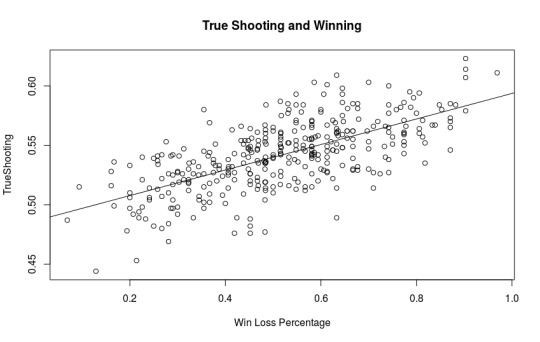
Ahh...there we go. You take shots and hit them, especially threes, it stands to reason that you're going to win a lot which is why the 3 pointer has also overtaken the NBA game.
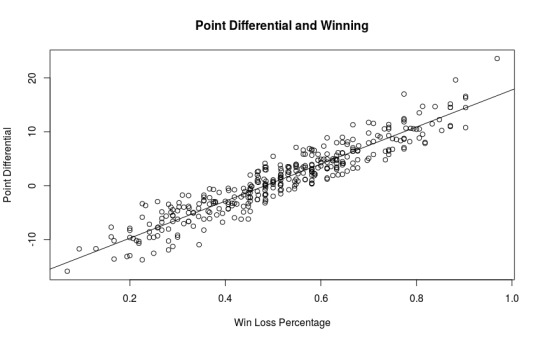
But there's one that always will be highly correlated.
I did this in R and I'm pasting my code below in case anyone wants to use this same data.
ncaa<-read.table(file="untitled.txt",sep=",", header=T, quote="")
ncaa<-ncaa[,-c(1,17)]
names(ncaa)<-c("school","G","W","L","WLPct","SRS","SOS", "ConfWins","ConfLoss","HomeWins","HomeLoss","AwayWins","AwayLoss",
"TeamPts","OppPts","Pace","ORtg","FTrate","ThreeAttRate", "TrueShoot","TotalRb","AssPct", "StlPct", "BlkPct",
"eFGPct", "TOPct","ORBPct","FTPerFGA")
#Pace
plot(ncaa$WLPct,ncaa$Pace, xlab="Win Loss Percentage", ylab="Pace", main="Pace and Winning")
abline (lm(ncaa$Pace~ncaa$WLPct))
#Assists
plot(ncaa$WLPct,ncaa$AssPct, xlab="Win Loss Percentage", ylab="Assist Percentage", main="Assist % and Winning")
abline (lm(ncaa$AssPct~ncaa$WLPct))
#Three Attempt Rate
plot(ncaa$WLPct,ncaa$ThreeAttRate, xlab="Win Loss Percentage", ylab="Three Point Attempt Rate", main="3 Point Attempt Rate
and Winning")
abline (lm(ncaa$ThreeAttRate~ncaa$WLPct))
#TrueShooting
plot(ncaa$WLPct,ncaa$TrueShoot, xlab="Win Loss Percentage", ylab="TrueShooting", main="True Shooting and Winning")
abline (lm(ncaa$TrueShoot~ncaa$WLPct))
#Point Differential
ncaa$PtDiff<-(ncaa$TeamPts-ncaa$OppPts)/ncaa$G
plot(ncaa$WLPct,ncaa$PtDiff, xlab="Win Loss Percentage", ylab="Point Differential", main="Point Differential and Winning")
abline (lm(ncaa$PtDiff~ncaa$WLPct))
0 notes
Text
Through out the time of pretty much being broke and homeless, I have realized who my good friends are and who just uses me. I have also realized that there are a lot of people with such big hearts. I have made so many friends. I am very greatful for all of them. Especially Janna. She not only has helped me in my time of need, but she has helped me even when she didn't have to. I put her through so much shit with my now ex-fiance and she has still stuck around, been there for me through thick and thin. I couldn't ask for any better friends than I have now. I appreciate each one of you and I couldn't be anymore thankful to have you guys. I love you guys!
1 note
·
View note
Last Seen Blogs

typicaltigers
Typicaltigers

clinicimedicaleromania
Articole Sponzorizate | Sanatate si Medicina

blabaksblog
Untitled

surfries
Usually Confused

smg34luverr
ZAYGEEEE