#Robert Wood Johnson Foundation
Text
By Thom Hartmann
Back in 1967, a friend of mine and I hitchhiked from East Lansing, Michigan to San Francisco to spend the summer in Haight-Ashbury. One ride dropped us off in Sparks, Nevada, and within minutes of putting our thumbs out a city police car stopped and arrested us for vagrancy.
The cop, a young guy with an oversized mustache who was apologetic for the city’s policy, drove us to the desert a mile or so beyond the edge of town, where we hitchhiked standing by a distressing light-post covered with graffiti reading “39 hours without a ride,” “going on our third day,” and “anybody got any water?”
Vagrancy laws were so 20th century.
Today, the US Supreme Court heard a case involving efforts by the City of Grants Pass, Oregon to keep homeless people off its streets and out of its parks and other public property. The city had tried a number of things when the problem began to explode in the last year of the Trump administration, as The Oregonian newspaper notes:
“They discussed putting them in their old jail, creating an unwanted list, posting signs at the city border or driving people out of town... Currently, officers patrol the city nearly every day, Johnson said, handing out [$295] citations to people who are camping or sleeping on public property or for having too many belongings with them.”
The explosion in housing costs has triggered two crises: homelessness and inflation. The former is harming the livability of our cities and towns, and the Fed’s reaction to the latter threatens an incumbency-destroying recession just as we head into what will almost certainly be the most important election in American history.
The problem with housing inflation is so severe today that without it the nation’s overall core CPI inflation rate would be in the neighborhood of Fed Chairman Jerome Powell’s 2% goal.

Graphic based on BLM data and interpretation by The Financial Times
Both homelessness and today’s inflation are the result of America — unlike many other countries — allowing housing to become a commodity that can be traded and speculated in by financial markets and overseas investors.
Forty-three years into America’s Reaganomics experiment, homelessness has gone from a problem to a crisis. Rarely, though, do you hear that Wall Street — a prime beneficiary of Reagan’s deregulation campaign — is helping cause it.
32% seems to be the magic threshold, according to research funded by the real estate listing company Zillow. When neighborhoods hit rent rates in excess of 32% of neighborhood income, homelessness explodes.
And we’re seeing it play out right in front of us in cities across America because a handful of Wall Street billionaires want to make a killing.
It wasn’t always this way in America.
Housing prices have spun out of control since my dad bought his house in 1957 when I was six years old. He got a Veteran’s Administration-subsidized loan and picked up the brand-new 3-bedroom-1-bath ranch house my 3 brothers and I grew up in, in suburban south Lansing, Michigan. It cost him $13,000, which was about twice what he made every year working a good union job in a tool-and-die shop.
When my dad bought his home in the 1950s the median price of a single-family house was 2.2 times the median American family income. Today, the Fed says, the median house sells for $479,500 while the median American personal income is $41,000 — a ratio of more than ten-to-one between housing costs and annual income.
As the Zillow study notes:
“Across the country, the rent burden already exceeds the 32% [of median income] threshold in 100 of the 386 markets included in this analysis….”
And wherever housing prices become more than three times annual income, homelessness stalks like the grim reaper.
We’re told that America’s cities have seen this increase in housing costs since the 1950s in some part because of the growing wealth and population of this country. There were, after all, 168 million people in the US the year my dad bought his house; today there are 330 million.
And it’s true that we haven’t been building enough new housing, particularly low-income housing, as 43 years of neoliberal Reaganomics have driven down wages and income for working-class people relative to all of their expenses while stopping the construction of virtually any new subsidized low-income housing.
But that’s not the only, or even the main dynamic, driving housing prices into the stratosphere — and, as a consequence, the crisis in homelessness — over the past decade. You can thank speculation for much of that.
As the Zillow-funded study noted:
“This research demonstrates that the homeless population climbs faster when rent affordability — the share of income people spend on rent — crosses certain thresholds. In many areas beyond those thresholds, even modest rent increases can push thousands more Americans into homelessness.”
So how did we get here?
It started with a wave of foreign buyers over the past 30 years (particularly from China, Canada, Mexico, India and Colombia) who, in just the one single year of 2020, picked up over 154,000 homes as their way of parking money in America. Which is part of why there are over 20 times more empty houses in America than there are homeless people.
As Marketwatch noted in a 2015 article titled “The Danger of Foreign Buyers Gobbling Up American Homes”:
“Unusual high appreciation of the aforementioned urban centers is due to the ever growing influx of foreign buyers — mostly wealthy Chinese — who view American residential real estate as the safest investment commodity. … According to a National Realtors Association survey, the Chinese spent $22 billion on U.S. housing in 12 months through March 2014…. [Other foreign buyers primarily include] Canadians, British, Indians and Mexicans.”
But foreign investment has been down for the past few years; what’s taken over and is really driving home prices today are massive, multi-billion-dollar US-based funds that sweep into neighborhoods and buy everything available, bidding against families and driving up housing prices.
As noted in a Wall Street Journal article titled “Meet Your New Landlord: Wall Street,” in just one suburb (Spring Hill) of Nashville, “In all of Spring Hill, four firms … own nearly 700 houses … [which] amounts to about 5% of all the houses in town.”
This is the tiniest tip of the iceberg.
“On the first Tuesday of each month,” notes the Journal article about a similar phenomenon in Atlanta, investors “toted duffels stuffed with millions of dollars in cashier’s checks made out in various denominations so they wouldn’t have to interrupt their buying spree with trips to the bank…”
The same thing is happening in cities and suburbs all across America; the investment goliaths use finely-tuned computer algorithms to sniff out houses they can turn into rental properties, making over-market and unbeatable cash bids often within minutes of a house hitting the market.
After stripping neighborhoods of homes families can buy, they then begin raising rents as high as the market will bear.
In the Nashville suburb of Spring Hill, for example, the vice-mayor, Bruce Hull, told the Journal you used to be able to rent “a three bedroom, two bath house for $1,000 a month.” Today, the Journal notes:
“The average rent for 148 single-family homes in Spring Hill owned by the big four [Wall Street investor] landlords was about $1,773 a month…”
Ryan Dezember, in his book Underwater: How Our American Dream of Homeownership Became a Nightmare, describes the story of a family trying to buy a home in Phoenix. Every time they entered a bid, they were outbid instantly, the price rising over and over, until finally the family’s father threw in the towel.
“Jacobs was bewildered,” writes Dezember. “Who was this aggressive bidder?”
Turns out it was Blackstone Group, now the world’s largest real estate investor. At the time they were buying $150 million worth of American houses every week, trying to spend over $10 billion. And that’s just a drop in the overall bucket.
In 2018, corporations bought 1 out of every 10 homes sold in America, according to Dezember, noting that, “Between 2006 and 2016, when the homeownership rate fell to its lowest level in fifty years, the number of renters grew by about a quarter.”
This all really took off around a decade ago, when Morgan Stanley published a 2011 report titled “The Rentership Society,” arguing that — in the wake of the 2008 Bush Housing Crash — snapping up houses and renting them back to people who otherwise would have wanted to buy them could be the newest and hottest investment opportunity for Wall Street’s billionaires and their funds.
Turns out, Morgan Stanley was right. Warren Buffett, KKR, and The Carlyle Group have all jumped into residential real estate, along with hundreds of smaller investment groups, and the National Home Rental Council has emerged as the industry’s premier lobbying group, working to block rent control legislation and other efforts to regulate the industry.
As John Husing, the owner of Economics and Politics Inc., told The Tennessean newspaper:
“What you have are neighborhoods that are essentially unregulated apartment houses. It could be disastrous for the city.”
Meanwhile, as unionization levels here remain among the lowest in the developed world, Reagan’s ongoing war on working people continues to wipe out America’s families.
At the same time that housing prices, both to purchase and to rent, are being driven through the roof by foreign and Wall Street investors, a survey published by NPR, the Robert Wood Johnson Foundation, and the Harvard TH Chan School of Public Health found that American families are in crisis.
Their study found:
— “Thirty-eight percent (38%) of [all] households across the nation report facing serious financial problems in the previous few months.
— “There is a sharp income divide in serious financial problems, as 59% of those with annual incomes below $50,000 report facing serious financial problems in the past few months, compared with 18% of households with annual incomes of $50,000 or more.
— “These serious financial problems are cited despite 67% of households reporting that in the past few months, they have received financial assistance from the government.
— “Another significant problem for many U.S. households is losing their savings during the COVID-19 outbreak. Nineteen percent (19%) of U.S. households report losing all of their savings during the COVID-19 outbreak and not currently having any savings to fall back on.
— “At the time the Centers for Disease Control and Prevention’s (CDC) eviction ban expired, 27% of renters nationally reported serious problems paying their rent in the past few months.”
These are not separate issues, and they are driving an explosion in homelessness.
The Zillow study found similarly damning data:
— “Communities where people spend more than 32% of their income on rent can expect a more rapid increase in homelessness.
— “Income growth has not kept pace with rents, leading to an affordability crunch with cascading effects that, for people on the bottom economic rung, increases the risk of homelessness.
— “The areas that are most vulnerable to rising rents, unaffordability, and poverty hold 15% of the U.S. population — and 47% of people experiencing homelessness.”
The Zillow study makes grim reading and is worth checking out. In community after community, when rent prices exceeded 32% of median household income, homelessness exploded. It’s measurable, predictable, and is destroying what’s left of the American working class, particularly minorities.
The loss of affordable homes also locks otherwise middle-class families out of the traditional way wealth is accumulated — through homeownership: Over 61% of all American middle-income family wealth is their home’s equity. And as families are priced out of ownership and forced to rent, they become more vulnerable to long-term economic struggles and homelessness.
Housing is one of the primary essentials of life. Nobody in America should be without it, and for society to work, housing costs must track incomes in a way that makes housing both available and affordable. This requires government intervention in the so-called “free market.”
— Last year, Canada banned most foreign buyers from buying residential property as a way of controlling their housing inflation.
— New Zealand similarly passed its no-foreigners law (except for Singaporeans and Australians) in 2018.
— Thailand requires a minimum investment of $1.2 million and the equivalent of a green card.
— Greece bans most non-EU citizens from buying real estate in most of the country.
— To buy residential housing in Denmark, it must be your primary residence and you must have lived in the country for at least 5 years.
— Vietnam, Austria, Hungary, and Cyprus also heavily restrict who can buy residential property, where, and under what terms.
This isn’t rocket science; the problem could be easily fixed by Congress if there was a genuine willingness to protect our real estate market from the vultures who’ve been circling it for years.
Unfortunately, when Clarence Thomas was the deciding vote to allow billionaires and hedge funds to legally bribe members of Congress in Citizens United, he and his four fellow Republicans opened the floodgates to “contributions” and “gifts” from foreign and Wall Street interests to pay off legislators to ignore the problem.
Because there’s no lobbying group for the interests of average homeowners or the homeless, it’s up to us to raise hell with our elected officials. The number for the Congressional switchboard is 202-224-3121.
If ever there was a time to solve this problem — and regulate corporate and foreign investment in American single-family housing — it’s now.
#us politics#op ed#thom hartmann#hartmann report#common dreams#homelessness#end homelessness#housing#housing market#2024#Reaganomics#zillow#foreign buyers#Marketwatch#the Oregonian#Wall Street Journal#Ryan Dezember#Underwater: How Our American Dream of Homeownership Became a Nightmare#The Rentership Society#Morgan Stanley#The Tennessean#NPR#Robert Wood Johnson Foundation#Harvard TH Chan School of Public Health#affordable housing
16 notes
·
View notes
Text
NEW BRUNSWICK, N.J. -- Nurses at Robert Wood Johnson University Hospital in New Brunswick were on strike for a fourth day Monday.
Staffing levels are a sticking point between the United Steelworkers Local 4-200 and the hospital.
After contract talks stalled, more than 1,700 nurses walked off the job Friday. But passion on the picket line is not waning.
"Clearly, we're all united for a common purpose here," said Jennifer Kwock.
Kwock, who works in the neonatal ICU, said depleted staffing levels create dangerous conditions for patients and cause nurses burnout.
"If we are spread, too many patients to take care of, how can they get the attention and the care that they deserve, that any patient deserves?" said Kwock.
Burnout is a factor in creating a nationwide shortage of nurses, which is hurling the industry into crisis mode.
A study released earlier in the year by the American Nurses Foundation found 57 percent of nurses surveyed said they felt "exhausted" and 43 percent felt "burned out."
#news#hot strike summer#new brunswick#nursing#nurses#nurses' strike#labor unions#labor union#workers rights
57 notes
·
View notes
Text
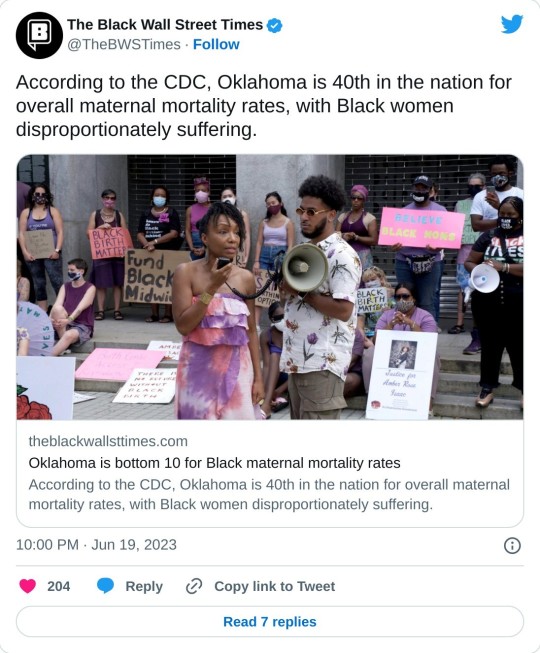
GREENWOOD Dist.–With data from the state’s own health department showing Black mothers are nearly twice as likely to die from childbirth as White mothers, a grassroots coalition is stepping up to fill in the gap in solutions.
A Tulsa-based coalition of Black reproductive health advocates, dubbed “The Persevere Cohort,” is hosting an event to update the community on their efforts over the last year and their plan for what comes next on Saturday, May 6 from 10:30 a.m. to 12 p.m. at OSU-Tulsa inside the B.S. Roberts room.
According to the Centers for Disease Control, despite Republican Gov. Stitt repeatedly voicing efforts to make Oklahoma a top 10 state, Oklahoma consistently ranks in the bottom 10 of U.S. states for some of the worst rates of pregnancy-related deaths. The Governor’s Office did not immediately respond to a request for comment.
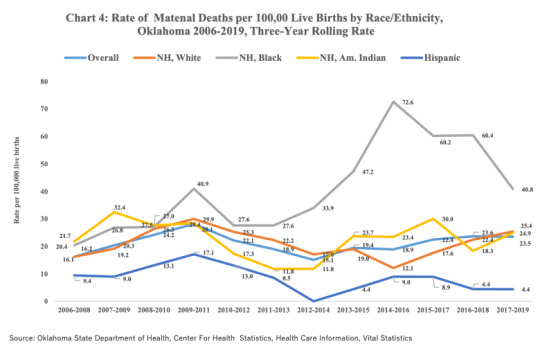
Oklahoma’s annual report, “Oklahoma Maternal Health, Morbidity and Mortality,” shows that Black women account for 40.8 maternal deaths per 100,000 live births, compared to 25.4 for White women, 24.9 for Native American women, and just 4.4 for Hispanic women. The overall maternal mortality rate for Oklahoma women was 23.5, according to the report. Rates for Native Hawaiian and Asian/Pacific Islander women were not available.
In recent years, local organizations such as Tulsa Birth Equity Initiative have also stepped up to address the crisis. The organization has trained 71 community duolas and supported 119 births since 2019.
Oklahoma maternal mortality in bottom 10 as abortion access banned
Advocates for reproductive choice have warned that banning access to abortion would disproportionately impact Black women. Even so, Oklahoma has become one of strictest anti-abortion states after Governor Kevin Stitt signed into law a bill that bans abortion at fertilization. According to the CDC, Oklahoma is 40th in the nation for overall maternal mortality rates.
National rates of maternal mortality are already three times higher for Black women and have been climbing each year, a fact The Persevere Cohort is determined to address at the local level.
On Saturday, the cohort will discuss the next phase of its plans to advance Black reproductive health through an initiative called “Reproduce U.”
“Beginning summer 2023 Reproduce U. will bring together community members, industry professionals, systems leaders and elected officials to have critical conversations about black reproductive health outcomes and to form research teams that will craft attainable policy solutions,” the cohort announced on Monday.
Reproduce U. will focus on Increasing Humanity in Healthcare and Creating Equity in the Economics of Healthcare over a 10-month span, the group announced.
The May 6th Initiative and The Persevere Cohort are supported by OSU-Tulsa Center For Public Life and Standpipe Hill Strategies in partnership with Hillcrest Medical Center, St.Francis Hospital Tulsa and Ascension St. John Medical Center through funding from The Robert Woods Johnson Foundation.
#Oklahoma is bottom 10 for Black maternal mortality rates#Black Maternal Mortality Rates#Birthing While Black#Black Mothers#Black Women#Black Womens Health#health disparities for minorities
10 notes
·
View notes
Text
Editor's Note: This blog post is part of the USC-Brookings Schaeffer Initiative for Health Policy, which is a partnership between Economic Studies at Brookings and the University of Southern California Schaeffer Center for Health Policy & Economics. The Initiative aims to inform the national health care debate with rigorous, evidence-based analysis leading to practical recommendations using the collaborative strengths of USC and Brookings. We gratefully acknowledge support from the Robert Wood Johnson Foundation and the National Institute on Drug Abuse.
There is strong evidence that the opioid epidemic has reduced labor force participation in the United States. While use of prescription opioids aimed at pain management for some individuals may enhance their ability to work, the widespread misuse of opioids has resulted in an epidemic of opioid use disorders (OUD), labor supply disruptions, and unprecedented deaths. Opioid misuse can compromise labor supply in a variety of ways, including absenteeism, increased workplace accidents, and withdrawal from the labor force due to disability, incarceration, or death.
Overview of the issue
The opioid epidemic has been widely characterized as having three distinct waves of overdose deaths: the first wave beginning in the 1990s with increases in deaths involving prescription opioids; the second wave beginning in 2010 with increases in deaths involving heroin; and the third wave beginning in 2013 with increases in deaths involving synthetic opioids such as fentanyl. Several researchers have investigated the effects of elevated prescription opioid misuse, which began during the first wave of the epidemic, on labor supply. Though one study found small positive effects of prescription opioids on labor force participation for women, the majority of studies on this relationship have found that regions with higher exposure to opioid prescriptions experienced significant declines in labor force participation. In a 2016 survey of men aged 25-54 who were not in the labor force, nearly half of respondents reported taking pain medications on a daily basis, two-thirds of whom were taking prescription pain medications. In a follow-up survey of women in the same age group who were not in the labor force, 54% of respondents reported taking pain medications daily, half of whom were taking prescription medications.
The rise in illicit opioid use during the second and third waves of the opioid epidemic also reduced labor force participation, decreased employment, and increased applications for Social Security Disability Insurance (SSDI) and Supplemental Security Income (SSI). Incarceration for offenses related to illicit opioids likely also contributes to the decrease in labor force participation caused by the opioid epidemic.
Altogether, the effects of the opioid epidemic on labor force participation have been significant. One estimate suggests the opioid epidemic accounts for 43% of the decline in men’s labor force participation rate between 1999 and 2015, and 25% of the decline for women.
Beyond its effects on labor force participation, the opioid epidemic also has implications for the working population. An estimated 12.6% of the U.S. workforce receives an opioid prescription each year, and 75% of employers surveyed by the National Safety Council report that they have been directly affected by opioids. OUD can impact workers’ labor market outcomes: workers with substance use disorders take nearly 50% more days of unscheduled leave than other workers, have an average turnover rate 44% higher than that for the workforce as a whole, and are more likely to experience occupational injuries that result in time away from work.
While the opioid epidemic has had significant impacts across the labor market, its effects have been particularly pronounced in specific occupations and industries. A CDC analysis of mortality data from 21 states concluded that unintentional and undetermined overdose deaths accounted for a disproportionate share of all deaths in the following six occupational groups: construction, extraction (e.g., mining), food preparation and serving, health care practitioners, health care support, and personal care and service. These fatalities are particularly concentrated in construction and extraction: an analysis by the Massachusetts Department of Public Health found that individuals employed in construction and extraction accounted for over 24% of all overdose deaths in the state’s working population.
4 notes
·
View notes
Text
Kenneth Capron Wants to Buy Old Cruise Ship and Turn It into Homeless Shelter
Kenneth Capron Wants to Buy Old Cruise Ship and Turn It into Homeless Shelter
https://theheartysoul.com/kenneth-capron-cruise-ship-homeless-shelter/
Kenneth A. Capron, a man from Portland, Maine, has been floating around quite a novel idea: converting cruise ships into floating homeless shelters. Capron, the founding director of the non-profit MemoryWorks, recently applied for a $250,000 grant through the Robert Wood Johnson Foundation in order to start researching the feasibility of this idea. To start, […]
The post Kenneth Capron Wants to Buy Old Cruise Ship and Turn It into Homeless Shelter appeared first on The Hearty Soul.
via The Hearty Soul https://theheartysoul.com/
December 25, 2023 at 09:46AM
0 notes
Text
It's the end of an era for a once-critical pandemic document: The ubiquitous white COVID-19 vaccination cards are being phased out.Now that COVID-19 vaccines are not being distributed by the federal government, the U.S. Centers for Disease Control and Prevention has stopped printing new cards.The federal government shipped more than 980 million cards between late 2020, when the first vaccines came out, through May 10, according to the latest available data from the CDC.Federal and local health officials don't expect the discontinuation of the cards to be a particularly big change, since the days of keeping them tucked in purses and wallets to ensure entry into festivals, bars and restaurants are largely over. If you’ve held on to your card, it’s still valid as proof of vaccination. Otherwise, people who need their COVID-19 immunization records will need to request them just like any other vaccine.In many cases, the clinic, pharmacy or health department that provided the shot can provide those records. Every state and some cities have an immunization registry, though rules vary on when records are included and options for obtaining copies of your records. Records from the mass vaccination sites held early in the pandemic also should be available in those registries, depending on state laws. There is no national registry for immunization records.For example, Texas requires patients' written consent to be included in the registry, San Antonio Metropolitan Health District spokesman David Andres Alegria said. Other places, including Wyoming and Philadelphia's city-specific record system, require vaccine providers to log all vaccinations.Many states offer digital vaccination records for individuals either online or through an app. Users can save a certificate or a QR code that proves they are vaccinated. And some websites will even track and alert patients when they're due for another one.“One of the positives (during the pandemic) was having increased autonomy on your patient record, especially the immunization record,” said Jeff Chorath, who manages the immunization information system in Washington state. Washington offers two digital options for obtaining vaccination records — a comprehensive list of all of a person's vaccinations noted in the state database and one specific to COVID-19 vaccines.Other states don't have the same options, so it might take longer to get your records. There could also be gaps in state databases; for example, if you were vaccinated by a federal health provider, those records may be tracked in a separate system.As for your old card — if you still have it — maybe don't mail it off to the Smithsonian quite yet. You should save it like any other health record, Wyoming Department of Health nurse consultant Heidi Gurov said.“It's always good to keep those in a safe spot," she said.Four million people in the U.S. have received the latest COVID-19 vaccine since it was approved last month, CDC director Dr. Mandy Cohen said Wednesday, and a total of 10 million doses have been shipped to providers.___The Associated Press Health and Science Department receives support from the Robert Wood Johnson Foundation. The AP is solely responsible for all content.
0 notes
Text

The Robert Wood Johnson Foundation Grants $325K to New Jersey Audubon | New Jersey Audubon https://capemayvibe.com/things-to-do-in-cape-may-nj/the-robert-wood-johnson-foundation-grants-325k-to-new-jersey-audubon-new-jersey-audubon/?utm_source=dlvr.it&utm_medium=tumblr
0 notes
Text
Summary report for an evaluation of the Robert Wood Johnson Foundation
0 notes
Text
Energy insecurity is an underappreciated social and environmental determinant of health
The average U.S. household allocates 3.1 percent of its income to energy expenses but for low-income households, this figure is upward of 8.1 percent, according to Hernandez. “This financial hardship often means that for low-income households there are fewer financial resources available for other basic needs such as housing, food, clothing, child care, medical expenses, digital access, and transportation.”
Disconnection of electric or gas service is considered the crisis point of energy insecurity and is disproportionately high among households below the poverty level and headed by persons of color. Nearly 15 percent of households received at least one disconnection notice during the prior twelve months, Earlier research by Hernandez was the first known prevalence study of shutoffs in the U.S.
Energy insecurity or the “inability to adequately meet basic household energy needs has profound implications for health and health equity,” says Dr. Hernandez, who is also managing director of the Energy Opportunity Lab’s Domestic Program at the Center for Global Energy Policy in Columbia’s School of International and Policy Affairs. “Energy insecurity encompasses much more than electricity, gas, or other power sources used for lighting, cooling, and heating. Instead, there are three primary dimensions of energy insecurity — the physical, economic, and coping which reflect financial hardship, housing quality issues and the adaptive strategies people use to manage unaffordable bills and subpar living conditions.”
Hernandez makes the following key points:
As of 2020 more than thirty million U.S. households were energy insecure. Low-income households and those composed of people of color are disproportionately affected by energy insecurity. Structural racism, poor housing conditions, inflation, climate change, and the clean energy transition contribute to and exacerbate energy insecurity. Energy insecurity adversely affects physical and mental health and can be fatal. Policy and programmatic solutions exist to reduce and eliminate energy insecurity.
Home renters, rural dwellers, residents of houses built before 1980 with inadequate insulation, and people living in the Northeast and Southern regions were at greatest risk of experiencing energy insecurity as well as mobile home occupants and households with children compared to those with an elderly resident, according to Dr. Hernandez. “The latter is, in part, because of shutoff protections for seniors.”
“The somewhat good news is that there is hope for addressing energy insecurity now with recent world events including the COVID-19 pandemic, global social unrest and the war in Ukraine which may spur further investments in renewable energy,” noted Hernandez.
The policy brief was supported by the Robert Wood Johnson Foundation (grants 78975 and 84643); Alfred P. Sloan Foundation, and National Institute of Environmental Health Sciences Center for Environmental Health and Justice in Northern Manhattan (grant P30 ES009089).
Addendum: This energy insecurity dashboard(link is external and opens in a new window) provides state-level estimates on energy insecurity using government-sponsored survey data (the Census’ Household Pulse Survey, which has been tracking energy insecurity regularly throughout the pandemic; and the Residential Energy Consumption Survey, which was administered in 2020 and is the basis of the estimates reported in the policy brief.)
0 notes
Text
Editor’s Note:This paper is part of the USC-Brookings Schaeffer Initiative for Health Policy, which is a partnership between the Economic Studies Program at Brookings and the USC Schaeffer Center for Health Policy & Economics. The Initiative aims to inform the national health care debate with rigorous, evidence-based analysis leading to practical recommendations using the collaborative strengths of USC and Brookings. This work was supported by a grant from the Robert Wood Johnson Foundation.
At present, 11 states have declined to expand Medicaid to all people with incomes below 138% of the federal poverty level (FPL), as permitted under the Affordable Care Act (ACA). In these states, adults with incomes below 100% of the FPL typically lack access to subsidized health insurance coverage.[1] Adults with incomes between 100 and 138% of the FPL are eligible for subsidized coverage through the ACA Marketplaces, but face higher cost-sharing and, prior to recent legislation, higher premiums than they would in Medicaid. These states’ decisions are estimated to have reduced coverage by 3.7 million people, while worsening financial security, access to health care, and health outcomes, including mortality.
In 2021 and 2022, Congress considered two ways of addressing these gaps in coverage but did not enact either. The first was for the Centers for Medicaid Services (CMS) to operate a “federal Medicaid program” in the non-expansion states that would, in effect, directly substitute for the missing state Medicaid expansion. The second, which was passed by the House of Representatives, was to extend eligibility for subsidized Marketplace coverage to people below the poverty line, while modifying how Marketplace coverage functions for people below 138% of the FPL to make it more “Medicaid-like.”
The analysis considers the relative merits of these two approaches, with the goal of helping policymakers choose between them if the Medicaid coverage gap returns to Congress’ agenda in the future. I compare the approaches along four dimensions that would be central to policymakers’ decisions: (1) number of people covered; (2) quality of coverage; (3) per enrollee fiscal cost; and (4) ease of implementation.
My overarching conclusion is that these two approaches are similar. Both would ensure that people with incomes below 138% of the FPL are eligible for zero- (or near-zero) premium coverage that covers a broad set of services with minimal cost-sharing; as such, either would largely or entirely fill the gaps left by state decisions not to expand Medicaid.[2] However, there are also differences worth considering along each of the four dimensions listed above. The nature of those differences would depend on the details of each legislative proposal and CMS’ implementation decisions, and it appears unlikely that either approach would outperform the other on all four dimensions. In brief:
Number of people covered: Without changes to the Marketplace enrollment process, enrolling in coverage would likely be harder under a Marketplace-based approach due to the need to select a plan and, in some cases, pay a premium. The House-passed Marketplace-based approach also lacked the “retroactive” coverage for care received before enrollment that would be available under a federal Medicaid program. These downsides of a Marketplace-based approach could, in principle, be mitigated with small changes to the House-passed bill and thoughtful implementation decisions.
On the other hand, relying on a federal Medicaid program would require enrollees to transition between coverage programs when their income crossed 138% of the FPL. This eligibility “seam” could cause coverage disruptions that would not occur under a Marketplace-based approach. These disruptions would likely be hard to fully avoid under a federal Medicaid program.
Quality of coverage: If a federal Medicaid program emulated state Medicaid programs, then it might offer somewhat narrower provider networks and more restrictive drug coverage than a Marketplace-based approach. However, CMS could also implement a federal Medicaid program in ways that would make it much more generous than a Marketplace-based approach along these dimensions, as well as opt to cover additional services that Marketplace plans do not typically cover. Another consideration is that a Marketplace-based approach would likely offer enrollees more plan options and, thus, allow some enrollees to select plans that better matched their needs; however, this would come at the cost of placing enrollees in a more complex choice environment that could lead other enrollees to choose plans that poorly matched their needs.
Per enrollee fiscal cost: A federal Medicaid program would pay health care providers and drug manufacturers lower prices than Marketplace plans, as it would have many tools to limit prices that Marketplace plans lack. A reasonable estimate (derived below) is that these price differences would reduce the per enrollee fiscal cost of a federal Medicaid program by one-quarter to one-third relative to a Marketplace-based approach, depending on how CMS implemented a federal Medicaid program. If they wished, legislators could “claw back” some of the higher prices paid to providers and manufacturers under a Marketplace-based approach, such as by reducing payments to hospitals intended to cover uncompensated care costs or extending Medicaid-like drug rebates to Marketplace enrollees who would be eligible for Medicaid under expansion.
Utilization could also differ between a federal Medicaid program and a Marketplace-based approach. However, the direction of those differences would likely depend on decisions CMS made about provider networks and utilization controls under a federal Medicaid program.
Ease of implementation: A Marketplace-based approach would be easier to implement than a federal Medicaid program because it could rely heavily on existing infrastructure, whereas a federal Medicaid program would need to create new systems to perform many core functions, such as regulating and contracting with managed care plans. As a result, a Marketplace-based approach could likely be at least partially implemented in a matter of months, whereas it might take years for a federal Medicaid program to begin offering coverage.
The discussion above implies that policymakers’ choices between the two approaches would depend on how much weight they assigned to each of these four dimensions, as well as the details of each legislative proposal and CMS’ implementation decisions. For example, a policymaker who prioritized maximizing the number of people covered might prefer a federal Medicaid program if CMS maintained current Marketplace enrollment process. But the same policymaker might prefer a Marketplace-based approach if the House bill was amended to add retroactive coverage and CMS improved the Marketplace enrollment process since a Marketplace-based approach could be implemented faster and would avoid an eligibility “seam” at 138% of the FPL. Similarly, a policymaker who prioritized maximizing the quality of the coverage enrollees received might prefer a Marketplace-based approach if CMS implemented a federal Medicaid program in ways that emulated state Medicaid programs, but hold the opposite view if CMS made implementation decisions that caused a federal Medicaid program to provide more generous coverage.
Closely related, this discussion shows that lawmakers, CMS, or both would have important choices to make if either approach returned to the forefront. Notably, legislative changes to the House-passed bill, including the addition of retroactive coverage or provisions to “claw back” revenue from providers or manufacturers, could improve its performance along some of the dimensions examined here. For its part, CMS would face consequential implementation decisions, particularly regarding the enrollment process under a Marketplace-based approach and coverage quality under a federal Medicaid program.
The remainder of this analysis presents an overview of the two approaches to addressing the coverage gap and then a detailed analysis of how they compare along the dimensions enumerated above.
5 notes
·
View notes
Text
"This Week" Listings: Sen. Mark Warner, Rep. Mike Turner, and Jennifer Homendy Sunday on "This Week" with Co-Anchor Martha Raddatz

Media Advisory for Sunday, March 12, 2023
SEN. MARK WARNER, REP. MIKE TURNER & JENNIFER HOMENDY SUNDAY ON “THIS WEEK” WITH CO-ANCHOR MARTHA RADDATZ
Sen. Mark Warner
Chair, Senate Intelligence Committee
(D) Virginia
Exclusive
Rep. Mike Turner
Chair, House Intelligence Committee
(R) Ohio
Exclusive
Jennifer Homendy
Chair, National Transportation Safety Board
_____________________________
THE POWERHOUSE ROUNDTABLE
Rick Klein
ABC News Political Director
Laura Barrón-López
PBS NewsHour White House Correspondent
Charles Lane
Washington Post Editorial Writer and Columnist
Molly Ball
TIME National Political Correspondent
Plus, we mark three years of the COVID-19 pandemic with Dr. Richard Besser, CEO & President of the Robert Wood Johnson Foundation.
###
0 notes
Photo

So here: the anthologies of short stories published by by the Robert Wood Johnson Foundation. The list of contributors are some prominent writers you may have known like Hannah Lilith Assadi, Yoon Ha Lee and Madeline Ashby. Add the foreword from Roxanne Gay. The idea for this anthology is to shine a light on various issues occurring and worsening, and show potential solutions. The main point is to create a utopian world where people can live safely. Interesting ha! Well, just like any other anthologies, this anthology has some good and okay stories. Yet they will mention and offer you stories about domestic violence, child abuse, animal abuse, physical violence and murder, islamophobia, xenophobia, racism, classism, poverty, self-harm, alcoholism, substance abuse, homophobia and possibly other issues that I have forgotten. If you’d prefer to avoid sensitive matter related to the topics I just listed, Take Us to a Better Place Stories may not be for you. So did the stories in the collection lean a little heavily on their theme? Of course they did. Were they still well written and enjoyable? Yes! Des✨ #bookishindonesia #bookaholic #bookstagram #bookstagramindonesia #bibliophile #bookreview #bookreviewer #booknerd #bookaddict #bookblogger #bookaesthetic #bookenthusiast #booksbooksbooks #descalibrary #descaslibrary #descareading2023 #fictionbook #literaturejunkie #nonfiction #igreads #igbook #instaread #instabooks #ReadTheWorld23 #riotgrams #BookstagramReels#RoxanneGay #Anthology #MadelineAshby #TakeUstoaBetterPlace (at Sota,PNG) https://www.instagram.com/p/CoVpy0aypWY/?igshid=NGJjMDIxMWI=
#bookishindonesia#bookaholic#bookstagram#bookstagramindonesia#bibliophile#bookreview#bookreviewer#booknerd#bookaddict#bookblogger#bookaesthetic#bookenthusiast#booksbooksbooks#descalibrary#descaslibrary#descareading2023#fictionbook#literaturejunkie#nonfiction#igreads#igbook#instaread#instabooks#readtheworld23#riotgrams#bookstagramreels#roxannegay#anthology#madelineashby#takeustoabetterplace
0 notes
Text
Congressional District Health Dashboard, Alexander the Great Manuscripts, Free COVID-19 Test Sites, More: Monday ResearchBuzz, January 30, 2023
NEW RESOURCES
Health IT Analytics: New Tool Provides Population Health Insights in US Congressional Districts. “Researchers from New York University (NYU) Grossman School of Medicine and the Robert Wood Johnson Foundation (RWJF) unveiled the Congressional District Health Dashboard (CDHD), an online data tool that provides health data for all 435 US congressional districts and the District of…
View On WordPress
0 notes
Text
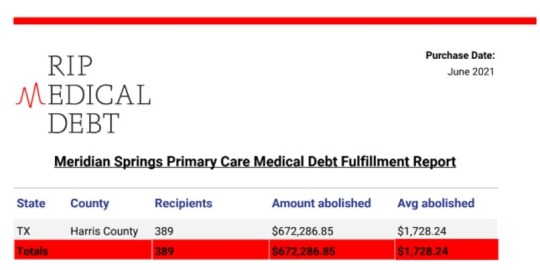
Meridian Springs Ends $672k Houstonian Medical Debt
Quick Facts & Tips:
1 in 6 Americans had medical debt in collection as of June 2020, reports Robert Wood Johnson Foundation
Consumer credit card debts and medical debts are quite different. While credit card debts are usually caused by irresponsible behaviors on the part of the consumer, Medical debt can happen to the most responsible individuals, usually with insurance, for no fault of theirs.
Medical bills are negotiable. Most medical bills have a lot of errors. It’s always a good practice to review and negotiate. Many times the bills could be reduced quite a bit after negotiations and payment plan
It is not always a good idea to put big medical bills on credit card. Better to be on a monthly payment plan than carry huge interest accruing balance on credit cards.
Houston, TX Medical Debt Tops $97.3M
The cost of health care can be high for patients and their families. For many, medical debt can become a huge burden. High deductibles, copays and other cost sharing, and uninsured patients all contribute to higher rates of medical debt.
According to a study done by the Robert Wood Johnson Foundation, medical debt is the leading cause of debt among U.S. individuals age 18 and over. In Houston, Texas, medical debt is a serious issue as well. The city has a higher than average prevalence of medical debt.
In fact, a 2015 study from the Houston Community Foundation found that the Houstonians carry over $97.3 million in medical debt. Of the total, the study found that about $40 million was related to unpaid medical bills.
Meridian Springs ends over $672k of Medical Debt in Houston
Medical debt crisis was about to get worse in 2020 with COVID disrupting businesses across Houston, just as it did around the world. As we contemplated on the best charitable giving option for us during December 2020, we felt the most effective one would be to abolish medical debt to the extent we could in the Houston area.
Medical Debt Best Pratices
It is important to note that medical debt does not always translate into non-payment. Some consumers are able to pay their medical bills but cannot afford, for example, a deductible. No matter the reason behind the medical debt, it is best to take action as soon as possible to lessen the chances of becoming overwhelmed with personal finance issues.
The first step when dealing with medical debt is determining your options. Some common solutions include:
Negotiation: Reach out and negotiate with your provider. Keep in mind that this strategy may not work if the amount of debt is small or if you owe a large amount of money to multiple providers.
Refinancing: Consider refinancing your debts through a credit union or bank, which could come with lower interest rates and can be easier than paying higher deductible rates at a provider
Conclusion
Medical debt is a big problem in the US, especially in Houston. Houston, TX is one of the most populous cities in the US and the most populous in Texas. When it comes to medical debt, Houston has some of the highest rates of unpaid bills in the country, with unpaid medical bills totaling $97.3 million. Houston has a population of 2.3 million people, with about 20% being uninsured.
As a result, there are lots of people who are struggling to pay their medical bills. Hospitals in Houston spend over $1 billion annually on bad debt, which is more than any other city in Texas. The best way to avoid these problems is by finding ways to pay for your medical bills before they become too large and end up on your credit report.
One way to do this is by setting up a payment plan with your healthcare provider before you undergo treatment. If you don’t have insurance, you can still find ways to get help. For example, there are some organizations that can help you with hospital and doctor bills if you have little or no income or have a disability or chronic condition.
0 notes
Text
Implementation of the IOM Future of Nursing Report
Implementation of the IOM Future of Nursing Report
In a formal paper of 1,000-1,250 words you will discuss the work of the Robert Wood Johnson Foundation Committee Initiative on the Future of Nursing and the Institute of Medicine research that led to the IOM report, “Future of Nursing: Leading Change, Advancing Health.” Identify the importance of the IOM “Future of Nursing” report related to nursing practice, nursing education and nursing…
View On WordPress
0 notes
Text
WTW launches models to highlight climate risks to employee health
WTW launches models to highlight climate risks to employee health
The models use data from the Robert Wood Johnson Foundation and the Centers for Disease Control to determine clinical prevalence (for example, cancer and diabetes) and the accessibility of non-clinical resources like food and transportation.
Scout Climate is powered by Climate Quantified, WTW’s analytical engine that measures climate-related risks. Scout Climate can focus on regions where…
View On WordPress
0 notes
Last Seen Blogs


flannel-unicorn
Some gay stuff.

loeweann
Lucky Bits of Notebook

m0d3rn-l0v3rs
Modern Love

ernestmovies
Ernest: The Lost Tapes