#Data Import Export Data
Text
In our interconnected world, the exchange of goods and services across borders is crucial for shaping the global economy. Malaysia, a key player in international trade, contributes significantly. Analyzing Malaysia's trade data, including the Importers List and Export Data, provides valuable insights into economic trends, market dynamics, and the global economy's overall health. Explore the article "The Impact of Malaysia Trade Data on the Global Economy" to gain more knowledge.
#export#import#import data#export data#trade data#market research#data driven#global market#global trade data#malaysia#Malaysia Trade Data#Malaysia Importers List#Malaysia Export Data#Data Import Export Data#international trade
2 notes
·
View notes
Text
[T]he Dutch Republic, like its successor the Kingdom of the Netherlands, [...] throughout the early modern period had an advanced maritime [trading, exports] and (financial) service [banking, insurance] sector. Moreover, Dutch involvement in Atlantic slavery stretched over two and a half centuries. [...] Carefully estimating the scope of all the activities involved in moving, processing and retailing the goods derived from the forced labour performed by the enslaved in the Atlantic world [...] [shows] more clearly in what ways the gains from slavery percolated through the Dutch economy. [...] [This web] connected them [...] to the enslaved in Suriname and other Dutch colonies, as well as in non-Dutch colonies such as Saint Domingue [Haiti], which was one of the main suppliers of slave-produced goods to the Dutch economy until the enslaved revolted in 1791 and brought an end to the trade. [...] A significant part of the eighteenth-century Dutch elite was actively engaged in financing, insuring, organising and enabling the slave system, and drew much wealth from it. [...] [A] staggering 19% (expressed in value) of the Dutch Republic's trade in 1770 consisted of Atlantic slave-produced goods such as sugar, coffee, or indigo [...].
---
One point that deserves considerable emphasis is that [this slave-based Dutch wealth] [...] did not just depend on the increasing output of the Dutch Atlantic slave colonies. By 1770, the Dutch imported over fl.8 million worth of sugar and coffee from French ports. [...] [T]hese [...] routes successfully linked the Dutch trade sector to the massive expansion of slavery in Saint Domingue [the French colony of Haiti], which continued until the early 1790s when the revolution of the enslaved on the French part of that island ended slavery.
Before that time, Dutch sugar mills processed tens of millions of pounds of sugar from the French Caribbean, which were then exported over the Rhine and through the Sound to the German and Eastern European ‘slavery hinterlands’.
---
Coffee and indigo flowed through the Dutch Republic via the same trans-imperial routes, while the Dutch also imported tobacco produced by slaves in the British colonies, [and] gold and tobacco produced [by slaves] in Brazil [...]. The value of all the different components of slave-based trade combined amounted to a sum of fl.57.3 million, more than 23% of all the Dutch trade in 1770. [...] However, trade statistics alone cannot answer the question about the weight of this sector within the economy. [...] 1770 was a peak year for the issuing of new plantation loans [...] [T]he main processing industry that was fully based on slave-produced goods was the Holland-based sugar industry [...]. It has been estimated that in 1770 Amsterdam alone housed 110 refineries, out of a total of 150 refineries in the province of Holland. These processed approximately 50 million pounds of raw sugar per year, employing over 4,000 workers. [...] [I]n the four decades from 1738 to 1779, the slave-based contribution to GDP alone grew by fl.20.5 million, thus contributing almost 40% of all growth generated in the economy of Holland in this period. [...]
---
These [slave-based Dutch commodity] chains ran from [the plantation itself, through maritime trade, through commodity processing sites like sugar refineries, through export of these goods] [...] and from there to European metropoles and hinterlands that in the eighteenth century became mass consumers of slave-produced goods such as sugar and coffee. These chains tied the Dutch economy to slave-based production in Suriname and other Dutch colonies, but also to the plantation complexes of other European powers, most crucially the French in Saint Domingue [Haiti], as the Dutch became major importers and processers of French coffee and sugar that they then redistributed to Northern and Central Europe. [...]
The explosive growth of production on slave plantations in the Dutch Guianas, combined with the international boom in coffee and sugar consumption, ensured that consistently high proportions (19% in 1770) of commodities entering and exiting Dutch harbors were produced on Atlantic slave plantations. [...] The Dutch economy profited from this Atlantic boom both as direct supplier of slave-produced goods [from slave plantations in the Dutch Guianas, from Dutch processing of sugar from slave plantations in French Haiti] and as intermediary [physically exporting sugar and coffee] between the Atlantic slave complexes of other European powers and the Northern and Central European hinterland.
---
Text above by: Pepijn Brandon and Ulbe Bosma. "Slavery and the Dutch economy, 1750-1800". Slavery & Abolition Volume 42, Issue 1. 2021. [Text within brackets added by me for clarity. Bold emphasis and some paragraph breaks/contractions added by me. Presented here for commentary, teaching, criticism purposes.]
#abolition#these authors lead by pointing out there is general lack of discussion on which metrics or data to use to demonstrate#extent of slaverys contribution to dutch metropolitan wealth when compared to extensive research#on how british slavery profits established infrastructure textiles banking and industrialisation at home domestically in england#so that rather than only considering direct blatant dutch slavery in guiana caribbean etc must also look at metropolitan business in europe#in this same issue another similar article looks at specifically dutch exporting of slave based coffee#and the previously unheralded importance of the dutch export businesses to establishing coffee mass consumption in europe#via shipment to germany#which ties the expansion of french haiti slavery to dutch businesses acting as intermediary by popularizing coffee in europe#which invokes the concept mentioned here as slavery hinterlands#and this just atlantic lets not forget dutch wealth from east india company and cinnamon and srilanka etc#and then in following decades the immense dutch wealth and power in java
24 notes
·
View notes
Text
youtube
2 notes
·
View notes
Text
Export Import Products List
Exporting and importing products is a major part of the global economy. In 2022, the value of global merchandise trade was over $28 trillion. This means that businesses and consumers all over the world are exchanging goods and services on a massive scale.

There are a wide variety of products that are exported and imported, but some of the most common include:
Agricultural products: This category includes food crops, such as wheat, rice, and corn, as well as livestock and animal products, such as meat, dairy, and eggs.
Chemicals: This category includes a wide range of products, such as petrochemicals, pharmaceuticals, and fertilizers.
Electrical machinery and equipment: This category includes products such as generators, motors, and computers.
Food and beverages: This category includes processed foods and drinks, as well as fresh produce.
Machinery and equipment: This category includes products such as machine tools, engines, and construction equipment.
Manufactured goods: This category includes a wide range of products, such as textiles, clothing, and electronics.
Minerals and fuels: This category includes products such as crude oil, natural gas, and coal.
Other goods: This category includes products that do not fall into any of the other categories, such as furniture and toys.
Textiles and clothing: This category includes products such as yarn, fabric, and garments.
Transport equipment: This category includes products such as cars, trucks, and airplanes.
The specific products that are exported and imported vary from country to country. For example, the United States is a major exporter of agricultural products, machinery, and equipment, while China is a major exporter of manufactured goods and electronics.
Factors to Consider When Choosing Export Import Products
There are a number of factors that businesses should consider when choosing which products to export or import. These factors include:
Demand: Is there a strong demand for the product in the target market?
Competition: How much competition is there for the product in the target market?
Profitability: Is the product profitable to export or import?
Regulations: Are there any regulations that restrict the export or import of the product?
Logistics: How will the product be transported to and from the target market?
Benefits of Exporting and Importing Products
There are a number of benefits to exporting and importing products. For businesses, exporting can help to increase sales and profits, and it can also help to diversify the business's customer base. Importing can help businesses to access products that are not available domestically, and it can also help businesses to reduce costs.
For consumers, exporting and importing can help to lower prices and increase the availability of goods. For example, consumers in the United States can buy fresh produce from all over the world, and they can also buy electronics and other manufactured goods at lower prices because of imports.
Conclusion
Exporting and importing products is a vital part of the global economy. It helps businesses to grow and consumers to save money. If you are considering starting an export import business, there are a number of resources available to help you get started.
#Export Import Products List#export import products#export import data#exporter#bussiness#export#import#importers
2 notes
·
View notes
Text
(white knuckling my desk while dijkstra's algorithm slinks up slowly behind me, waiting to strike) I Need To Take Pokemon Go Less Seriously
#thinking about a workflow of using ingress intel total conversion community edition (IITC-CE) and tampermonkey as well as PoGOHWH#exporting pokestop/gym data as a JSON file#importing that data back into openstreetmap and using the aformentioned dijkstra's algorithm#to find an optimal route between every pokestop/gym on my university campus#and THEN exporting all that as a shapefile and downloading it on my phone for an on-the-go reference#(all of which i am not going to do)
2 notes
·
View notes
Text
Truly astonishing to me that Google Calendar still doesn’t have a batch delete feature
#i lament this every day#but no more so than today#when i was like ''i wonder what this huge amount of timestamped data would look like in a calendar''#but accidentally imported one batch of it into my home calendar instead of the one i set up for the data#it's.......so many events#just going to have to export the calendar and delete everything in icalendar#and then start from scratch
1 note
·
View note
Text

Attention all businesses engaged in international trade with Chile! Get access to the most comprehensive Chile import export data available. Our database includes detailed information on the products being imported and exported, their quantities, and their origin and destination. With this data, you can make informed decisions on your import-export strategies, identify potential new markets, and stay ahead of your competition.
For more-
Contact: +16075244100
Mail: [email protected]
Website: https://www.eximpedia.app/global-trade-data/chile
2 notes
·
View notes
Text
Are you looking to expand your business into Paraguay? Look no further!
Our Paraguay import export data service provides detailed information on the market trends, top importing and exporting companies, and more. With our data, you will be able to make informed decisions and take advantage of new opportunities in the Paraguay market. Don't miss out - contact us today to learn more about our services and how we can help your business grow.
For More Information:-
Email- [email protected]
Website:- https://www.eximpedia.app/global-trade-data/paraguay
Call Us:- +16075244100
2 notes
·
View notes
Text
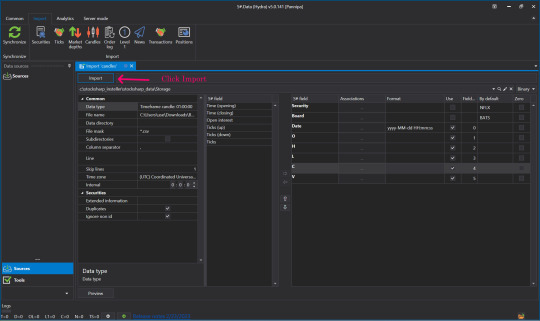
How to Import Candle Charts from TradingView websites?
youtube
💥S#.Data provides functionality that supports automatic downloading of historical market data from many data sources. But sometimes websites do not provide an API to make the process automatically. Fortunately, in addition to downloading you can import market data from CSV files directly.
💥TradingView is a charting platform and social network used by many traders and investors worldwide to spot opportunities across global markets. The major feature of the website - various historical dataset - that you can download as a csv file for further usage (e.g. - backtesting, analyzing).
💥For the TradingView website, you need a premium subscription to be able to export candles. Let’s look at this process step-by-step to understand how we can import this market data into S#.Data.
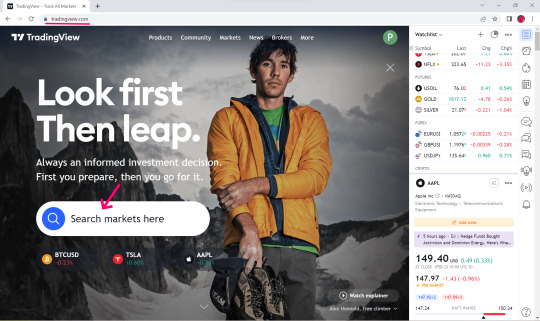
👉Visit TradingView Website.

👉Select Search Market for example NFLX.
👉Click Launch Chart for view.
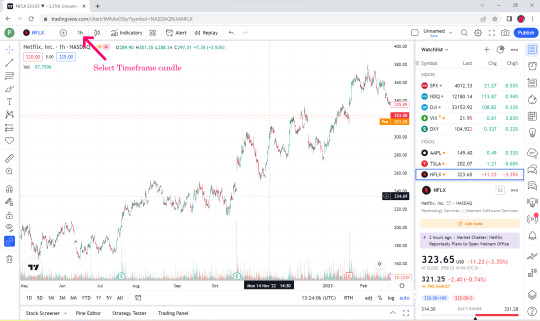

👉Select Time Flame Candle for example 1 hr.
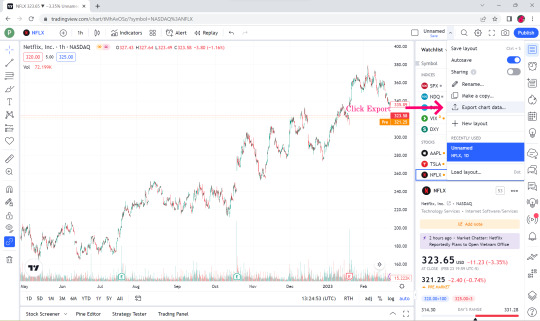
👉Select Export Chart Data.
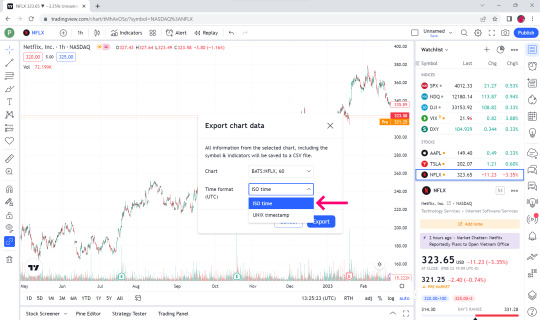
👉In the Time format box, select ISO time.

👉Click Export.

👉Open the downloaded Market data file. You can see that the top bar is date and time, open price, low price, close price, volume and volume MA.
👉S#.Data supports only the first 6 data, the last one volume MA we will not take.
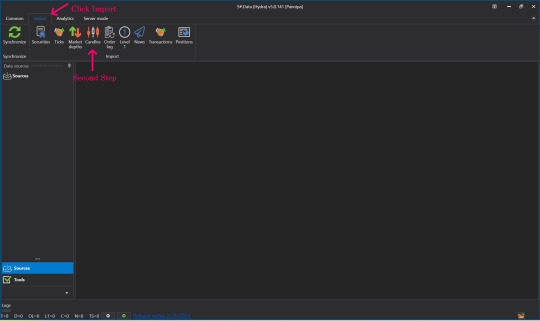
👉Open up your S#.Data Application.
👉Visit our instruction if you doesn't have S#.Data application.
👉How I can get S#.Data
👉Go to S#.Data application, click select import and Click candle.

👉Find the name of the file we just downloaded (btw, you can import by directories as well).
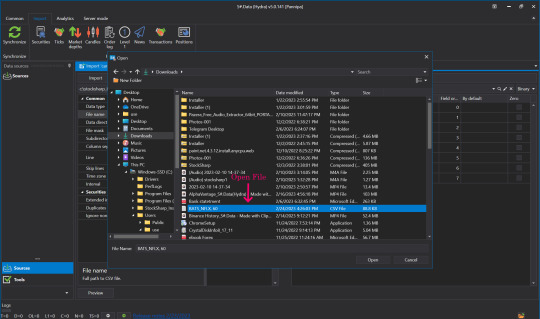
👉Click to select the file that we downloaded, click open.

👉Click to select the time frame to match the timeframe we selected in the file we downloaded initially in the data type field.

👉Setting S#.filed from the Security and Board fields.
👉By default put the Instruments Code that we downloaded. For example NFLX in the Security slot in the instrument board e.g. BATS by default.
👉Enter numbers 0-5 in the date box and so on. Remember - numeration started from 0, not from 1.

👉Skip lines Row 1 cause it contains data columns description.
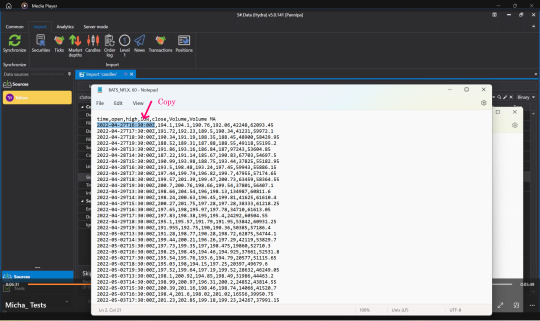
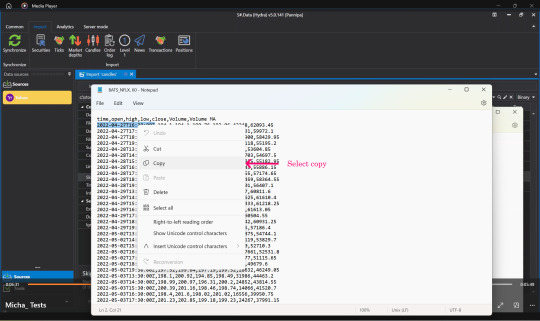
👉Open the file that we downloaded again, select Copy, time, date that we started downloading Market Data.
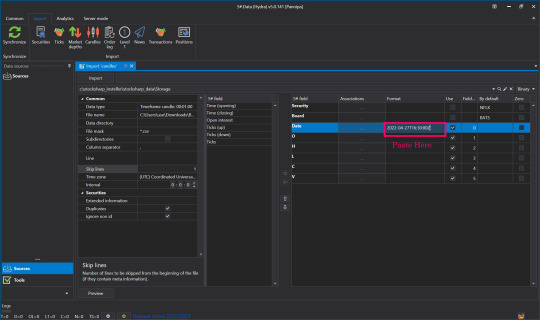
👉Press Paste in the Date Format field.
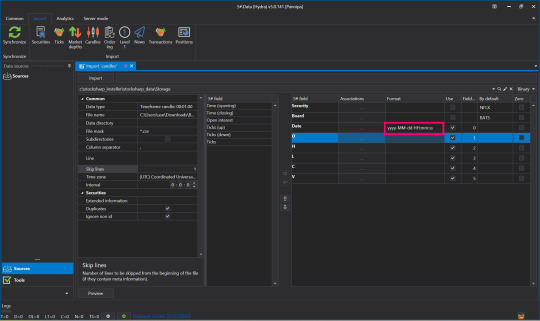
👉Change Numbers to Code Letters By yyyy-MM-dd HH:mm:ss You can read more about format on Microsoft website

👉Once everything is entered correctly, click Preview to double check before importing.
👉When the screen shows this page, there is no problem.
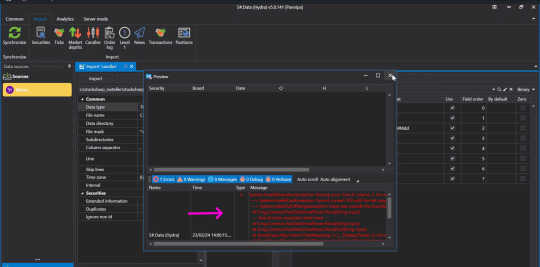
👉But if you press Preview and the screen appears like this, check the details that you have entered again to see if there is any mistake, correct it and press Preview again.
👉Once it's verified and there are no problems, press Import.
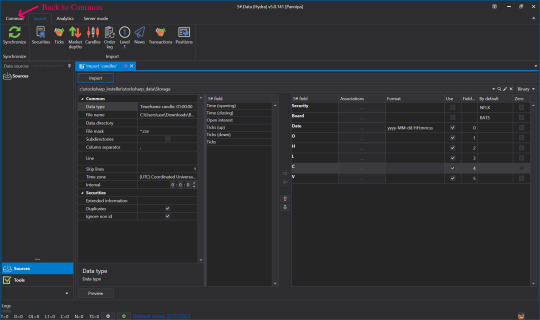
👉When done, click Back to go to Common.
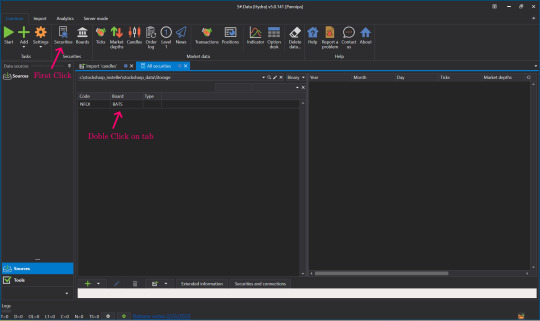
👉Click on our Security.
👉Click on Instrument Tab to view market Data.

👉Now let's see what data was imported. Click Candles.
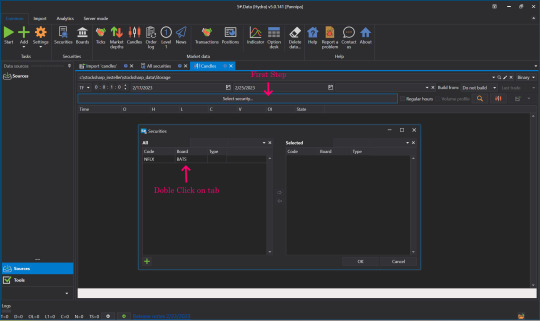
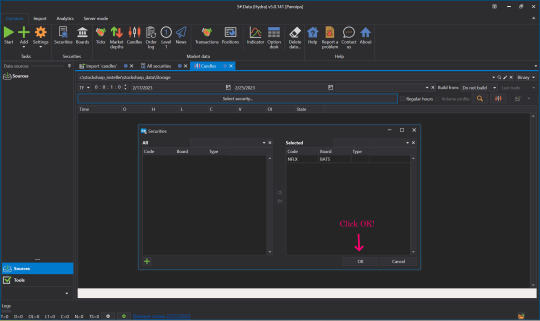
👉Select Security, select the Instrument to view by double-clicking the Instrument Tab, move it to the right side and click OK.

👉Select date and time frame.

👉Click View Market data.
👉Click View Candle Chart to see our candles as a chart.

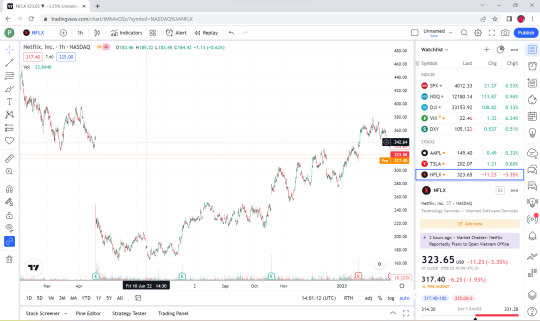
👉This is a Candle Chart comparison between the Chart that was in TradingView website before it was downloaded and the downloaded Chart rendered in S#.Data application.
💥💥Now you know how to import from a CSV file. To make this process you no need to use only limited websites like TradingView. S#.Data supports any format of CSV files that you can download from a variety of sources and websites.
💥Hope this blog is interesting for you. Please comment us what you interesting to know more about S#.Data. We will try to write our next posts.
Sources : StockSharp.com
#downloading of historical market data#import market data#charting platform#export candles#trading view#backtesting#Youtube
1 note
·
View note
Text
#hs code 7007#import shipment data of kenya#kenya hs code 7007 import data#hs code for export#hs code for import#kenya hs code#shipment#trade#custom#hs code search#exim#harmonized systems code#import
2 notes
·
View notes
Text

Scrape the Cosmetics, Beauty Supply & Personal Care Products Companies data of Hong Kong
Get lists of company names, contact information, website URLs, owner list, exporters, importers, manufacturers, suppliers, locations, country names, Products menu, Descriptions, categories, prices, ratings & reviews, and more data.
For more information, visit our official page https://www.linkedin.com/company/hir-infotech/ or contact us at [email protected]
#cosmetics#beautysupply#personalcare#datascraping#hirinfotech#exporter#importer#data#webscraping#dataanalysis#ecommercebusiness#hongkong#hongkongcosmetic
3 notes
·
View notes
Text
Unlock a world of trade possibilities with the colombia importers list. Tailor your business strategy with precision by connecting with key importers. Gain insights, foster strategic alliances, and propel your ventures to new heights in the vibrant Colombian market. Elevate your trade game today.
#export#import#import data#export data#trade data#global trade data#market research#trade market#colombia importers list#colombia import export data provider#colombia#Data Import Export Data
0 notes
Text
Commerce ministry presents host of Incentives.

The commerce ministry is informing a bunch of direct and oblique incentives akin to deferral of import duties and exemption from export taxes to revamp Special Economic Zones by brand new laws, an official mentioned. Let’s explore the notification in detail.
2 notes
·
View notes
Text
India's textile industry, renowned for its heritage and scale, is a vital contributor to the economy, generating employment and GDP growth. In 2022, exports reached $16 billion, projected to surpass $45 billion by 2031. Explore the sector's future through the latest export data and trends. Explore the Blog "Boost Your Bottom Line with Top Textile Exports from India".
Visit Blog: https://medium.com/@seair.exim/boost-your-bottom-line-with-top-textile-exports-from-india-c9e8ba1cc6c1
#export#import#trade data#import data#export data#international trade#global trade data#trade market#import export data#textile hs code#textile export data#textile exports from India#Indian textile exports statistics#textile export data of India#list of textile products exported from India#textile exporting countries#textile exporter in India#textiles
0 notes
Last Seen Blogs

twcposterholt
TWC Posterholt

kohanacosplay
Kohana Cosplay

why-do-i-hear-boss-mxsic
i cant lose weight :/

gallakev
Unbetitelt

rmgiy
mari