#backtesting
Text
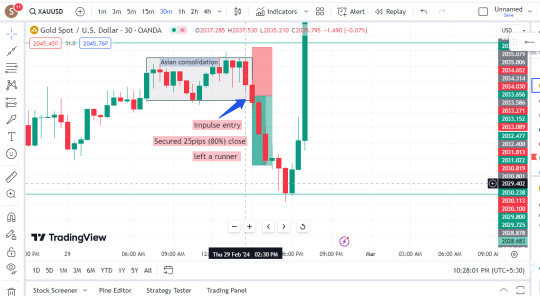
Gold! Remember to backtest and journal your trades. Simplify your charts for clearer opportunities. Keep it straightforward, folks! Clean charts enhance opportunity visibility.
2 notes
·
View notes
Text
How to Import Candle Charts from TradingView websites?
youtube
💥S#.Data provides functionality that supports automatic downloading of historical market data from many data sources. But sometimes websites do not provide an API to make the process automatically. Fortunately, in addition to downloading you can import market data from CSV files directly.
💥TradingView is a charting platform and social network used by many traders and investors worldwide to spot opportunities across global markets. The major feature of the website - various historical dataset - that you can download as a csv file for further usage (e.g. - backtesting, analyzing).
💥For the TradingView website, you need a premium subscription to be able to export candles. Let’s look at this process step-by-step to understand how we can import this market data into S#.Data.
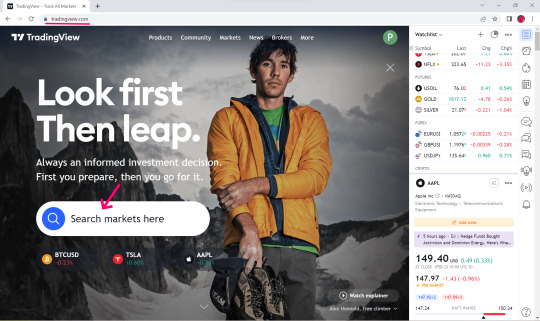
👉Visit TradingView Website.

👉Select Search Market for example NFLX.
👉Click Launch Chart for view.
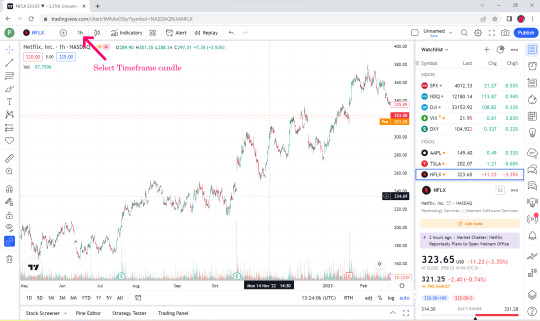

👉Select Time Flame Candle for example 1 hr.
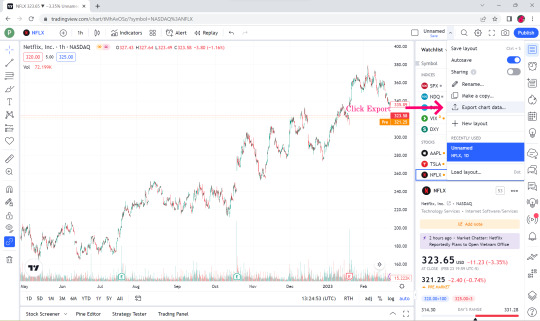
👉Select Export Chart Data.
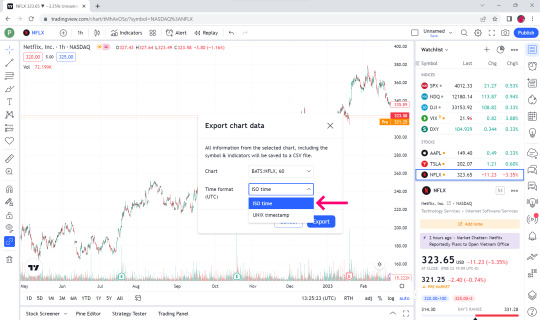
👉In the Time format box, select ISO time.

👉Click Export.

👉Open the downloaded Market data file. You can see that the top bar is date and time, open price, low price, close price, volume and volume MA.
👉S#.Data supports only the first 6 data, the last one volume MA we will not take.
👉Open up your S#.Data Application.
👉Visit our instruction if you doesn't have S#.Data application.
👉How I can get S#.Data
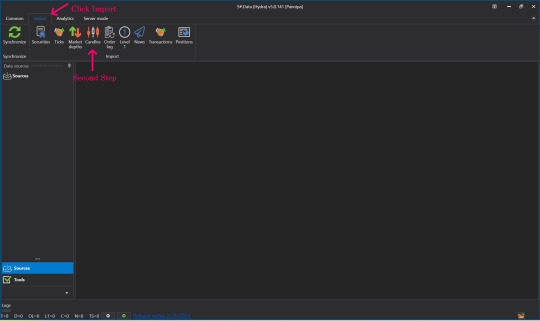
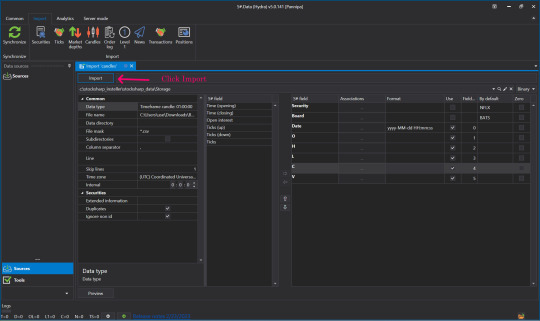
👉Go to S#.Data application, click select import and Click candle.

👉Find the name of the file we just downloaded (btw, you can import by directories as well).
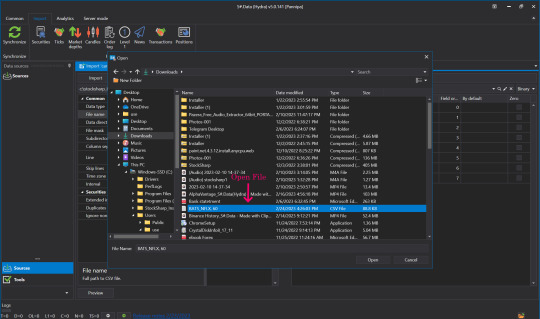
👉Click to select the file that we downloaded, click open.

👉Click to select the time frame to match the timeframe we selected in the file we downloaded initially in the data type field.

👉Setting S#.filed from the Security and Board fields.
👉By default put the Instruments Code that we downloaded. For example NFLX in the Security slot in the instrument board e.g. BATS by default.
👉Enter numbers 0-5 in the date box and so on. Remember - numeration started from 0, not from 1.

👉Skip lines Row 1 cause it contains data columns description.
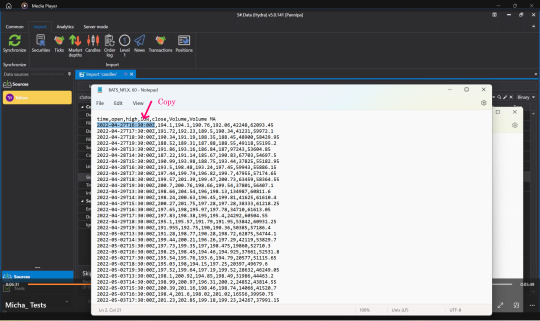
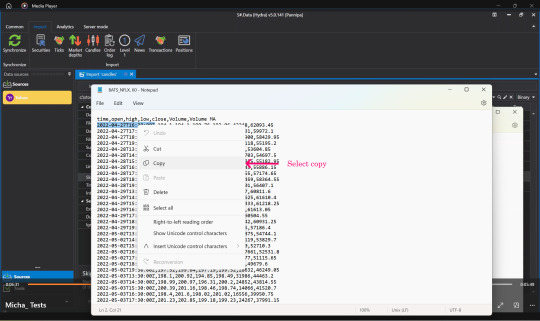
👉Open the file that we downloaded again, select Copy, time, date that we started downloading Market Data.
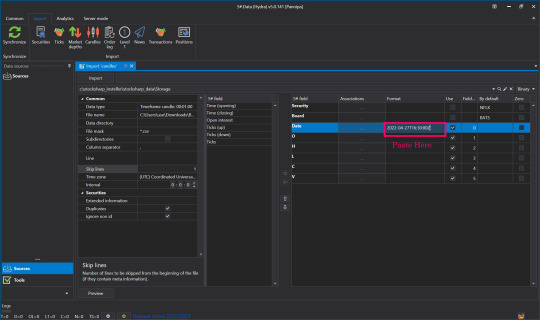
👉Press Paste in the Date Format field.
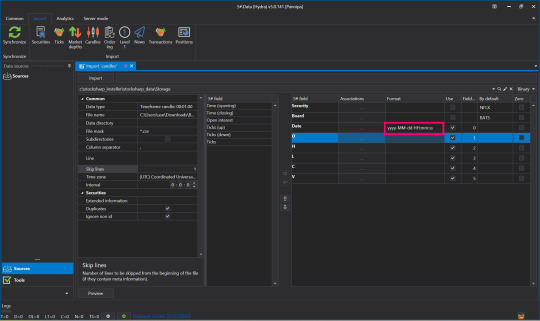
👉Change Numbers to Code Letters By yyyy-MM-dd HH:mm:ss You can read more about format on Microsoft website

👉Once everything is entered correctly, click Preview to double check before importing.
👉When the screen shows this page, there is no problem.
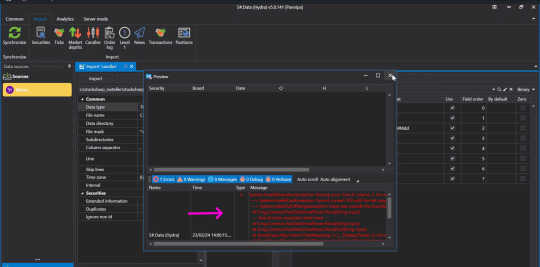
👉But if you press Preview and the screen appears like this, check the details that you have entered again to see if there is any mistake, correct it and press Preview again.
👉Once it's verified and there are no problems, press Import.
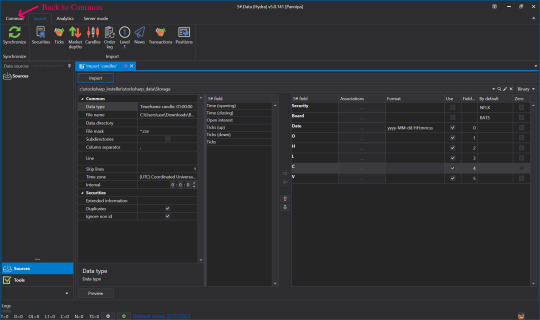
👉When done, click Back to go to Common.
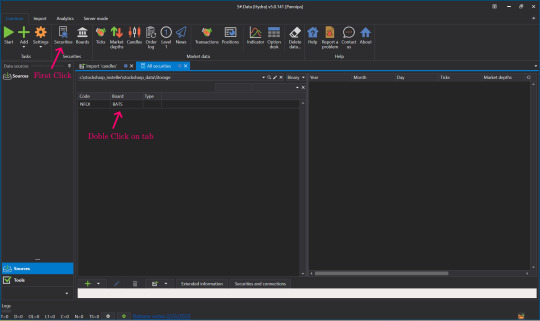
👉Click on our Security.
👉Click on Instrument Tab to view market Data.

👉Now let's see what data was imported. Click Candles.
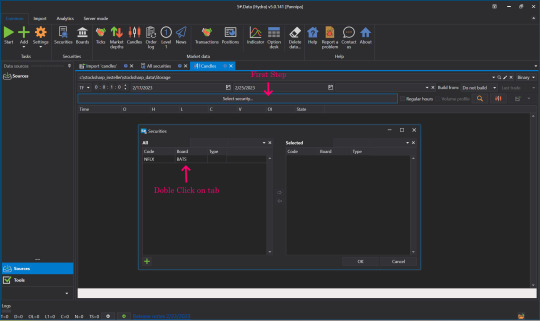
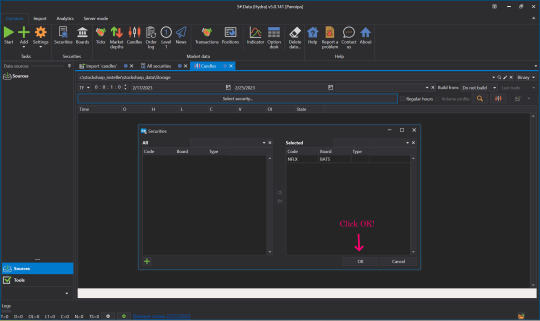
👉Select Security, select the Instrument to view by double-clicking the Instrument Tab, move it to the right side and click OK.

👉Select date and time frame.

👉Click View Market data.
👉Click View Candle Chart to see our candles as a chart.

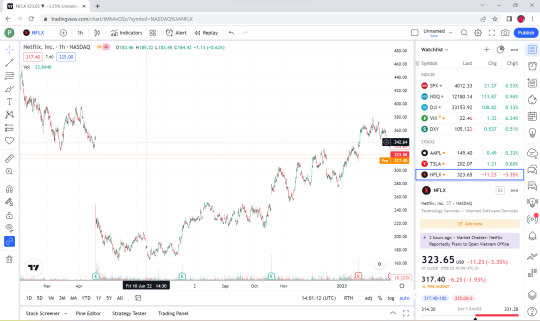
👉This is a Candle Chart comparison between the Chart that was in TradingView website before it was downloaded and the downloaded Chart rendered in S#.Data application.
💥💥Now you know how to import from a CSV file. To make this process you no need to use only limited websites like TradingView. S#.Data supports any format of CSV files that you can download from a variety of sources and websites.
💥Hope this blog is interesting for you. Please comment us what you interesting to know more about S#.Data. We will try to write our next posts.
Sources : StockSharp.com
#downloading of historical market data#import market data#charting platform#export candles#trading view#backtesting#Youtube
1 note
·
View note
Text
Mastering Technical Analysis: Strategies to Reduce Noise and False Signals
Introduction
Technical analysis is a powerful tool used by traders and investors to make informed decisions based on historical price movements and market data. However, amidst the vast sea of information, it’s easy to get lost in the noise and false signals that can lead to poor trading outcomes.
In this guide, we’ll delve into effective strategies to minimize noise and filter out false…

View On WordPress
#Backtesting#Backtesting for trading success#Effective trading strategies#False signal filters#False signals#Market Volatility#Market volatility management#Noise Reduction#Noise reduction strategies#Price Action Analysis#Price action confirmation#Risk Management#Risk mitigation in trading#technical analysis#Technical Analysis techniques#Trading Indicators#Trading indicators validation#Trading Psychology#Trading psychology for success#Trading Strategies
0 notes
Text
Backtesting Bitcoin Strategies on TradingView

The ever-evolving landscape of the cryptocurrency market presents both immense potential and inherent challenges. For Bitcoin (BTC) traders, crafting effective trading strategies requires a meticulous approach that goes beyond intuition. Backtesting emerges as a crucial tool in this process, allowing traders to assess the historical performance of their strategies using past market data. This article delves into how TradingView empowers you to backtest your Bitcoin trading strategies, enabling you to:
Evaluate Strategy Performance: Gain valuable insights into the potential profitability and risk associated with your trading ideas.
Refine and Optimize: Identify areas for improvement and optimize your strategy parameters based on historical results.
Boost Confidence: Approach live trading with a data-driven understanding of your strategy's effectiveness.
Understanding Backtesting
Backtesting simulates how your trading strategy would have performed in past market conditions. By applying your entry and exit rules to historical Bitcoin price data, you can analyze factors like:
Profitability: Assess the potential returns your strategy could have generated.
Drawdown: Evaluate the maximum peak-to-trough decline experienced during historical simulations.
Win Rate: Measure the percentage of successful trades your strategy would have executed.
Backtesting with TradingView
TradingView offers a user-friendly platform specifically designed for backtesting trading strategies. Here's a step-by-step guide:
Develop Your Strategy: Define your entry and exit rules based on technical indicators, price action patterns, or a combination of both.
Pine Script Integration: Code your strategy using TradingView's Pine Script, a powerful programming language specifically designed for developing trading strategies. Pine Script allows you to define entry/exit conditions, position sizing, and other essential elements of your strategy.
Historical Data Selection: Choose the desired timeframe for backtesting. TradingView provides access to extensive historical Bitcoin price data.
Optimization (Optional): Refine your strategy parameters (e.g., moving average periods, indicator settings) based on backtesting results to potentially improve performance.
TradingView Advantages
Visual Representation: TradingView offers a user-friendly interface that visually displays your backtested trades directly on the Bitcoin price chart. This allows you to easily identify successful and unsuccessful trades and understand the rationale behind each execution.
Strategy Optimization: TradingView provides built-in optimization tools that enable you to automatically test different combinations of strategy parameters and identify the settings that potentially yield the best historical performance.
Multiple Timeframes: Backtest your strategy across various timeframes (e.g., hourly, daily, weekly) to assess its effectiveness in different market conditions.
Beyond Backtesting: Additional Considerations
While backtesting offers valuable insights, it's crucial to acknowledge its limitations:
Historical Accuracy: Past performance is not a guarantee of future results. Market conditions can evolve significantly, and strategies that performed well historically may not replicate the same success in the future.
Overfitting: Optimizing your strategy solely based on backtesting results can lead to overfitting, where the strategy performs well on historical data but fails to adapt to new market dynamics.
FastBull Integration: A Multifaceted Approach
TradingView integrates with services like FastBull, providing additional layers of analysis to complement your backtested strategies.
FastBull offers:
Real-time News Sentiment Analysis: Gauge the overall market sentiment surrounding Bitcoin by analyzing the tone of news articles and social media discussions.
Identifying Potential Catalysts: Correlate news events and social media trends with historical price movements to understand how external factors may have influenced past market behavior.
By incorporating FastBull's insights alongside backtesting results on TradingView, you gain a more comprehensive understanding of the factors that potentially influence Bitcoin price movements. This can aid you in:
Identifying Potential Market Shifts: Anticipate how future news events or social media trends might impact the Bitcoin market.
Refine Risk Management: Adjust your risk management strategies based on the potential volatility associated with upcoming news or social media events.
Remember: Backtesting serves as a valuable tool for evaluating and refining your Bitcoin trading strategies. However, it should be combined with other forms of market analysis, including fundamental analysis and a deep understanding of the ever-evolving cryptocurrency landscape.
Disclaimer: This article is for informational purposes only and should not be considered financial advice. Please consult with a qualified financial advisor before making any investment decisions.
0 notes
Text
In financial markets, futures trading, be it algorithmic trading, on platforms like uTrade Algos, or manual, stands as a cornerstone of speculation and risk management. It is a complex yet vital component that drives global economies and provides opportunities for traders and investors alike. In this comprehensive guide, we will delve into the depths of futures trading, unravelling its intricacies, purposes, mechanics, and the role it plays in the financial world.
0 notes
Text
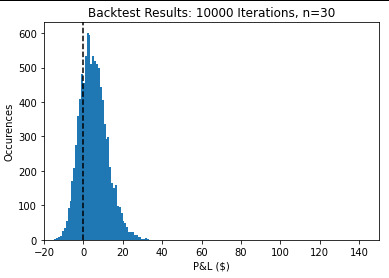
Building a statistically significant backtester
In discussions and study with popular trend following blogs, books, and videos I've always wondered why I struggled with profitability in my trades. This was really driving me crazy until I built by-hand my own even-driven backtester to help me prove to myself that this was not worth my time.
The backtester enters and exists trades based on a set of conditions on all the stocks within the S&P500. Using this approach, its roughly 2000 trades within a year!
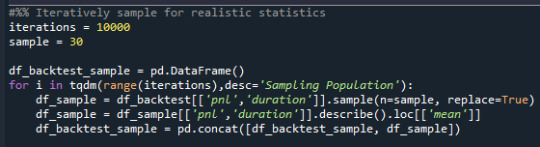
For a more realistic simulation of what a swing trader would do, I've also included a snippet of code to randomly sample 30 trades from that population, 10000 times. Not only would give me a sense of the "true" average expectancy/profitability values, this helps build statistics to build a nice confidence interval to establish statistical significance.
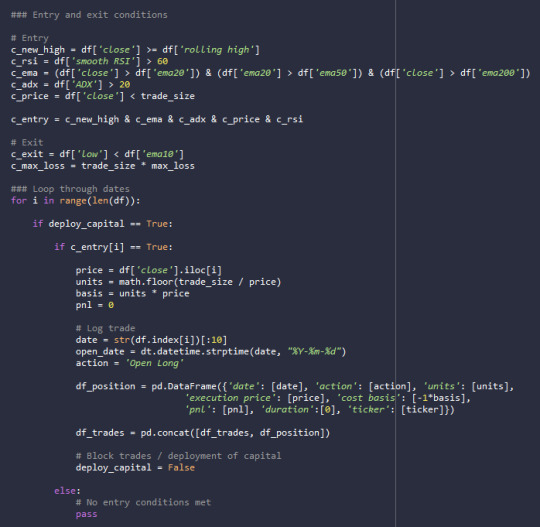
My losing strategy is defined below:
January 21, 2023 - 2024
New highs after 20 days
Price > 20 EMA, 20 EMA > 50 EMA, and Price > 200 EMA
Relative Strength Index (RSI) > 60
Average Directional Index > 20
Based on the results, the average profit over the year is $5 based on $1000 capital at risk! Not only that, but the result is not statistically significant from Zero, so there is a high enough chance my yearly P&L would be negative.
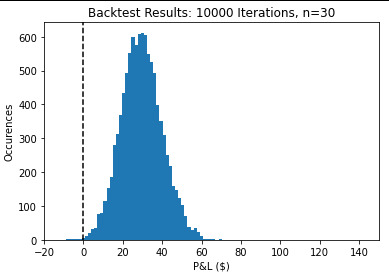
The crazy thing is that if I made a simple tweak, my mean P&L would be $30 and statistically significant to be profitable. However, $30 over the course of the year is likely less than the commissions paid!
Price < EMA200
All other conditions the same
0 notes
Text
Learn Why Backtesting Adjusted RSI Settings Is Essential

This article dives deep into the world of Forex trading, exploring the concept of backtesting RSI settings.
0 notes
Text

#nifty50#nifty#banknifty#Backtesting#free backtesting#option backtesting#free option backtestng#nifty backtesting#nifty option backtesting#free nifty backtesting#optiontrading#option trading tips
0 notes
Text
Binary Option Ultimate Backtester-V.1
The Binary Option strategy backtester gives the user extensive power to test any kind of strategy with advance trade management rules.
The strategy tester accepts external scripts as strategy sources. You can add your strategy and test it for historical stats.
Few assumption regarding strategy tester:
We are opening position at next candle after signal come
We are taking the position at opening price
Our call will be profitable if we get a green candle and put will be profitable if we get a red candle
We can open only one trade at a time. So if we are in trade, subsequent signals will be ignored.
How to make your strategy code compatible for strategy backtesting?
In your strategy code file add following lines:
Signal = is_call ? 1 : is_put ? -1 : 0
plot(Signal, title="🔌Connector🔌", display = display.none)
Is_call and is_put is your buy and sell signal. Plot the signal without displaying it in the chart. The new TradingView feature display = display.none, will not display the plot.
All Input options
Group: STRATEGY
Add Your Binary Strategy: External strategy to back test.
Trade Call/Put: Select CALL, to trade Call, PUT, to trade Put. Default is BOTH, Trading Call and Put both.
Number of Candles to Hold: How many candles to hold per trade. Default 1. If you want to hold the option for 30 minutes and you are testing your strategy in 15m intervals, use 2 candle holding periods.
GROUP: MARTINGALE
Martingale Level: Select up to 15 Martingale. Select 1 for no Martingale.
Use Martingale At Strategy Level: Instead of using Martingale per trade basis, using Martingale per signal basis. Like if we make a loss in the first signal, instead of starting martingale immediately we’ll wait for the next signal to put the martingale amount. For example if you start with $1 and you lose, at the next signal you will invest $2 to recover your losses.
Strategy Martingale Level: Select up to 15 Martingale at strategy signal level. Only workable if Use Martingale At Strategy Level is selected.
Type of Trade: Martingale trade type. Only workable if we are using Martingale Level more than 1.
It can be:
“SAME”:If you are trading CALL and incur a loss, you are taking CALL in subsequent Martingale levels.
“OPSITE”: if you are trading CALL and incur a loss, you are taking PUT in subsequent Martingale levels.
“FOLLOW CANDLE COLOR”: You are following candle color in Martingale levels, i.e if the loss candle is RED, you are taking PUT in subsequent candles.
“OPPOSITE CANDLE COLOR”: You are taking opposite candle color trade, i.e if the loss candle is RED, you are taking CALL in subsequent candle.
GROUP: TRADE MANAGEMENT
Initial Investment Per Option: Initial investment amount per trade
Payout: Per trade payout in percentage
Use Specific Session: Select to test trade on specific session.
Trading Session: Select trading session. Only workable if Use Specific Session is selected.
Use Date Range: Select to use test trades between dates.
Start Time: Select Start Time. Only workable if Use Date Range is selected.
End Time: Select end Time. Only workable if Use Date Range is selected.
Early Quit: Select to quit trade for the day after consecutive win or loss
Quit Trading after Consecutive Win: Number of consecutive wins. Only workable if early Early Quit is selected.
Quit Trading after Consecutive Loss: Number of consecutive losses. Only workable if early Early Quit is selected.
Buy/Sell Flip: Use buy signal for sell and sell signal for buy.
GROUP:STATS
Show Recent Stats: Show win trades in last 3,5,10,15,25 and 30 trades.
Show Daily Stats: Day wise win trades and total trades.
Show Monthly Stats: Month wise win trades and total trades.
Result and stat output:
Back tester without any strategy.
Strategy added with default option.
Stats with 7 Martingales. You can test up to 15.
Optional Stats:
#binary options#forex#options#statistics#binaryoptionstrategies#backtesting#binary-options-trading-strategy
0 notes
Text
Trading Strategies with Funded Traders Global
This blog explores various trading strategies and provides valuable insights into market analysis, risk management, and developing a successful trading strategy. It covers the three pillars of market analysis: fundamental analysis, technical analysis, and sentiment analysis, and emphasizes the resources and tools offered by Funded Traders Global to enhance traders' market analysis skills. The blog also delves into long-term and short-term trading strategies, including buy and hold, trend following, value investing, day trading, swing trading, and scalping. Additionally, it highlights the importance of risk management in safeguarding capital and explores risk awareness, position sizing, stop-loss orders, and risk-reward ratios. The blog concludes with discussions on developing a trading strategy, backtesting, forward testing, and advanced trading strategies like options, algorithmic, and event-driven trading. Throughout the blog, Funded Traders Global is presented as a trusted partner providing educational materials, expert insights, and cutting-edge tools to support traders in their journey toward success in the financial markets.
#Trading strategies#market analysis#fundamental analysis#technical analysis#sentiment analysis#long-term trading#buy and hold#trend following#value investing#short-term trading#day trading#swing trading#scalping#risk management#risk awareness#position sizing#stop-loss orders#risk-reward ratios#developing a trading strategy#backtesting#forward testing#advanced trading strategies#options trading#algorithmic trading#event-driven trading#Funded Traders Global.#ftg#trading potential#financial markets
0 notes
Text
How does algorithmic trading handle risk management and position sizing?
Algorithmic trading has transformed the financial markets by offering traders the ability to execute trades swiftly and efficiently. However, successful navigation of the market requires robust risk management and position sizing techniques. In this blog post, we will explore key strategies employed in algorithmic trading to effectively manage risk and determine optimal position sizes (How does algorithmic trading handle risk management and position sizing?)

Stop Loss Orders: Safeguarding Your Capital
Setting Risk Limits: Defining Boundaries
Volatility-Based Position Sizing: Adapting to Market Conditions
The Power of Diversification: Spreading Your Risk
Evaluating Risk-Adjusted Returns: Measuring Efficiency
Monte Carlo Simulations: Gaining Insights into Probability
Continuous Monitoring and Adaptation: Staying Ahead of the Curve
Conclusion:
Stop Loss Orders: Safeguarding Your Capital
Stop loss orders act as a safety net in algorithmic trading systems, automatically triggering an exit when a predefined price level is reached. Discover how these orders protect against excessive losses and ensure capital preservation.
Setting Risk Limits: Defining Boundaries
Establishing risk limits is essential to maintaining control over trading activities. Learn how to define maximum loss per trade or portfolio exposure, setting clear boundaries for risk-taking within your algorithmic trading system.
Volatility-Based Position Sizing: Adapting to Market Conditions
Volatility is an inherent characteristic of financial markets. Explore how algorithmic traders adjust position sizes based on market volatility, enabling consistent risk exposure across various instruments and market environments.
The Power of Diversification: Spreading Your Risk
Diversification is a fundamental risk management technique. Understand how algorithmic trading strategies leverage portfolio diversification to mitigate the impact of individual trades or market events, promoting a more stable trading approach.
Evaluating Risk-Adjusted Returns: Measuring Efficiency
Assessing the performance of an algorithmic trading system goes beyond measuring returns. Discover how risk-adjusted metrics, such as the Sharpe ratio, provide a comprehensive assessment of a strategy's efficiency in managing risk relative to its returns.
Monte Carlo Simulations: Gaining Insights into Probability
Explore the world of Monte Carlo simulations and their application in algorithmic trading. Learn how these simulations help traders evaluate the potential risk and return characteristics of their strategies by simulating thousands of market scenarios.
Continuous Monitoring and Adaptation: Staying Ahead of the Curve
Effective risk management and position sizing require constant monitoring and updates. Uncover the importance of regularly reviewing and adjusting risk parameters and position sizing rules to adapt to changing market conditions and new information.
Conclusion:
Mastering risk management and position sizing is paramount for success in algorithmic trading. By implementing stop loss orders, defining risk limits, adapting to market volatility, diversifying portfolios, evaluating risk-adjusted returns, leveraging Monte Carlo simulations, and maintaining continuous monitoring, traders can navigate the markets with confidence and efficiency. Harness the power of these strategies to enhance your algorithmic trading endeavors and achieve sustainable results.
Remember, effective risk management and position sizing are integral components of a well-designed algorithmic trading system, ensuring the preservation of capital and the optimization of trading performance.
Read the full article
#Backtesting#HighFrequencyTrading#MachineLearning#MarketSentimentAnalysis#MeanReversion#Optimization#RiskManagement#StatisticalArbitrage#TrendFollowing#algotradingindia
0 notes
Text
"Mastering Technical Analysis: A Comprehensive Guide to Analyzing Price Charts, Indicators, and Patterns for Informed Trading"
Mastering technical analysis is a crucial skill for anyone looking to navigate the financial markets.
Technical analysis involves studying historical price data and trading volumes to forecast future price movements. While it doesn’t predict future events or fundamental changes in a company, it provides valuable insights into market sentiment and potential price trends.
Here’s a detailed guide…
View On WordPress
#Backtesting#bollinger bands#candlestick patterns#Chart Patterns#Continuous Learning#Discipline#Double Bottoms#Double Tops#Fibonacci Retracements#Flags and Pennants#Head and Shoulders#Moving Average Convergence Divergence (MACD)#moving averages#Price Charts#Psychology#Relative Strength Index (RSI)#Risk Management#Risk-Reward Ratio#Stop-Loss Orders#Support and Resistance#technical analysis#Timeframes#Trading Strategies#Trends#triangles
0 notes
Text
The Pros and Cons of Using Automated Trading Systems

Exploring the Benefits and Drawbacks of Automated Trading Systems in the Financial Markets
By Amir Shayan
In recent years, automated trading systems have become increasingly popular among traders in the financial markets. These systems, also known as algorithmic trading or black-box trading, use computer programs to execute trades automatically based on pre-set rules and parameters.
While automated trading systems can offer several advantages, such as increased efficiency and faster trade execution, there are also potential drawbacks to consider. In this article, we will explore the pros and cons of using automated trading systems and help you determine whether this type of trading is right for you.
Pros of Using Automated Trading Systems:
- Increased Efficiency: One of the main advantages of using automated trading systems is increased efficiency. These systems can analyze vast amounts of data and execute trades faster than human traders, allowing you to take advantage of market opportunities as soon as they arise.
- Elimination of Emotional Bias: Emotions can often cloud a trader's judgment and lead to poor decision-making. Automated trading systems operate based on pre-defined rules and parameters, eliminating the emotional bias that can often lead to losses.
- Backtesting and Optimization: Automated trading systems can be backtested using historical data to evaluate their performance and optimize their parameters. This can help you to refine your trading strategy and improve your overall performance.
- Consistency: Automated trading systems can execute trades consistently based on pre-set rules, ensuring that you stick to your trading plan and avoid impulsive decisions that could lead to losses.

Cons and Pros of Using Automated Trading Systems
Cons of Using Automated Trading Systems:
- Technical Issues: Automated trading systems rely on technology, which can be prone to glitches and other technical issues that could lead to losses. It's important to have a thorough understanding of the system's operation and a backup plan in case of technical difficulties.
- Lack of Flexibility: Automated trading systems operate based on pre-set rules and parameters, which may not allow for the flexibility needed to adapt to changing market conditions or unforeseen events.
- Over-Reliance on Technology: Relying too heavily on automated trading systems can lead to a lack of personal involvement in the trading process and a decreased ability to learn from market experience.
- Potential for Over-Optimization: While backtesting and optimization can be helpful in refining your trading strategy, there is also a risk of over-optimization, where the system is tailored too closely to historical data and may not perform as well in real-time market conditions.
Conclusion
In conclusion, automated trading systems can offer several benefits to traders, including increased efficiency, elimination of emotional bias, and the ability to backtest and optimize your trading strategy. However, it's important to be aware of the potential drawbacks, such as technical issues, lack of flexibility, over-reliance on technology, and the risk of over-optimization. Ultimately, the decision to use an automated trading system should be based on your individual trading goals and preferences.
Read the full article
0 notes
Text
How to Deal with Your First Time in Forex Trading?
How to Deal with Your First Time in Forex Trading?
If you’re considering getting into forex trading, there are a few things you should do before you jump in. First, you should understand what forex trading is all about. Then, you need to learn about risk management and technical analysis. Finally, you should follow a trend.
Learn about forex trading
There exist a number of ways to get started with Forex trading. You can open a demo account and…

View On WordPress
0 notes
Link
Once you’ve discovered some profitable strategies the next step is to combine them in a portfolio.
To build a portfolio, click on Portfolio, then “Create new portfolio”. You can select the strategies you want to include in your portfolio, and finally give your portfolio a name. On clicking “Create”, your portfolio will now be ready.
#tradingview backtest#BackTesting Software#option backtesting software#best backtesting software#free backtesting sites india#backtesting#option backtesting
0 notes
Last Seen Blogs

relapin
"contact zone"

silvervalleysims
Sims2blr

czar-wars
g'nite fuck-o's

flyinghighcloset
Flying High Closet

warnerstree1
Untitled