
lupine-publishers-ciacr
Agriculture Open Access Journals
Lupine Publishers agriculture open access journals,journal of agricultural research,Open Access Agricultural Research Journal
75 posts
Don't wanna be here? Send us removal request.
Last Seen Blogs

alchemistaccounting
Alchemist Accounting UAE

db5kholic
❅ W ❅

youchangedmedestiel
You changed me, Destiel

haikyuuprettysettersquad
Pretty Setter Squad

frizzy-frizz-frizz
mushroom vibes
Text
Lupine Publishers | Instructions for Irrigating and Watering Plants (Indonesian Version)

Opinion
Written by Ir. Sri Najiyati & Ir. Danarti, human efforts to fulfill and regulate the need for plants for water, which is often called irrigation, have developed since ancient times. Although at that time the methods and tools used were still traditional and makeshift. At present the business has increased with technology. Various characteristics of plants in relation to water have been studied and sophisticated and modern mechanization tools have also been found, so that irrigation can be carried out appropriately both time and method as well as the amount of water requirements without requiring much labor. The description in this book begins with a description of the properties of water in nature and in relation to plants and the characteristics of each type of plant for water needs. Also contains instructions on ways to provide water for plants both traditional and modern, because according to the authors traditional methods are still relevant while modern methods are feasible to be implemented in Indonesia. Water is one of the factors that is very important for plant life. It is not surprising that its existence is very influential on the types of plants that live somewhere. In areas that have high rainfall, we will find plants that need a lot of water, while in areas with low rainfall we will find plants that are resistant to drought.
The role of water for plant life is water as a nutrient solvent in the soil so that plants can easily take the nutrient through the roots as food and at the same time transport the hope to parts of plants that need it. Water is one of the important components in photosynthesis, namely the process of forming carbohydrates from water and carbon dioxide with the help of sunlight. Almost all plant physiology processes including chemical reactions take place in the presence of water. Inside the water plant functions to maintain the firmness of the plant. If the plant lacks water, the plant will wither and then die. Water as a temperature controller in plants when the sun is hot. When the sun is hot, leaves and other parts of the plant will overheat so that the temperature can rise continuously if there is no one to control it, namely water. Water controls the temperature of the plant by evaporation through the stoma on the leaf surface. Because evaporation requires heat, so the temperature of the plant that was too high became constant again. The benefits of water for plants are very large and their presence around the plants is an absolute requirement for plants to take the water for their lives. But its existence can also be a disaster if the amount is excessive. All plants need water, but their needs vary depending on the type. Rice, for example, requires a lot of water almost during its growth period. Instead the cactus will languish if it lives in an environment that contains lots of water. On this earth there are approximately 1.3-1.4 billion cubic km of water. But this large amount is not all around the plants we cultivate but most of them are in the sea, in rivers, in lakes, in swamps, in the air as clouds or as groundwater that is not accessible to the roots of plants. For plants to meet their water needs, cultivating human intervention is very necessary. Human intervention to meet the needs of plants for water is called irrigation. According to the method of administration the irrigation system is divided into three, namely watering systems, aboveground irrigation and subsurface irrigation. Watering is a system of giving water by spraying so that the fall of water to the surface of the soil / plant will be in the form of granules that resemble rain. While irrigation is a system of giving water by flowing and flooding above the soil surface or from below the soil surface. In the past, when humans were not familiar with advanced technology, the new irrigation system was carried out simply with a makeshift tool. The water channels that are made are generally not permanent and are easily damaged so that plants that require a lot of water such as rice can generally only be planted in the rainy season or once a year. Irrigation like this is known as non-technical irrigation. At this time when humans have known advanced technology, irrigation and watering systems have evolved along with technological developments.
For more Agriculture Open Access Journal articles Please Click Here:
https://publons.com/publisher/7295/lupine-publishers-llc
0 notes
Text
Happy Independence!!!

May our country celebrate more years of independence. May it flourish and prosper with every passing year. Sending warm wishes to you on this happy occasion.
Never let this freedom perish…. Always value it and keep it safe and Wish you a Very Happy Independence on behalf of our Lupine Family.
0 notes
Text
Lupine Publishers | Evaluating the Impacts of Development on Agricultural Land

Mini Review
In developing nations like the Kurdistan region in Iraq, experience shows that, during the initial phases of development, urban expansion becomes a top priority and as a consequence agricultural land is often considered as a set aside for forthcoming urban expansion. Hence, agricultural lands are at risk due to the loss of land to urbanization. The Kurdistan region in Iraq is highly suited for agriculture as it boasts significant areas of arable land, fertile soil and various micro-climatic zones [1,2]. Potentially, agriculture in the Region could become an important public revenue and the rehabilitation of this sector translates into reviving village life, creating more job opportunities, encouraging new industries, and upgrading the standard of living and quality of life [3,4]. Agriculture in the region is characterized by its low productivity due to a number of reasons which include using outdated farming practices, not matching agricultural produce with the best fitting environmental conditions. An added factor can also be the loss of prime productive land to urbanization. This note assesses the influences of urban expansion, on wasting arable land and the ultimate consequence on sustainable agricultural production in the Kurdistan region, Iraq.
A practical way forward for increasing agricultural productivity is through land capability and suitability mapping, which spatially and temporally summarizes the extent to which the inherent physical capacity of the land and the associated favorable climatic conditions in a particular area is agricultural production without reducing the soil’s long-term productivity, subject to good management Dent and Young, 1981; Emery, 1986. Hence, land capability and suitability classification are a specific grouping of soils made primarily for agricultural purposes.
The suitability of land for plant production in Iraq was developed based on the Soil Survey Geographic Database (SSURGO) which rates soils based on their ability to support cultivation and farming of common crops without deterioration of the soil over long periods of time. It contained 8 classes ranging from the soils with the potential for agricultural production (class I) to areas not capable of agricultural production such as rock outcrops and sandy heath (class VIII). Under good management, soils in classes from I-IV are capable of producing common cultivated field crops, pasture plants, range plants, and forest trees without reducing the soils long-term capacity. Using the suitability of land for plant productions for Iraq, a new GIS based Land capacity and suitability map was produced for the Erbil governorate and provinces. This binary map was developed based on clustering the 8 classes into two classes. The first soil classes ranked from 1-4 are considered as “Suitable”, while the other classes were considered “Less Suitable” (Figure 1). The map shows that the main urban centers are located on the most suitable land for agriculture as the community is agricultural in nature.
The outcome was then correlated with recently developed Master plans for Erbil governorate and provinces. Using this information, a GIS based map was produced (Figure 2). The results disclosed the estimated loss in productive agricultural land when the current Master plans are implemented, making the estimated loss in Erbil governorates to be around 1514Km². Therefore, under current practice, urban expansion can only be implemented through wasting valuable productive agricultural land. Clearly, the paradox is that as the population grows, the need for urban expansion grows, and the latter can only be carried out by wasting productive agricultural land and endangering sustainable agriculture. This suggests the need revise to the Master plan and to find a healthy balance between development and sufficient food production for the current as well as the growing population. Furthermore, the outcomes can provide the necessary information on the broad agricultural products most physically suited to an area, that is, the uses with the best match between the physical requirements of the use and the physical qualities of the land. Consequently, it can provide guidance on the inputs and planning requirements associated with different management schemes for increasing agricultural production within the region.
Figure 1: The spatial distribution of suitable land for agriculture in Erbil Governorate in Kurdistan Region, Iraq.
Figure 2: The impacts of Master plans on squandering land in Erbil.
For more Agriculture Open Access Journal articles Please Click Here:
https://publons.com/publisher/7295/lupine-publishers-llc
0 notes
Text
Lupine Publishers | Influence of Inoculation Methods of Rhizobial Strains Having ACC-Deaminaze Activity on Growth and Yield of Rice Crop Under Salt-Affected Field

Abstract
A field experiment was conducted at Soil Salinity Research Institute, Pindi Bhattian, experimental farm to evaluate different Rhizobial inoculation methods on growth and yield of rice (Oryza sativa) cv. Basmati-385 under natural salt-affected soil (pH= 8.55, ECe= 5.32 dSm-1 and SAR=25.46) during 2015-16. Seeds of rice were inoculated with four rhizobial strains (RPR-32, RPR-33, MW- 20 (PSB) and SBCC (M8) in three ways i.e. rice seeds inoculated for direct seeding and nursery and dipping seedling roots in the solutions of these rhizobial strains. Maximum tillering was observed with all strains under different inoculation methods. Although, the strains performed better as compared to control, however, dipping of nursery roots produced significantly higher yield followed by seed inoculation for direct seeding. Overall, among all the rhizobial strains, MW-20 (PSB) and SBCC (M8) produced comparable paddy yield. The highest paddy yield (291gm-2) was harvested with SBCC (M8) seed inoculation which was 19% more than that of un-inoculated (control).
Keywords: Rhizobial strains (RPR-32, RPR-33, MW-20 (PSB) and SBCC); Rice; Number of tillers and Paddy yield
Introduction
Rice is a grain crop for feeding more than half of the world population [1]. The entire form of life is reliant on plants as they produce oxygen and form the staple food for humans and animals. According to report, 98% of the world’s food necessities are fulfilled by 12 plant species and 14 animal species. Above 50% of the world energy ingestion is met by crops such as wheat, rice and maize [2]. Soil salinity is one of the chief abiotic factors affecting soil microbial activities and crop productivity. Reports showed that over 20% of agricultural land internationally is affected by salt [3]. It is estimated that the salinization will cause the loss of 50% arability of agricultural land by the middle of the 21st century [4]. Saline soil adversely retards the plant growth and productivity by shifting the normal metabolism of plants. Mitigation of salinity stress by plant growth promoting rhizobacteria plants. One of the effects of salt stress is an increase in the band of 1-aminocyclopropane-1- carboxylic acid (ACC), a precursor of ethylene, which consequences in accretion of ethylene. Increase in the rank of ethylene away from a threshold level is termed ‘stress ethylene’, which minimizes plant growth [5] and alters photosynthesis and photosynthetic components [6]. Besides salt stress, other stresses such as flood, drought, wounding, pathogen attack, temperature stress, and mechanical stress also contribute to considerable rise in the level of endogenous ‘stress ethylene [7].
Bio-fertilizers are defined as biologically active products or microbial inoculants of bacteria, algae and fungi (separately or in combination), which possess the innate ability either to fix or mobilize important nutrient elements from non-usable forms through biological process. Bio-fertilizers also include organic fertilizers (manure, etc.), which are rendered in an available form due to the interaction of micro-organisms or due to their association with plants. They need to be applied to soil to enhance microbial activity in the rhizosphere playing a significant role in integrated plant nutrient systems [8]. Excessive and imbalanced use of chemical fertilizers has adversely affected the soil causing decrease in organic carbon, reduction in microbial flora of soil, increasing acidity and alkalinity and hardening of soil. Moreover, excessive use of nitrogenous fertilizer is contaminating water bodies’ thus affecting aquatic fauna and causing health hazards for human beings and animals. Hence world is shifting gradually to replace chemical fertilizers with Bio-fertilizers. Bio-fertilizers are organisms that enrich the nutrient quality of soil [9]. For many farmers, BNF is, therefore, an essential, cost effective alternative or complementary solution to industrially manufactured N fertilizers for staple cereal crops [10,11] reported that calcium and phosphorus were limiting factors for BNF under acidic soil conditions.
In Pakistan, phosphorus in soil is generally quite abundant but it reacts readily with iron, aluminum and calcium to form insoluble compounds. These reactions result in very low phosphorus availability and low efficiency of phosphorus fertilizer used by the plants [12]. The outcome of PGPR on agricultural crops has been investigated and published by various scientists during the last two decades [13-17]. The capability of these strains for improving plant growth was tested in agriculture by using bacterial inoculation in greenhouse as well as under natural field conditions [18-20]. Ethylene is a simple, two-carbon, unsaturated hydrocarbon which is a potent regulator of plant growth and progress [21]. Initially, ethylene was known as a ripening hormone, but later demanding studies, tied with the advent of highly sophisticated analytical techniques, like gas chromatography, unveiled its role in growth and development all over the life cycle of the plant. Because of its varied and effectual role in plant growth and development, ethylene virtues equal category with other classes of plant hormones [22]. Therefore, a field experiment was conducted at Soil Salinity Research Institute, Pindi Bhattian, experimental farm to evaluate different Rhizobial inoculation methods on growth and yield of rice (Oryza sativa) cv. Basmati-385 under natural salt-affected soil.
Materials and Methods
A field experiment was conducted at Soil Salinity Research Institute, Pindi Bhattian, experimental farm to evaluate different Rhizobial inoculation methods on growth and yield of rice (Oryza sativa) cv. Basmati-385 under natural salt-affected soil (pH= 8.55, ECe= 5.32 dS m-1 and SAR=25.46) during 2015-16. Seeds of rice were inoculated with four rhizobial strains (RPR-32, RPR-33, MW- 20 (PSB) and SBCC (M8) in three ways i.e. rice seeds inoculated for direct seeding and nursery and dipping seedling roots in the solutions of these rhizobial strains. Randomized complete block design was applied with three replications. The data obtained were subjected to statistical analysis using the STATISTIX statistical software (Version 8.1) and the mean values were compared using least significant difference (LSD) [23].
Results and Discussion
Table 1: Effect of inoculation methods of Rhizobial strains having ACC-Deaminaze activity on growth (plant Height, panicle length and number of tillers) of rice crop under saline environment.
Values followed by same letter(s) are statistically similar at P=0.05 level of significance.
Growth parameters (plant height, panicle length and tillering) data was represented in Table 1. Plant height and panicle length showed non- significant results among three inoculation methods. However, all the inoculation methods exhibited better performance than control i.e. without-inoculation.MW-20(PSB) attained the highest plant height (117cm) in seedling root dipping inoculation methods. Similar trend was also predicted in panicle length. Significant results were indicated regarding tillering of the rice plants. SBCC (M8) rhizobial got maximum number of tillers m-2 (245) among other rhizobial strains, Seedling root dipping technique was the best inoculation method than other two methods. Maximum tillering was observed with all strains under different inoculation methods [24] investigated that biozote significantly affected on germination, root length, fresh weight and dry weight in all mung bean varieties [25] concludes that growth of maize plants behaves better under saline environment as inoculated with different rhizobial strain showing ACC Deaminaze activity due to the production of ethylene under stressed conditions. Reduction in sodium uptake by the utilization of different rhizobial strains under saline environment is a positive sign to induce salt tolerance biologically. Data regarding 1000- grain weight and grain yield indicated in Table 2 Non- significant results were attained in 1000- grain weight among inoculation methods as well as rhizobial strains. But three inoculation methods performed better than control. SBCC (M8) rhizobial strain produced the highest 1000- grin weight (25g) among other strains under seedling root dipping inoculation method [26] resulted that growth of wheat plants performed better under saline environment as inoculated with different rhizobial strains due to the production of ethylene under stressed conditions.
Table 2: Effect of inoculation methods of Rhizobial strains having ACC-Deaminaze activity on1000- grain weight and yield of rice crop under saline environment.
M1 = Seed Inoculation for DSR M2 = Nursery Seed Inoculation M3 = Seedling Root Dipping Values followed by same letter(s) are statistically similar at P=0.05 level of significance.
Although, the strains performed better as compared to control, however, dipping of nursery roots produced significantly higher yield followed by seed inoculation for direct seeding. Overall, among all the rhizobial strains, MW-20 (PSB) and SBCC (M8) produced comparable paddy yield. The highest paddy yield (291gm-2) was harvested with SBCC (M8) seed inoculation which was 19% more than that of un-inoculated (control) [27] reported the reduction in sodium uptake by the utilization of different rhizobial strains having ACC deaminaze activity under saline environment is an encouraging sign to induce salt tolerance naturally and reduce the toxic effects of utilization of chemicals for reclamation of salt – affected lands.
Conclusion
This study concluded that maximum tillering was observed with all strains under different inoculation methods. Although, the strains performed better as compared to control, however, dipping of nursery roots produced significantly higher yield followed by seed inoculation for direct seeding. Overall, among all the rhizobial strains, MW-20 (PSB) and SBCC (M8) produced comparable paddy yield. The highest paddy yield (291gm-2) was harvested with SBCC (M8) seed inoculation which was 19% more than that of uninoculated (control).
For more Agriculture Open Access Journal articles Please Click Here:
https://publons.com/publisher/7295/lupine-publishers-llc
0 notes
Text
Lupine Publishrers |The Newest Agricultural Technologies

Abstract
The primary objective of agricultural production is to provide an economical, sustainable and productive industry in plant and animal production. For this purpose, alternative solutions are provided to the problems that need solution or improvement and to facilitate agriculture in various areas such as increasing productivity and product quality, minimum input usage, food reliability, protection of natural resources and environment in agricultural production. In this study, the technologies which are successfully applied in plant production and animal breeding were addressed by taking into consideration the advances made especially in recent years.
Keywords: Precision agriculture; Smart farming; Precision livestock farming; Autonomous tractor; Unmanned aerial vehicles
Introduction
The agricultural sector has been adversely affected by global market instabilities, economic crisis, animal diseases and climate changes in recent years. In addition, structural problems such as the average size of farms not allowing adequate investments to increase productivity, absence of large-piece agricultural lands, lack of education, agricultural employment and population growth as well as the emergence of alternative uses of agricultural products such as biofuels cause inefficiencies [1]. Due to the rapid increase in the world population and urbanization, agricultural land per capita and natural resources such as water are decreasing due to the decrease in agricultural areas. For this reason, it has become necessary to increase productivity in agricultural production through technological and genetic methods. Excessive use of chemicals and fertilizers, during the intensive agricultural practices made to increase efficiency, has caused problems such as environmental pollution in soil and ground water and the loss of the production power of the field over time. Today, increasing product quality, minimum input usage, food reliability, protection of natural resources, increased environmental awareness, economic production and sustainable agriculture concepts have become a priority, despite the previous goals of increased yield and productivity.
As a result of the rapid developments in information technology following the mechanization, automation, and control technologies during the development period of agricultural production, today, intelligent machines and production systems that control machines have begun to take over traditional production methods. Information technology consists of hardware, algorithms and software developed for the management of the collection, processing, storage, transfer and use of information processes. The implementation of present knowledge and experiences in agriculture together with the machine learning, deep learning, artificial intelligence, modeling and simulation applications enabled the development of real-time and automated expert systems, autonomous tractors or agricultural machines and agricultural robotics applications.
Precision Agriculture
Precision agriculture technologies, combining with control, electronics, computer and data base with the account data, present an advanced system approach. Using global positioning system, geographic information system, variable rate application and remote sensing technologies, precision agriculture technologies, contrary to common fixed-level application methods which are applied at all same to whole land, use the variable-level application methods (based on application of fertilizer and chemicals to each section to its own needs, tillage at different levels, planting at different norms, irrigation and drainage at different levels) determining land and plant characteristics of small sections (soil moisture, nutrient level of soil, soil structure, product requirements, yield, etc.). As a result, Precision agriculture technologies are agricultural production and management methods whose targets are more economic and more environmentally sensitive production [2].
Precision agriculture practices start with the acquisition of data through the use of various sensors and remote sensing technologies and continue with the determination of soil properties of the production area through soil tests. All information such as yield values, fertilizer and pesticide application norms, climatic data, topographic data, weed density, disease status of the previous production seasons are associated with their actual location in the production area. Then, the applications to be done are decided using appropriate hardware and software. And, it ends with the application of variable-level practices in the field according to the application form decided. In addition, variable rate application systems and real-time product monitoring systems have been developed as a result of the sensors and software developed by the manufacturers of precision agricultural equipment and technologies:
a) Increased production efficiency,
b) Improved product quality,
c) The use of more effective chemicals and other inputs,
d) Energy saving,
e) The soil and ground water protection.
In addition to the production of field crops, precision agriculture technologies have been successfully applied in vineyards and orchards, pasture and meadow management and in animal production. Applications vary from tea industry in Tanzania and Sri Lanka to sugar cane production in Brazil, rice in China, India and Japan, grain and sugar beet production in Argentina, Australia, Europe and the United States [3]. Although it is expressed using different terms such as precision agriculture, precision farming, smart farming, variable rate application, site specific farming, site specific management, computer aided farming and prescription farming, the term smart farming has become more widely used recently.
Figure 1: A typical crop growing cycle in precision agriculture [5] modified [4].
The precision agriculture, or the knowledge-based management of agricultural production systems, has emerged in the mid-1980s as a method for implementing the right process at the right time in the right place. The increased awareness of the variability in soil and product conditions has been combined with emerging technologies such as global navigation satellite systems, geographic information systems, and microcomputers. In the beginning, precision agriculture has been used to adapt the fertilizer distribution to the variable soil conditions in the agricultural area. Since then, additional applications have been developed, including the automatic steering applications of agricultural vehicles, autonomous machinery and processes, product monitoring, farm research and software for the general management of agricultural production systems. A typical crop growing cycle in precision agriculture is shown in Figure 1 [4].
Precision Livestock Farming
The first desired condition in animal production is breeding races with higher meat and milk yield. Second one is to make sure that the highest level of individual potential of animals is achieved through an adequate and balanced nutrition. The third is to take preventive health measures against diseases that cause the major losses in animal production and to minimize the use of drugs with the early detection of diseases and the necessary intervention [5]. Precision livestock production practices have contributed significantly to the solution of the problems experienced in animal breeding and in increasing the desired yield and quality in meeting the increasing animal food needs. Effective decisions are made by using precision livestock production practices in animal production and by monitoring individual animal conditions (amount of mobility, water consumption, milk conductivity value, amount of milk, etc.); necessary health measures are taken as soon as possible with the early identification of negative changes in animal health; and, sustainable and productive management is provided by ensuring that the individual potential of the animals is utilized at the highest level by making the herd management applications accurate and timely [6].
Precision livestock production allows collecting data at individual cow level as well as precision (individual) nutrition, regular milk recording (yield and components), pedometer, pressure plates, milk conductivity indicators, automatic oestrus detection, body weight, temperature, lying behavior, ruminal pH, heart rate, feeding behavior, blood analysis, respiratory rate, rumination time and movement skill scoring using image analysis. In this way, it minimizes drug (antibiotics) use and provides and proactive animal health strategy through preventive health by focusing on health and performance [7]. Benefits from precision animal production technologies include increased efficiency, reduced cost, improved product quality, minimized negative impacts on the environment and improved animal health and welfare. These technologies are likely to have a major impact on health, reproduction and quality control [8]. Figure 2 shows the areas observed in dairy cattle in precision livestock production.
Figure 2: The areas to monitor in dairy cattle in precision livestock production [9].
Figure 3: The tasks of the automated control systems for dairy farming [10].
Automatic control systems developed for dairy cattle farms provide solutions to the following tasks (Figure 3) [10]:
a) Getting the current information about animals;
b) Fast access to the animal history;
c) Increasing the milk yield because of the preclinical disease diagnosis;
d) Structure analysis of the herd and the animal physiological condition;
e) Reducing veterinary medicine costs;
f) Detection of the breaches in the herd reproduction technology;
g) Reducing the number of unpregnant animals and increasing the calf’s productivity;
h) Increasing the feeding effectiveness;
i) Reducing work costs and the improvement of work culture.
Autonomous Tractor
The concept of autonomous refers to the functions performed by the tractor without any human intervention. The concept of autonomous tractor and automatic steering should not be confused with each other. A tractor with automatic steering requires an operator for safety, avoiding unknown obstacles and performing unspecified tasks. An autonomous tractor can operate without the operator in overcoming the numerous uncertainties in the agricultural environment. In autonomous tractors, the necessary hardware and software are developed for obstacle avoidance, localization and mapping in addition to determining algorithms, models and methods for movement control. In order to implement route planning and navigation for this purpose, it is necessary to accurately estimate the position of the vehicle and to detect the environment sensitively during the movement of the vehicle.
Figure 4: Safety sensor for an autonomous tractor [11].
Various equipment and systems are used to determine the position of autonomous tractors, to set the desired route correctly, and to map the obstacles and objects around correctly. The information collected from the sensors should allow the autonomous tractor to move safely. Since autonomous tractors operate in outdoor and in diverse environments, errors may occur due to inability to receive information from some of the sensors or due to the errors in the information received. For this reason, it is preferable to process the data from different sensors together and unique advantages of the different types of sensors are used together to obtain a more comprehensive perception (Figure 4). In this way, the information from the sensors provide more detailed information about the location, environment and surrounding objects during the movement of the tractor. And, in order to turn this information into useful information, advanced decision mechanisms, utilizing applications such as image, audio and video processing algorithms, neural networks, machine learning, statistical data analysis, are used and the autonomous tractor is operated successfully in this way. The equipment used in autonomous tractors are listed below:
a) Radar Sensors
b) Laser Scanners,
c) Lidar,
d) GPS / Inertial Navigation System,
e) Ultrasonic Sensor,
f) Cameras.
When developing an autonomous tractor, combining a large number of tasks to increase operational success will relatively facilitate the task. These tasks include [12]:
a) Coordination: The coordination of multiple vehicles can be done centrally. Each vehicle operates independently and does not know necessary information about other vehicles, but it has its own tasks to fulfill.
b) Solidarity: Solidarity refers to the awareness of multiple vehicles, working in the same field, from each other and tasks of the others. For example, if three vehicles carry out the same task, such as clearing the same area from the weeds mechanically, then each vehicle needs to know the rows in which other vehicles were running before selecting a new row to begin. It would not make sense to have two vehicles come to head-to-head at the same time. Real-time communication is needed between the paired vehicles.
c) Cooperation: It refers to multiple vehicles sharing the same task at the same time. Using multiple vehicles to pull a large trailer that a vehicle cannot pull alone is an example of cooperation.
Agricultural Robots
Agricultural robots are classified as indoor and outdoor robots, in general. Outdoor robots include GPS assisted steering systems, meadow robots, pruning robots, spraying robots, seeding/planting robots and silage robot. Indoor robots include harvesting robots, milking robots and barn robots [13]. Autonomous agricultural robots are now an alternative to tractors in the fields. Breeding operations can be carried out by the fleets of autonomous agricultural robots in the future, such as seed sowing, spraying, fertilization and harvesting robots. Agricultural robots must have some basic capabilities and the ability to support multiple applications. A navigation system is required for safe and autonomous navigation as a basic capability [14]. When different applications of autonomous vehicles in agriculture have been compared with conventional systems, it has been found that the first three main groups of potential practical applications include plant cultivation, plant care and selective harvesting [15].
In the last two decades, special sensors (machine vision, GPS, RTK, laser-based devices and inertial devices), actuators (hydraulic cylinders, linear and rotary electric motors) and electronic equipment (embedded computers, industrial PC and PLC) have integrated into numerous autonomous vehicles, especially the agricultural robots. These semi-autonomous/autonomous systems provide correct positioning and guidance in precision agricultural tasks, when equipped with appropriate equipment (agricultural tools or equipment) [16]. Field map can be generated by estimating the location of the plants in the surrounding environment through image processing and recorded data detected by sensors. The position estimation of the robot can be done by a navigation system or relative calculation of the movements of the robot. The distance of the plants to the robot can also be detected by sensors or image processing, and the calculated positions can be marked on a map [17].
The Use of Unmanned Aerial Vehicles in Agriculture
Aerial vehicles that can operate through remote control or autonomously with its own power system, and that can load and unload payloads depending on the place of use are called Unmanned Aerial Vehicles (UAV). There are two types of aerial vehicles, including UAVs that can fly autonomously on a certain flight plan and remote controlled drones. Although these vehicle names are commonly used interchangeably, the term UAV is a general term for all unmanned aerial vehicles, whether autonomous or remotecontrolled.
A typical UAV system consists of the aircraft, one or more ground control stations and/or mission planning and control stations, payload and data connection. In addition, many systems include launch and recovery subsystems, aerial vehicle carriers and other ground services and maintenance equipment. A very simple general-UAV system is shown in Figure 5. Being more complex and having more parts than drone systems increase [18] the cost of system installation of UAVs. In drone systems, however, drones can be used immediately after purchasing drones together with the apparatus without the need for any other costs. Due to the lower cost of purchasing than the UAVs, their ease of use and their capabilities, drones are preferred in agricultural applications.
Figure 5: Generic UAV system [18].
Drone systems provide fast and safe solutions and analysis for numerous situations, particularly for military applications, including natural disasters, monitoring of various sports activities, traffic control, wildlife monitoring, and agricultural applications. Therefore, drone systems are produced in different formats according to their area of use. One of the most preferred applications of drone systems is the four-rotor drone system known as the quadrotor shown in Figure 6. Quadrotor, as the name suggests, is a general term of the drone systems with four independent rotors. The most important advantage of the quadrotor is its high maneuverability. This superiority gives the quadrotor the capability of vertical takeoff and landing in dangerous and confined spaces. Due to the highpower consumption of four rotors of a quadrotor, it cannot perform long-term flight duty. The capacity of the device can be increased by increasing the number of rotors. Six-rotor hexacopters and eightrotor octocopters are the examples of different forms of quadrotor obtained by increasing the number of rotors [19].
Figure 6: Four-rotor drone system [20].
Increasing productivity and improving product quality in agricultural production depends on good monitoring of the plants’ development process and taking the necessary actions at the most appropriate time. Drone systems, which have a simple technical structure and are easy to use, offer farmers an opportunity to make plans in agricultural activities using their embedded sensors and cameras, providing high quality and 3D images. Varies studies are carried out with drone systems, such as product development monitoring, plant species separation, crop harvest determination, automatic harvest, drought, detecting diseases, agricultural pests, etc., damage detection, fruit and vegetable and soil moisture classification, field management, organization of agricultural activities, and agricultural insurance [21].
Drone systems have 5 effective use areas in agriculture. These are [22]:
a) Product status monitoring: Farmers can inspect their growing products faster and more effectively with drones with NDVI or NIR sensors.
b) Irrigation systems monitoring: Large enterprises are able to monitor irrigation systems for the supply of water needed for certain products such as corn, which are spread over large areas, after having reached specified sizes.
c) Weed identification: Weed maps are generated by postprocessing the flight images and NDVI sensor data. In this way, farmers can easily distinguish between high density weeds growing together with healthy plants.
d) Variable rate applications: Variable-rate maps are rapidly and practically generated with the use of NDVI sensors in drone systems, instead of using variable-rate application maps prepared by ground-based or satellite images. In this way, it is possible to increase the efficiency by decreasing fertilizer costs.
e) Herd management and monitoring: The amounts and activity levels of free-bred ovine or bovine animals can be monitored from above through a drone.
Conclusion
Agriculture is a vital industry due to its contribution to the sustainability of lives of people, to national income and employment and its provision of raw materials to other industries. Therefore, the agricultural sector has a direct impact on all segments of the society with its economic, social and environmental dimensions. Economically, subjects such as increasing agricultural production and farmer revenues, minimum use of production inputs, improving marketing conditions, etc. are addressed. Socially, there are topics such as food quality and safety, agricultural employment, socio-economic sustainability of rural areas, animal welfare, etc. And, environmental issues include biodiversity, protection of wildlife, meadow-pasture, forests, underground and surface waters, and soil resources. Utilizing the opportunities offered by advanced technologies is becoming increasingly mandatory in order to achieve high success in studies conducted on all these comprehensive issues, due to the importance of the subjects and difficulties involved.
For more Agriculture Open Access Journal articles Please Click Here:
https://publons.com/publisher/7295/lupine-publishers-llc
0 notes
Text
Lupine Publishers | “Role of Agriculture in Ayurvedic Drug Research”

Mini Review
Ayurveda which is known as science of life, is beauty of Indian culture. From ancient era Indian people live this science. Ayurveda given first preference to prevention than cure. Bhaishajya (doctor), Rugna (patient), Aushadha (medicine/drug), Parichrka (medical assistance) is four chikitsapaad of chikitsa [1]. Aushadha (medicine/ drug) is one of the important chikitsapaad among them. Nowadays golden days of Ayurved are arrives. CCRAS and AYUSH all are engaged in Ayurved research. There are four types of research, drug research is one of important research among them. Drug research in Ayurved done with modern as well as ancient parameter. For drug research source of plants is necessary. Original raw material of herbal drug can supply from special Ayurvedic agriculture. Drug research include proper identification, lit. study, filed work, cultivation, collection, testing efficacy of various part and body of plants, adverse effect, adulteration, morphology, photochemistry, study of various formulation and testing action of drug. [2].
In farming India has second rank in whole world. Due to various climate, soil, geographic structure variety of vegetable, fruits, plants production occurs in india.in exporting also our country is at top rank [3] India has shown a steady average nationwide annual increase in kilograms produced per hector for some items of agriculture. For treatment Ayurvedic physician need different types of fresh and qualitative drugs. Unfortunately most of drugs are unavailable or available with adulteration. Due to popularity of Ayurveda demand of herbal drugs is increased, but supply are less as per need, so marketing peoples do adulteration in herbal drugs. If raw so material of medicine is not pure, than how can we expect proper results? So, there is need of development of trained agriculture filed as per medical Science i.e Ayurveda.
For more Agriculture Open Access Journal articles Please Click Here:
https://publons.com/publisher/7295/lupine-publishers-llc
0 notes
Text
Lupine Publishers | Economic Analysis of Poverty Status of Small-Scale Farmers in Bayelsa State, Nigeria

Abstract
The study analyzed the household poverty status of small scale farmers in Bayelsa State, Nigeria using a multi-stage random sampling technique to sample six hundred farmers. Data were collected using structured questionnaire and were analyzed using descriptive statistics, FGT [1] index and the logistic regression model. The result revealed that the majority of the farmers 80% were females, while 79% of the respondent was married with 46% of them having no formal education. Twenty-seven (27) percent of the crop farmers are poor while thirtyeight (38) of the livestock farmers were poor. Also, the poverty depth and severity of crop farmers were 0.072 and 0.038 respectively whereas they were 0.098 and 0.052 respectively for the livestock farmers. The logistic regression model revealed that age, educational level, household size, farming experience, farm/herd size, household income, household expenditure and membership of cooperative contributed significantly in determining the poverty status of the farmers. This study therefore recommends measures needed to be put in place to encourage and improve the welfare of the farming household towards productive and sustainable agricultural development for poverty reduction.
Keywords: Economic; Poverty; Status; Small Scale; Farmers
Introduction
Nigeria is a vast country endowed with substantial natural resources which include; 68 million hectares of arable land, fresh water resources covering about 12 million hectares, 960 million hectares of coastline and ecological diversity that favor the production of a wide variety of crops, livestock, forestry and fisheries product [2]. These coupled with its 37 million hectares of natural forest and rangeland and total land mass of 923,768km2 [3] makes agriculture one of the prominent sub-sector. In spite of these resources’ endowment, the productivity of agriculture continues to dwindle. One of the major problems confronting Nigeria today is how to improve the quality of life in the rural areas and reduce the level of poverty [4]. Poverty in Nigeria is not only a state of existence but also a process with many dimensions and complexities [5]. The report of the 2006 Nigerian Core Welfare Indicator (CWI) on the poverty profile in the country stated that the dependency ratio, which was defined as the total number of household members aged 0 – 14 years and 65 years and above to the number of household members aged 15 – 64 years was 0.8 Central Bank of Nigeria [6]. This indicated that almost a one-to-one dependency ratio and reflected the high population growth rate in the country. There is also large income inequality with the top 10% of the income bracket accounting for close to 60% of the total consumption of goods and services [7].
The World Bank [8] describes poverty to comprise of many dimensions. It includes low incomes and the inability to acquire the basic goods and services necessary for survival with dignity. It encompasses low levels of health and education, poor access to clean water and sanitation, inadequate physical security, lack of voice and insufficient capacity and opportunity to better one’s life. It may also result in not having enough capacity to feed and clothe the family and/or earn a living. About 90% of the country’s food is produced by small scale farmers cultivating tiny plots of land who depend on rain fed agriculture [9]. According to Omonona [10], poverty is pervasive although the country is rich in human and material resources that should translate into better living standard. Despite its plentiful resources and oil wealth, poverty is widespread in Nigeria [11]. The situation is said to have worsened since the late 1960s, to the extent that the country is now considered one of the 20 poorest countries in the world. Over 70% of the population is classified as poor, with 35% living in absolute poverty. Poverty is especially severe in the rural areas, where social services and infrastructure are limited or non-existent. Majority of those who live in rural areas are poor and depend on the agriculture for food and income.
The concern on the threat posed by poverty has led the Nigerian government over the years to devote considerable attention to alleviating its scourge through various policy projects and programmes which seems not to have stem the ugly situation till date. In view of these, the question about the poverty status of rural dwellers especially the small scale farmers remained unanswered. It is on this premise that this study was carried out to answer these questions.
a) What are the socio-economic characteristics of these small scale farmers?
b) Are the small-scale farmers really poor?
c) What are the factors influencing poverty status of the small scale farmers? and
d) What options are available to small scale farmers in reducing their poverty levels?
Thus, the main objective of this study is to evaluate the poverty status of small scale farmers in Bayelsa State, Nigeria. The specific objectives are to:
a) Describe the socio-economic characteristics of small scale farmers.
b) Compare the poverty status of crop and livestock farmers in the study area;
c) Determine the factors influencing poverty status of the farmers; and
d) Make policy suggestion towards poverty alleviation.
Methodology
Study Area
The study was conducted in Bayelsa State, Nigeria. It is located between latitude 5° 001 to 10° 301 N and longitude 4° 551 to 6° 001 E and covers an estimated land area of 1,810km2 with a population of about 856,729 thousand [12]. It shares local boundary with Delta State, Anambra State and Rivers State with the Bight of Benin at the Southern Flank. There are eight (8) Local Government Areas (LGAs) in the state with Ijaw as their major language. Mean annual rainfall of the area is 2,200mm for upland or dry regions where water bodies are few and 3,500mm for wetland or lowland region which comprises of land areas being surrounded by water bodies. Temperature range is between 23 – 31°C and vegetations found in the area include the saline water swamp, mangrove swamp and the rain forest. Major seasons are the dry (November – February) and wet seasons (October – March). Also, the seasonal condition of the area presents a healthy environment for farming which is the main source of income and livelihood of the state’s population and agriculture accounts for about 72% of the labor force.
Sampling Procedure and Sample Size
The sampling involved a multistage random sampling technique. Firstly, six (6) local government areas were randomly selected using the proportionate sampling method at 75% precision level from the purposively selected three (3) agricultural zones according to Agricultural Development Programme (ADP) structure. In the second stage, ten (10) villages were also randomly selected from the six (6) LGAs each making a total of sixty (60) villages. The third stage involved a simple random selection of five (5) crop and five (5) livestock farmers each from the villages using the list provided by ADP from each of the villages. A total of six hundred (600) respondent farmers were used.
Data Collection
Both primary and secondary data were used for the study. The collection of primary data was achieved using a set of structure questionnaire that was administered by the researcher and trained enumerators complemented with oral interview, information that was collected covered the areas of socio–economic characteristics, farming operations, and income and expenditure patterns. Secondary data were sourced from relevant material both published and unpublished.
Analytical Technique
Three analytical tools namely; descriptive statistics; Foster, Greer and Thorbecke (FGT) model of poverty decomposition [1]; Logistic regression were used for the study. Descriptive statistics such as frequency, percentages, mean were used to profile the socio-economic characteristics of the farming households and also to present the results of the findings. The FGT measure was used to assess the incidence, depth and severity of poverty of the farming households. The approach makes use of the aggregate values of the poverty indices – poverty headcount, poverty gap, and squared poverty gap. The use of the FGT measures required the definition of poverty line and this was calculated on the basis of aggregated data on household income. The FGT measure as used by Baiyegunhi and Fraser [13] is expressed as:
Where:
z = Poverty line
m = Number of households below poverty line
n = number of households in the reference population
yi = Per adult equivalent income of ith household
α = Poverty aversion parameter
z-yi = Poverty gap of the ith household
z – yi = Poverty gap ratio
The headcount index was obtained by setting a = 0, the yield poverty gap index when a = 1, and squared poverty gap index when a = 2. The poverty line is a predetermined and well defined standard of income and value of consumption. In this study, the poverty line was based on the income of the households. A relative poverty line was used in which a household was defined as poor relative to others since they are all farmers. Two third of the mean per capita income (MPCI) was used as a moderate poverty line while one third was taken as the line for extreme poverty. Thus, the farming households were grouped into three categories based on their levels of poverty: the extremely poor (those whose income was less than one-third of MPCI), the moderately poor (those whose income lies between onethird and two-third of the poverty line) and the non-poor (those whose income was above two-third of the poverty line).
Adult equivalents were generated following Nathan and Lawrence [14], thus:
AE =1+ 0.7(N1 −1) + 0.5N2
Where
AE = Adult equipment
N1 = Number of adults aged 15 years and above
N2 = Number of children aged less than 15 years.
Logit Regression Model
A binary logistic regression model was used to analyze the determinants of poverty. Thus, poverty is the dependent variable and is determined by independent variables such as socioeconomic characteristics of households and access to services. The dependent variable is binary (1 if the household is poor and 0 if the household is non-poor). The logit model is based on the cumulative logistic distribution function expressed as:
Where:
Li = log of the odd ratio, which is not only linear in Xi but also linear in the parameters,
Pi = is the probability of being poor and ranges from 0 to 1.
Zi = the function of the explanatory variables (x) which is expressed explicitly as:
Where:
Bo = Intercept, Bi – B9 = coefficient of the independent variables, xi = is the vector of relevant independent variables and U = is the stochastic error term, z = the dependent variable defined as the mean annual per capita expenditure. It was measured in binary terms such that 0 = poor, that is if the mean per capita household expenditure is below the poverty line and l = not poor, that is if the mean per capita household expenditure is above the poverty line and:
X1 = Age (number)
X2 = Farm size (number of herds/hectares)
X3 = Marital Status (1 = Married, 0 = otherwise)
X4 = Household size (number)
X5 = Education Level (number of years)
X6 = Major Occupation (1 = farming, 0 = otherwise)
X7 = Farming Experience (years)
X8 = Household income (Naira)
X9 = Household Expenditure (Naira)
X10 = Extension contact (1 = yes, 0 = otherwise)
X11 = Cooperative Membership (1 = yes, 0 = otherwise)
Results and Discussion
Socio-Economic Characteristics of Respondents
Table 1 shows the socio-economic characteristics of the respondents. The majority, 80.3% of the respondents were female while 19.7% were male. This suggest that majority of small scale farmers in the study area are female. About 61% of the respondent were age <30 to 50years with the mean age of 41 years. These results suggest that majority of the farmers were in their active productive age. Moreover, 79.17% of the respondent farmers were married, only 14.83% were single and 6.00% of the farmers were either divorced or widowed. About 46.50% of the farmer does not have formal education, while 32.67% had primary education. Only 16.17% and 4.67% of the respondents had secondary and tertiary education respectively. These result confirm the low level of education in the study area as the state was rated as an educationally disadvantage state in Nigeria. Majority of the respondent farmers 65.67% had a household size ranging between 6 – 10 persons, while 11.50% had less than 5 persons and 22.83% of the respondent had above 10 persons. The result suggests a large household size among the respondent farmers (Table 1).
Table 1: Socio-Economic Profile of Respondents.
On the basis of farming experience, about 27.50% of the respondents had less than 10 years farming experience, while 39.50% had farming experience ranging between 11 – 20 years. Only 31.17% had farming experience ranging between 21 – 30 years and 1.83% had farming experience of more than 30 years. Based on household income, about 71.17% of the respondents had annual income ranging between N100,000 – N500,000, while 25.33% had annual income ranging between N501,000 - N1,000,000, only 3.50% of the respondents had annual income above N1,000,000. Majority of the farmers 63.00% had household expenditure ranging between N501,000 – 1,000,000, while 22.83% had expenditure ranging between N100,000 – N500,000 and 14.17% of the farmers had household expenditure above N100,000. These result suggest that majority of the respondent farmers spend more than they earn thereby pushing them more into poverty. Majority of the farmers 85.83% have no access to extension services while only 14.17% of the farmers have access to extension services. Moreso, 65.67% of the respondent farmers are members of cooperative societies while 34.33% do not belong to cooperative society (Table 2).
Table 2: Poverty Incidence, Depth and Severity of Respondents.
Analysis of Poverty Status of the Farmers
Table 2 shows the summary of the poverty incidence (P0), depth (P1) and severity (P2) among the respondents. The MPCI of the crop farmers was 21,017.20. This gives a moderate poverty line (2/3 MPCI) of 14,011.47 and a core poverty line (1/2 MPCI) of 7005.73. The MPCI of the livestock farmers was 17,213.10. This gives a moderate poverty line (2/3 MPCI) of 11,475.40 and a core poverty line (1/2 MPCI) of 5737.70. Hence, crop farmers whose monthly per capita income falls between 14,011.47 and 7005.73 were regarded as moderately poor while those who fall below 7005.73 were regarded as core poor and those above 14,011.47 were regarded as non-poor. For the livestock farmers, households whose monthly per capita income fall between 11,475.40 and 5737.70 were regarded as moderately poor while those below 5737.70 were regarded as core poor and those who are above 11,475.40 were regarded as non-poor. The poverty incidence (Table 2) shows that among the crop farmers, 27% of the populations were poor while among the livestock farmers, 38% of the populations were poor. The poverty depth of the crop farmers and livestock farmers was 0.072 and 0.098 respectively. This implies that they would need to be increased by 7.2% and 9.8% respectively for them to come out of poverty and become non-poor. The poverty severity measures the distance of each poor person to another. Among the crop farmers, the distance was 0.038 while in the livestock farmers the distance was 0.052. Overall, a comparison of the poverty status of the crop and livestock farmers indicated that the poverty status is relatively close even though it is higher among livestock farmers. The result may not be unconnected to excessive expenditure incurred by head of household as a result of increase household size and low-income occasion by subsistence nature of farming.
Factors Influencing Poverty Status of the Respondents
Table 3 shows the factors influencing poverty status of the farmers. The regression classification table revealed that the binary logistic model predicted 97% of the regression correctly. The model fits the data at (P<0.001) as indicated by the chi-square goodness of fit statistic (73.28). The goodness of fit of the model proved that the variables tested in this study were valid to explain the determinants of poverty in the study area. Besides, the Nagelkerte R2 value (0.867) shows that about 87% of the outcome (Likelihood of being poor) can be explained by the selected independent variables captured in the model (Table 3).
Table 2: Logistic Regression Result on Factors Influencing Poverty Status of the Respondents.
Percentage Prediction = 97.57%
Goodness of fit chi-square (df=11) = 73.28 (P<0.001) Nagelkerte R2 = 0.867
***, ** and * = figures significant at 1%, 5% and 10% levels respectively.
Source: Computation from field survey data, 2017.
The results of the regression model indicated that eight (8) of the eleven (11) explanatory variables influenced the poverty status of the farmers. The variables were age, educational level, and household size, farming experience, farm/herd size, household income, household expenditure and membership of cooperative. The coefficient of age of the farmer was significant and negatively related to the probability of a household becoming poor. This implies that the age of the farmers is a causative factor of poverty. As age of the farmers increase, the likelihood of being non poor is reduced. This conforms to a priori expectations and work by Ayalneh [15], Obiesesan [16], who opined that older households had greater likelihood of being non-poor. This may be attributed to increased experience and exposure to farming operations and management practices as their age increases.
A positive and significant relationship was found between educational qualification and the likelihood of being non-poor, hence, the higher the educational level, the lower the tendency of been poor. The result is in conformity to a priori expectations and work by Ogwunike [16] who found that a positive significant relationship existed between educational level and the probability of being non-poor. The coefficient of household size was negative and was significant at 1% level. This implies that, the higher the household size, the more likely to become poor. Ceteris paribus. This could be as a result of the fact that the members of such households would have to depend on the limited resources that is available to the household thereby reducing the per capita income of the household. This is in agreement to a priori expectations and work by Khan [5] and Ogwumike [16].
A positive and significant relationship was found between farming experience and the likelihood of being non poor at 5% level. This implies that the higher the years of farming, the higher the probability of being non-poor. This is in conformity to a priori expectations and work by Omonona [10] who stated that exposures and experiences gathered over the years help rural poor people to fight poverty. The author further opined that experience in farming help to reduce losses thereby encouraging proper handling and management of relatively scarce resources. There was a positive and significant relationship between farm/herd size and the likelihood of being non-poor. This implies that as the farm/herd size of the farmer increases, the probability of the household being nonpoor is increased. This finding conforms to a priori expectations and work by Eneyew [17] and Alemu [18] who found that a unit increase in land holding increased the probability of being nonpoor. The coefficient of household income was significant at 1% level and positively related. This implies that as the household income increase, the probability of being non-poor increases. This is in agreement to a priori expectations and work by Alemu [18] who found a positive relationship between household income and the likelihood of being non-poor.
In conformity to a priori expectations, the coefficient of household expenditure was negative and significant at 5% level. This indicated that, the higher the household expenditure, the lower the likelihood of being non-poor. Ogwumike [19] stated that, excessive expenditure by household head is a pointer to poverty. The coefficient of membership of cooperative was positive and significant at 5% level. This implies that, if a household head is a member of cooperative, the likelihood of being non-poor increases. This will not be unconnected with the fact that members of cooperative in the rural settings help their cooperative members in time of needs and also provide incentive and loan facilities to those in need.
Conclusion
The research has shown that, the incidence, depth and severity of poverty were high among the farming households even though some of the farmers fall above the poverty line. The study has also shown that the rate of poverty is relatively higher among livestock farmers compared to crop farmers. Meanwhile, the study has revealed that several factors influences the poverty status of the farming households such as age, educational level, household size, farming experience, farm/herd size, household income, household expenditure and membership of cooperative [20].
Given these findings, therefore, it is recommended that:
a) Government and other relevant non-governmental organizations should provide incentives and infrastructures that will enhance productive and sustainable agricultural development in the rural areas.
b) The farming households need to diversify their productive activities through mixed farming and value addition to improve their non-farm income thereby reducing poverty.
c) Policy makers and the operators of rural economy should carefully understand those variables that influence the poverty status of the farming households and address them critically and vigorously.
For more Agriculture Open Access Journal articles Please Click Here:
https://publons.com/publisher/7295/lupine-publishers-llc
0 notes
Text
Lupine Publishers | Performance of West African Dwarf (Wad) Goats Fed Dietary Levels of Boiled Rubber Seed Meal (Hevea Brasiliensis)
Abstract
Effect of boiled rubber seed meal (BRSM) based diets on the performance of West African Dwarf (WAD) bucks was investigated. Four groups of WADS were randomly fed with the 4 experimental diets (A–D) formulated to contain 0, 10, 20 and 30% BRSM. The experiment lasted for 56 days. Average daily feed intake (g) were 417.90; 428.93; 322.00 and 288.10 for diets A, B, C, D, and the corresponding average daily weight gain was 31.69, 53.92, 46.62, and 34.64 respectively. Feed/gain ratio was 6.90 for goats fed diet C and 7.95 for those fed with diet B. Feed cost per Kg weight gain was N 115.29 for diet C and N 120.42 for diet B. The warm carcass and dressing % were insignificant among the 4 treatment groups, but goats fed diet C showed superiority. Legs, shoulder, sets and bone to lean ratio differed significantly between the treatment groups.
Keywords: Conventional; Non-Conventional; Rubber Seed; West African Dwarf Goats
Introduction
The economic depression of nations has greatly reduced meat availability, and the inadequacy of meat supply has been aggravated by a combination of environment, feed and management factors Wikipedia, [1], Udo [2]. In recent years many categories of Nigerian farmers tend to invest in ruminant livestock farming Hoffmann [3] yet cost of conventional feeds still posed big challenge Hassan [4]. Feed as reported by Akpodiete and Inoni [5], accounts for 60 – 70% of total cost of livestock production and that it’s inadequacy in quality and quantity could lead to a situation of low nutritional status, poor weight gain, poor reproductive ability, poor production, poor health condition and poor conversion ratio Fajemisin [6]. It therefore, becomes important to supply adequate feed in quantity and quality for optimal performance by livestock. Goats’ farming offers ample opportunity for meat inclement and availability. They are easy to keep, require smaller capital investment, play significant role in socio-economic life of the people as they contribute about 35% Nigerian meat supply Oloche [7], and provides income to farmers Peacock [8]. West African dwarf goats are the prevalent and trypono-tolerant breed in the derived and guinea savannah zones Eroarome [9], Udo [10]. But it is worrisome that lack of government legislation for the multiplication of this hardy breed, nutritional constraint particularly during the dry season coupled with the extensive mode of production posed serious problem to their production in the tropic Ahamefule [11] and Ahamefule and Udo [12]. To address the nutritional need of goats, it is therefore, important to supplement their diet with concentrate. As a result of high cost conventional feedstuff and in attempt to reduce competition between man and livestock, nutritionists are in search for alternative non-conventional feedstuff that are cheap and readily available Ahamefule and Udo [12]. There are huge naturally occurring non-conventional feedstuffs that can profitably be used to stimulate small ruminant production Udo [2], Udo [10]. Prominent among them is rubber seed which has no feed value for human Udo [10]. The Humid tropics has large acreage of rubber plantation, and in Nigeria it is cultivated on estimated 185,000 hectares with seed collection of about 10,175 tonnes/year Udo [2], with crude protein content range of 21 – 28%, Crude fibre range of 4.47 – 8% (Udo [2], Udo [10], Njwe [13] and energy range of 2.32 – 2.58 MJ/Kg Udo [2]. Several works on rubber seed have been reported for some breeds animal: pigs Babatunde [14], poultry Nouke and Endeley, 2001, sheep Njwe [13]; but there is paucity of information on the feeding of rubber seed to West African Dwarf Goats. This work however, was designed to evaluate the performance of West African dwarf goat fed dietary levels of rubber seed meal based diet.
Materials and Methods
Experimental Site
The study was conducted at the Goat unit of the Teaching and Research farm, Akwa Ibom State University, Obio Akpa campus, Akwa Ibom State, Nigeria. Obio Akpa is located between longitudes 7° 27’ E and 7° 58’ E. It is located within 3500 – 5000mm annual rainfall with average monthly temperature of 25 °C
Animal Management
Sixteen (16) weaners West African Dwarf (WAD) bucks of 6-7 months old were procured from farmers in the University environment and used for the investigation. On the fifth day of arrival, these animals were all dewormed using albendazole thiabendazole. They were subsequently given acaricide birth using asuntol solution and after that quarantined for 21 days and fed forage and supplements of the test diet for acclimatization. They were vaccinated against Pestes des petite ruminant (PPR) using Rinder pest Tissue culture vaccine. The goats were randomly divided into four groups of four goats per treatment and housed individually in well ventilated cement floored pens equipped with feeders and drinkers.
Experimental Design/Procedures
Four diets were formulated to contain 0 – 30% boiled rubber seed meal (BRSM) and designated as A, B, C and D. These diets were assigned randomly to the four animal groups in a completely randomised design. Each goat received 1kg of designated diet in addition to 2Kg of guinea grass (Panicum maximum). Daily feed intake was determined by subtracting daily feed refusal from the 1kg given the previous day. These were used to calculate the average daily feed intake, average daily weight gain feed conversion ratio, and feed economics of production for each treatment group.
Experimental Diets
Four (4) experimental diets (A-D) were formulated to contain various inclusion levels (0-30%) of boiled rubber seed meal (BRSM) with other conventional ingredients as shown in (Table 1).
Processing of Rubber Seed
Twenty (20) kilogrammes of raw rubber seeds were introduced into cooking pot (in batches) whose water has attained boiling temperature (100 °C) and allowed to boil for 30 minutes after which the seeds were decanted. The boiled seeds were sun-dried for seven (7) days, then dehulled and nuts milled, pressed using garri processing machine to remove oil and the products used to formulate boiled rubber seed meal-based diet (BRSM).
Slaughter Technique
At the end of the feeding trail, three goats per treatment group were starved for 24 hours prior to slaughter. Each goat was weighed before slaughter, after bleeding and after dressing. Dressing percentages were calculated as the weight of dressed warm carcass in relation to the live weight before slaughter. The dressed warm carcass is defined as the weight of the goat after the removal of the head, skin, content of the thoracic, limbs, distal to the carpal and tarsal joints and pelvic cavities (including the diaphragm and kidney). The lungs, head, heart, liver, limb (four feet) and skin were weighed also.
Carcass Evaluation
Three animals per treatment group were slaughtered for carcass evaluation. Jointing of carcass (meat cut) was done following the method adopted by Ahamefule [11]. Each dressed warm carcass was divided down the spinal cord by means of meat saws into two (2) equal half and weighed individually. The left half was subsequently divided into various cuts consisting of thigh, shoulder, loin, sets and ends. Each of the cuts was weighed and the weight doubled in each case before expressing it as percentage of the dressed carcass. The leg (thigh) was severed at the attachment of the femur to the acetabulium; the loin consists of the lumber region plus a pair of ribs, the ends (spare ribs plus belly) consist of six (6) abdominal ribs, the shoulder consist of the scapular, and the sets made up of the breast and the neck. The loin cuts were then dissected into muscles and bone with ligament to obtain the meat to bone ratio.
tatistical Analysis
The experiment was laid out as completely Randomized design. All data were analysed in a one –way analysis of variance (ANOVA) using SPSS [15] package. Duncan’s Multiple Range Test Duncan [16] was used to separate significant means.
Chemical Analysis
All feed samples were analysed for proximate composition using AOAC (2007).
Results and Discussion
The composition and proximate assay of the experimental diets formulated to contain 0-30% boiled rubber seed meal (BRSM) are presented in (Table 1). The dry matter (DM) content of the diets, save for ration B (10% BRS), were fairly comparable (Table 2). The crude protein (CP) ranged from 14.06 – 15.82% and increased as inclusion levels of BRSM increased from B-D. Crude fibre (%) (CF) followed a reverse trend of the CP values. The ether extract (EE) composition (%) increased from diets A-D and stabilized in C and D. the ash contents (%) of the diets followed similar pattern as the EE, rising and stabilizing as the case was. Nitrogen free extract (NFE) values (%) rose from A-B and subsequently decline in diets C and D. The energy values (Kcal/g) followed similar trend as NFE. CP and energy content of the four diets were all above what is required by WAD goats as reported by Ahamefule [11], Akinsonyinu [17].
Table 1: Proximate composition of experimental diets containing various levels of boiled rubber (Hevea brasiliensis) seed meal.
Table 2: Chemical assay of experimental diets containing various levels of boiled rubber (Hevea brasiliensis) seed meal (%DM).
*Calculated, BRSM= Boiled rubber seed meal.
Response of West African Dwarf (WAD) Goats
The performance of WAD goats fed various inclusion level of boiled rubber seed meal (BRSM) is shown in Table 3. Goats fed 10% BRSM consumed significantly (P<0.05) more feed (428.93g/d) than goats fed diets containing 0% (417.90 g/d), 20% (322.00g/d) and 30% (288.04g/d) BRSM. Goats fed diet A (Control) had similar intake (P>0.05) with goats fed 10% BRSM diet; their values were significantly different (P<0.05) with the feed intake of goats fed diets C and D. This may be due to the increasing levels of rubber seed meal from B-D which Gohl [18] reported that rubber seed is not quite palatable and appetizing to ruminant. However, the values obtained in this report is in consonance with previous reports by Spring [19] that feed intake and growth decreased as rubber seed meal (RSM) incorporation levels increased in poultry rations. Njwe [13] also reported that rubber seed is not quite appetizing to sheep and that RSM should not exceed 20% level incorporation and not more than 10% for poultry Babatunde [19] while Devendra [20] considered 20% as optimal inclusion level for pigs. The trend of intake in this study agrees with the report by Rajan [21] that weight gain was not affected when fed diet containing 20% BRSM, but subsequently, a linear decrease in feed intake and daily weight gain occurred as the incorporation of BRSM exceeds 20%. The feed gain ratio for goats fed 20% BRSM was least (6.90) and apparently best and was in line with the reports Njwe [13], Rajan [21] that small ruminants can utilize up to 20% rubber seed without adverse effect on performance. The average daily weight gain range of 34.64 – 53.92g obtained in this study compared favourably with the range reported for WAD goats within the first 12 months of life Nuru [22], Anya [23].
Table 3: Performance of WAD Goats Fed Experimental Diets Containing Various Levels of Boiled Rubber (Hevea brasiliensis) Seed Meal.
a,b,cMeans on the same row with superscripts differ significantly (P<0.05).
Feed Economy
Table 4: Feed economies of WAD goats fed various inclusion levels of boiled rubber seed meal-based diets.
The economy of feeding WAD goats with various inclusion levels of boiled rubber seed meal (BRSM) is presented in Table 4. Daily feed consumed by animals in treatment A and B were similar, but the two groups differed significantly (P<0.05) from animals fed diets C and D that were also similar in their feed intake. Goats fed diet B (10% BRSM) supported highest daily weight gain followed by 20% and 30% respectively. The daily weight gain range (34.64 – 53.92g/d) reported in this study is lower than the range (35 – 65 g/d) reported by Nuru [22] for WAD goats. The feed cost per kilogram weight gain was N150.71 for goats fed diets A of 0% BRSM. The corresponding values for animals fed diets B, C and D were N120.42, N115.29 and N151.65 respectively. The result obtained in this study followed the findings trend of similar investigations by Ahamefule [11] and Anya [23]. They also reported superior feed cost per kilogramme weight gain for WAD goats fed diets containing 20% Pigeon pea and African yam bean respectively. For best yield returns on investment, incorporation of 20% BRSM in WAD goat’s diet is advisable.
Carcass Characteristics
Table 5 shows the carcass yield of WAD goats fed graded levels of diets. The superior warm carcass value (4.09Kg) obtained for goats fed 20% BRSM was not significantly (P<0.05) different from the values of 3.40Kg, 3.67Kg and 2.84Kg recorded for goats fed 0%, 10% and 30% BRSM respectively. More so, there was no significant different (P<0.05) in their dressing percent, though goats fed diet C (20% BRSM) has a superior value of 45.40. The range of dressing percent (DP) obtained in this study (37.22 – 45.40) was comparable with the values (33.05 – 58.07) reported by Udo and Nuru (1985) 45 – 52% for WAD goats in different feeding trials. In Table 6 significant differences (P<0.005) only occur among treatment groups for leg, shoulder, sets and bone to lean ratio. The leg meat cut (g) was best for goats fed diet C (1115.40) and was not significantly different (P<0.05) from goats fed diet B (1030.30), but however differed (P<0.05) significantly from values for goats fed diets A (875.00) and D (525.00). In the shoulder cut (g), goats fed diet C had best cut (1030.30) which also differed (P<0.05) significantly from corresponding values obtained for goats fed diets A (803.10), B (926.90) and D (510.00) Goats fed 20% BRSM (C) diet had sets value (650.00g) which was superior (P<0.05) to other treatment groups. In all parameters investigated goats fed BRSM yielded superior meat cuts relative to other treatment groups indicating that it was best utilized of all the diets. The relatively high but comparable bone to lean ratio obtained for goats fed 0% and 30% BRSM diets in this study is an indication of high feed conversion efficiency by goats in group C (20% BRSM). This is also confirmed by the superior dressing percent (45.40%) and lowest (6.90) feed conversion ratio of goats fed 20% BRSM diet. The mean organ weight for the different group of goats fed the BRSM diets in Table 4-6 shows that all the organs (Liver, Kidney, Heart, Lungs and Spleens) weights were similar (P<0.05); they were not affected by the dietary treatments. Proving that all the inclusion levels of BRSM were safe as dietary concentrate for WAD goats but 20% BRSM diet gave outstanding performance in feed gain ratio, daily weight gain, dressing percent, meat cuts (leg, Shoulder, loin, sets, ends) and bone to lean ratio of WAD goats. Therefore for goat’s production/ fattening programmes, 20% inclusion level of boiled rubber seed meal is recommended as it also produced the cheapest cost per. kilogramme weight gain. This study has shown that if WAD goats are given right nutrition, sixty days could be used to fatten them to market weight, therefore making it possible for a farmer to carry out fattening programmes up to 6 times in a year. Thus generating good income for the farmer.
Table 5: Carcass yield of West Africa dwarf goats fed various levels of boiled rubber (Hevea brasiliensis) seed meal-based diets.
abcdMeans in the same row with different superscripts differ significantly (P<0.05).
Table 6: Average weight of meat cuts, organs and offal weights expressed as percentages of warm carcass or empty live weight.
Conclusion
This study revealed that boiled rubber seed meal generally enhanced performance at different level (10-30% BRSM) with all the inclusion levels being safe as dietary supplement for WAD goats. However, 20% BRSM inclusion level gave the best performance, and is therefore recommended for goat’s production/fattening programme as it also produced the cheapest cost per kilogramme weight gain.
For more Agriculture Open Access Journal articles Please Click Here:
https://publons.com/publisher/7295/lupine-publishers-llc
#agricultural engineering#agriculture#Open Access Agricultural Journals#agriculture open access journals
0 notes
Text
Lupine Publishers | Impact of Some Fertilization Treatments on Crop and It’s Atrebuites on “Fuerte” Avocado Trees

Abstract
This study was carried out throughout two successive seasons 2015 and 2016 at Horticulture Research Station at El-Kanater El-Khayria, Qalyubeia Governorate on 20-year-old avocado trees (Persea americana Mill.) “Fuerte” cultivar grafted on Dayouk rootstock and irrigated with through farrow (surface) irrigation system. In this sequence (N1) as the control or untreated trees and other trees were treated with four treatments of different addition times of nitrogen soil fertilization (N2, N3, N4 and N5) all only once and once with boron and zinc as foliar spraying in concentrations (1, 2 and 3 g/L) beside combination between them. Nitrogen fertilization rated 1200g /tree in 3 times as (NH4No3) 33. 5%. Boron was used as sulaphate boron (17, 5%) and zinc was used as sulphate zinc (34%) each treatment was sprayed independently or in combination three times during (October, January, April). Pollen germination, fruit set as well as yield, fruit weight, flesh weight, oil content percentage and vitamin C were determined to assess the effect of the treatments. The obtained results showed that nitrogen soil application time and boron and zinc foliar spraying were significantly affected on improving all the tested parameters compared with control trees. The study also showed that, nitrogen soil application time N2 with boron and zinc combination at 1g/L/tree was more effective than the other treatments and gave significantly the highest values in comparison of other testes treatments in both seasons of study.
Keywords: Avocado; Fuerte; Nitrogen; Boron; Zinc, Foliar spraying; Application time; Fruit set; Fruit quality and oil content
Introduction
The avocado Persea Americana, Mill belongs to the family Lauraceae. It has developed into three horticultural races (West Indian, Guatemalan and Mexican [1], which are adaptable to a wide range of soil and climatic conditions. Avocado which has been referred to as the most nutritious of all fruits [2], has gained worldwide recognition and significant volume in international trade. Although relatively new in international commerce, this unique fruit has been appreciated and utilized for at least 9000 years in and near its center of origin in Meso-America [3]. Avocado is a relatively new crop in areas of the world outside its native range in the American tropics. In 2013, world production of avocados was 4.7 million tons, with Mexico alone accounting for 32% (1.47 million tons) of the total production. Other major producers include Dominican Republic, Colombia, Peru and Indonesia, together totaling 1.26 million tons or 28% of world production (FAOSTAT of the United Nations 2013). “Fuerte” is one of the most common avocado cultivars in the international market. “Fuerte” accounts for about 55% of the production in Mexico and California and is important in other countries [4] and [5]. In Egypt, the avocado was grown in limited areas in El-Delta, in 50s and 60s of the previous centuries. Only Fuertre and Dayouk were grown in these areas until recent were new areas as El-Nubaria, Ismailia and El-Khatatba started to be grown with avocado.
“Fuerte” the most spread cultivar is a Mexican _ Guatemalan hybrid, Trees are large, with spreading crowns; leaves have aniseed smell when crushed, red flecking on wood of new shoots; flower Group B, fruit pyriform with distinct neck but variable ranging from elongated with long narrow neck to dumpy with short broad neck, medium to large size weighing 170–500 g, skin thin, green, medium gloss, supple leathery texture, pimpled surface, seed size is Medium to large, conical with pointed apex, early maturing with pale yellow flesh, 75–77% recovery, excellent quality with flavoursome, nutty after-taste, good on-tree storage, but short shelf-life when ripe. The chemical composition of avocado depends on the cultivar and stage of ripening [6]. In Egypt, “Fuerte” is harvested all year round but its’ main season is from October to December. Main problems facing avocado plantations are slow to reach production, low yields in cooler climates with a marked tendency for erratic cropping and sensitivity to low temperatures during flowering and fruit set [7].
Nitrogen seems to be the most important element in avocado nutrition. Deficiencies of nitrogen in avocado result in small, pale leaves, early leaf drop, and smaller and fewer fruits [8]. In addition, nitrogen deficient trees were found to be more susceptible to frost damage [9]. Boron is essential for pollen germination, for successful growth of the pollen tube through the stigma, style and ovary to the ovule [10]. On worldwide basis zinc (Zn) is a very critical microelement because the avocado is very susceptible to their deficiency. Symptoms of Zn deficiency are observed in acid soils from which it is easily leached at a low pH and in calcareous soils in which it is fixed in unavailable forms. Early deficiency symptoms are mottled, narrow, disproportionately small leaves at the terminals, usually light green or chlorotic in color. Leaf margins are necrotic, and internodes are shortened in advanced cases [11].
Numerous fertilization regimes were proposed by several scientists to overcome cropping problems [12] studied the effect of nitrogen fertilizer application times and rates on “Hass” avocado to increase total yield without reducing fruit size and found that application time proved to be an important determinant of total yield lower annual N would reduce fertilizer expense and protect the environment. Boron sprays applied either during fall or spring on trees not deficient in boron (based on leaf analyses) have been effective in increasing fruit set in a number of deciduous tree fruit, nut crops and in avocado [13]. [14] on avocado trees proved that B and Zn were significantly improved pollen germination; fruit set number as well as yield per tree and increased fruit weight, length and breadth of fruits. They showed that the combination of B+Zn had positive synergistic effect and gave the highest values in the tested parameters. According to [15] Zn level at (0.5 %) improved fruit set wheras levels (0.25, 0.5 %) were more effective on fruit drop number and enhanced production of piryform fruits with more elongation. The scope of the present study was to illustrate the impact of nitrogen fertilization regimes with or without foliar sprays of both zinc and boron on the performance of Fuerte avocado trees.
Materials and Methods
This investigation was carried out through the two successive seasons of 2015 and 2016 on 20-year-old avocado trees (Persea Americana, Mill.) “Fuerte” cultivar grown in the experimental orchard of the Horticulture Research Station located in El-Qanater El-Khayreia, Qalubia Governorate, Egypt. Trees were planted at 7x7 meters (86 trees/ feddan (. One hundred and fifty Feurte cultivar trees grafted on Dayouk rootstock were chosen for this study. The chosen trees for the investigation were uniform in their vigor, size, shape and disease free, grown on loamy clay soil and irrigated with a farrow (surface) irrigation system. Trees were subjected to normal cultural practices recommended by the Ministry of Agriculture except for the treatments of this investigation. Experimental design followed the complete randomized block design. The following regimes were conducted each on three separate trees (each acting as a replicate).
Considered fertilization regimes
Nitrogen fertilization regimes: All trees used in this investigation were fertilized by broadcast with 1200 gm N as the recommendation of ministry of Agriculture (the fertilizer ammonium sulfate 20% N was used). Five regimes were considered based on percentage and time of application. The considered regimes were:
N1: Control as farm’s regime. Fertilizer was split into 3 doses i.e. November 400 g/tree (33.3%), 400 g/tree (33.3%) in January and 400 g/tree (33.3%) in May.
N2: Fertilizer was split into 3 doses 240g/tree (20%) in (January), 600 g/tree (50%) in (May) and 360 g/tree (30%) in (August).
N3: 600 g/tree (50%) in (January), 360 g/tree (30%) in (May) and 240 g/tree (20%) in (August).
N4: 600 g/tree (50%) in (January) and 600 g/tree (50%) in (May).
N5: 600 g/tree (50%) in (May) and 600 g/ tree (50%) in (August).
Boron and zinc regimes
B: boron the product boron sulphate (17. 5% B) was used in three concentrations (1, 2, 3 g/L) / tree i.e. (175, 350, 525 ppm) respectively as B1, B2 and B3.
Zn: zinc the product zinc sulphate (34.5% Zn) was used in the same concentrations (1, 2, 3 g/L) / tree (345, 690, 1035 ppm) respectively as Zn1, Zn2 and Zn3.
B+Zn: combination between them as (B1+Zn1, B2+Zn2 and B3+Zn3) in (1, 2, 3 g/L) / tree.
Treatments were sprayed with a mechanical sprayer until runoff each for three times, the first at the beginning of flower bud induction in (October), the second spray was at bud burst during (January) and the last and third one was at anthesis in (April). Fifty treatments were performed each on 3 separate trees as follows: N1, N1+B1, N1+B2, N1+B3, N1+Zn1, N1+Zn2, N1+Zn3, N1+B1+ Zn1, N1+B2+ Zn2 and N1+B3+ Zn3 and the same way with the treatments N2, N3, N4 and N5.
The following parameters were assessed to evaluate the comparative effects of the conducted treatments.
a) Pollen grains germination percentage
Five inflorescences were chosen randomly on each of the considered trees to assess comparative effects of conducted treatments on this parameter and the fruiting parameters. Pollen germination (%), Pollen grains were collected during anthesis stage. Flower in the male stage of the reproductive cycle were collected in paper bags then transferred to the laboratory. After anther dehiscence when pollen shed they were collected and incubated in Petri dishes on a medium containing 15% sucrose and 0.8% agar according to [16]. Pollen germination was recorded after 6 hours as the percentage of germinated pollen in a total of 500 grains from different areas of plat. Each pollen sample was replicated three times. Pollen was considered to have germinated if pollen tube length was at least twice as long as the diameters of grain, samples were observed by Optical microscope.
b) Yielding Parameters
In both seasons, fruit set was determined by marking five flowering branch ends around the circumference of each treated trees two weeks after full bloom and fruit set percentage was calculated. On the last week of August just at harvest time the number of fruit/ branches was counted to estimate the final fruit set (number of fruits per branch/number of initial flowers *100). At harvest, fruits of each tree were picked, counted and weighed with a digital balance in Kgs. The yield (Kg) was determined as total number of fruit / tree *Average fruit weight (gm)/1000).
c) Fruit quality Parameters
Mature Fuerte fruits were harvested at the 3rd week of September maturity according to [17]. Samples of five representing fruits from each considered tree are harvested, cleaned packed in carton boxes in one layer and transferred to laboratory then both of physical and chemical parameters were assessed.
i. Physical Parameters
The following parameters were determined: fruit weight (g) and flesh weight (g) by using a digital balance.
ii. Chemical Parameters
Free fatty acids were determined by comparison of retention time of the gas chromatographic peaks with these of commercial free fatty acid methyl ester standards, then automatically computed as a percentage by the data processor (Chrom card) from the ratio of individual peak area to the total peaks area of fatty acids. Vitamin C as mg ascorbic acid/100 gm fruit weight was determined and estimated/ 100 ml fruit juice, according to [18].
d) Statistical design and data analysis
Experimental design followed the complete randomized block design. The obtained data was subjected to factorial analysis according to [19]. Attained means were compared by using New LSD method at 5%.
Results and Discussion
Fruit set parameters
Table 1: Effect of nitrogen soil application time, boron and zinc foliar spraying on pollen germination percentage per tree.
Pollen grains germination (%): Data presented in Table 1 showed that pollen germination percentage significantly varied with adopt treatments. With respect to nitrogen regimes, on the average the highest significant percentage attained was dedicated to (N2) treatment amounting to (77.36 &77.74 %) for both seasons respectively whereas, the significantly the lowest percentage was due to (N1) treatment (control) amounting to (59.04 & 59.23 %) for both seasons respectively. With respect to the foliar spray treatments on the average the applied treatments increased this parameter in the first season significantly compared with control except for (B3, Zn3 & B3+Zn3) treatments whose effects were statistically equal to control. In the second season however, treatments (B1, Zn2, Zn3 & B3+Zn3) did not induce any significant effect compared with control. The other treatments resulted in significantly higher percentages. Highest significant germination percentage was attributed to (B1+Zn1) treatment in both seasons amounting to (76.59 & 77.55 %) in both seasons respectively.
Interaction between the two main factors was significant. The highest values of pollen germination percentage (84.33 & 86.13 %) and (84.50 & 84.17 %) in both of seasons respectively were dedicated to (N2+ B1+ Zn1) and (N3+ B1+ Zn1). While the lowest percentage (553.57 & 55.27%) were due to (N1) and (N1+B3) treatments respectively in the first season. While in the 2nd season they were (53.27 & 54.63%) for both with (N1+Zn3) and (N1+B3) respectively. The obtained results are in line with the finding of [20] who proved that effect of combination of these nutrients positively affected pollen germination. [21] reported that boron plays an important role in pollen germination and pollen tube growth.
Fruit set (%): Table 2 showed that the on the average the applied nitrogen regimes in the both seasons were more effective significantly than control with (N1) which resulted in the lowest percentages (50.183 & 50.08 %) respectively whereas, (N2) treatment recorded the highest significant percentage (54.59 & 55.69 %) for both seasons respectively. With respect to foliar treatments, on the average their effects varied. Highest significant percentage in both seasons were attributed to B1Zn1 in both seasons amounting to 55.39 & 57.36 respectively and B1 treatment in the first season (53.94%) while (B3+Zn3) and (Zn3) recorded the lowest values (50.75 & 49.87 %) and (49.87 & 49.77 %) for both seasons respectively.
Table 2: Effect of nitrogen soil application time, boron and zinc foliar spraying on fruit set percentage per tree.
Furthermore, interaction between nitrogen soil application regimes and boron and zinc foliar spraying application during both seasons was significant. Data showed that the combined (N2+B1+Zn1) induced the highest fruit set percentage amounting to (57.2 & 60.37 %) in both seasons respectively. These findings are in agreement with [22] who found that increase in fruit set due to boron might be attributed to its role in maintaining high pollen viability and germination. also, it seems that the improvement in fruit set percentage could be explained as a result of increase pollen tube elongation due to boron treatments [23]. [24] on date palm found that (N, P, K and Zn) spray application can improve fruit set, yield and fruit size without thinning. In addition, zinc is involved in protein synthesis, influence on electron transfer reaction including those in the Kreb’s cycle and subsequently on energy production in the plant and also directly involved in the synthesis of indole acetic acid [11].
Yield (Kg)/tree: It is obvious from data in Table 3 that in both seasons of study on the average yield significantly varied in response to nitrogen soil application regimes. The highest significant yield (106.60 & 107.33 kg) in both seasons respectively was attributed to (N2), while significantly the lowest yield (74.49 & 75.42 kg) was obtained from (N1) treatment as control in both of seasons. On the other hand, yield of avocado varied on the average due to foliar treatments. Supreme crop was attributed to the (B1+Zn1) treatment in both seasons (102.66 & 104.59 kg). Whereas both (Zn3) and (B3+Zn3) resulted in statistically the least crop in both seasons amounting to (87.82 & 89.01 kg) and (82.58 & 84.71 kg) respectively.
Table 3: Effect of nitrogen soil application time, boron and zinc foliar spraying on fruit weight (g) /tree.
Interaction between the studied factors was statistically significant which referred to that nitrogen soil application and boron, zinc foliar spraying act dependently in this concern. The highest yield (113.9 & 116.1 kg) was attributed to from (N2+B1+Zn1) treatment in both seasons respectively, while the lowest yield (69.2 & 64.4 kg) and (68.1 & 65.7 kg) were obtained from (N1+B3+ Zn3) and (Zn3 treated in both seasons, respectively. Enhancements in crop due to the afore mentioned treatments are basically due to their effects on increasing both the pollen grain germination percentage and fruit set percentage .The available reports concerning the effect of nitrogen application time, boron and zinc foliar spraying on avocado yield are in agreement with the results of [14] on avocado and [15] on guava, they found that foliar sprays either boron or zinc increased tree yield.
Physical fruit parameters
Table 4: Effect of nitrogen soil application time, boron and zinc foliar spraying on flesh weight (g)/tree.
Fruit weight (g): Table 4 indicated that in both of seasons on the average all considered N regimes significantly increased the average fruit weight than control. Highest significant effect was due to (N2) treatment (298.9 & 306.6 g). While, (N1) control showed the lowest values (262.5 & 264.4 g) for both seasons respectively. With regards to boron and zinc foliar spraying treatments on the average, (B1+Zn1) induced the highest significant fruit weight in both seasons (286.7 & 305.5 g) respectively. While both (Zn3) and (B3+Zn3) treatments showed statistically the lowest values (268.0 & 266.1 g) and (262.3 & 259.4 g) respectively. On other hand, interaction between nitrogen soil application and foliar spraying of boron and zinc was significant. Data cleared that fruit weight also attained significantly the highest magnitude due to. (N2+B1+Zn1) treatment resulted (308.2 & 349.0 g) respectively in both tested seasons. Whereas control (N1) in both seasons with (Zn3) and (B3+Zn3) treatments induced the least fruit weight (255.3 & 250.0 g) and (255.5 & 253.3 g). These results are in general concurrence with [25] and [26,27].
Flesh weight (g): Data in Table 5 showed that flesh weight was significantly affected by applied nitrogen regimes on the average. Significantly the heaviest flesh weight was attributed to (N2) treatment (249.0 & 256.7 g). Whereas, control in both seasons and (N5) treatment in the second one showed the lowest flesh weighted. Concerning boron and zinc foliar spraying treatments, on the average significantly the heaviest flesh weight recorded was (244.3 & 264.7 g) was due to (B1+Zn1). Whereas, (B3+Zn3) in both seasons (206.1 & 195.9 g) and (Zn3) (208.5 g) in the first season showed significantly the lowest values. Interaction between the two main factors was significant. The highest magnitude of flesh weight in both of seasons was dedicated to (N2+ B1+Zn1). The obtained results are in line with the finding of (Kumar and Verma 2004) on lichi.
Table 5: Effect of nitrogen soil application time, boron and zinc foliar spraying on flesh weight (g)/tree.
Chemical fruit characters
Oil content (%): Oil content as affected by conducted treatments is presented in Table 6. Data showed that on the average (N2) treatment resulted in the highest significant oil content (15.70 & 15.85 %) for both considered seasons respectively. On the contrary showed (N1) induced significantly the lowest content amounting to (15.05 & 15.08 %) for both seasons respectively with insignificant differences from (N5). As for average effect of foliar treatments, (B1+N1) treatment showed the highest significant oil content amounting to (15.79 & 15.87 %) for both seasons respectively. Whereas, unsprayed trees bore fruits with significantly the lowest oil content (14.96 & 15.04 %) for both considered seasons respectively). Differences from (Zn3) treatment were insignificant. Interaction data were significant. Data showed that highest oil content was attributed to (N2+B1+Zn1) and (N2+ B2+Zn2) treatments with insignificant differences between them. While the lowest content was attributed to N1& no spray treatment in both seasons. These results are in no agreement with those of [15] who illustrated that there was no significant different were observed in fat percentage, however this result in the line with agree with [28] and [29].
Table 6: Effect of nitrogen soil application time, boron and zinc foliar spraying on oil content percentage.
Vitamin C (mg/100g): It’s obvious from Table 7 that (N2) recorded the highest fruit vitamin C content in both of seasons (10.75 & 10.36 mg/100g). Whereas, (N5) treatment showed the lowest magnitudes. As for the average effects of spraying treatment, as (B1+Zn1) was the most effective treatment in this respect in vitamin C with values (10.88 & 10.69 %) respectively compared with the combination of boron and zinc at 3 g/L treatment. The combination of boron and zinc at 1g/L and nitrogen application time treatment (N2) as (N2+B1+Zn1) increased vitamin C fruit content (mg/100g) in both seasons (11.63 & 11.13), while the treatment (N5) with boron and zinc combination in concentration 3g/L as (N5+B3+Zn3) showed the lower values in both seasons with (9.33 and 8.56) respectively. [30] reported that B and Zn sprays enhanced ascorbic acid content in guava.
Table 7: Effect of nitrogen soil application time, boron and zinc foliar spraying on vitamin C (mg/100g).
In Conclusion the Present Study Clearly
Illustrate that nitrogen fertilization regimes clearly affect the cropping and its’ attributes in avocados. also, for foliar application of boron and zinc in combination, it showed clear enhancements in terms of increasing pollen grains germination percentage leading to increasing the crop. Also, their application showed enhancements in crop physical and chemical characteristics [31-33].
As a Recommendation
It is preferable to fertilize avocado trees cv. Feurte with nitrogen at 240g/tree during (January), 600g/tree during (May) and 360 g/ tree during (August) combined with 3 foliar application of boron and zinc at 1g/L at for three times, the first at the beginning of flower bud induction in (October), the second spray at bud burst during (January) and the last and third one was at anthesis in (April).
For more Agriculture Open Access Journal articles Please Click Here:
https://publons.com/publisher/7295/lupine-publishers-llc
0 notes
Text

Resurrection Day!!! Easter is the time to rejoice and be thankful for the gift of life , love and joy. Have a Blessed Day from our Lupine Family
0 notes
Text
Lupine Publishers | Dimethyl ether as Zero Emission Fuel-Synergies with Biogas and Biomass Plants

Introduction
In Iceland a methanol plant named in honour of the noble prize laureate [1] operating since 2011. As substrate they use carbon dioxide and hydrogen producing methanol. Methanol is the simplest alcohol and well know since the developments of Paul Sabatier and the catalysis processes [2], in liquid phase at environment pressure and temperature, and is a synthetic alcohol. In the Georg Olah Plant [3] carbon dioxide and hydrogen are mixed 1mol:3mol together to form a syngas, being compressed and transformed under the help of catalysts to methanol (methanol synthesis).
.
In most processes the methanol synthesis is running at a pressure range 30 bar up to 100bar and a temperature range 200 °C up to 400 °C. The conversion rate is given in the range of 25% up to 35% and therefor recycling of the unconverted gas in the methanol reactor back, to increase the conversion rate of synthetic gas and production rate. Leaving the methanol reactor, the product gas will be cooled down andthe condensate mixture of water and methanol is distilled and separated into water and product methanol. The methanol synthesis with carbon dioxide hydrogen is needed, generated by wet electrolysis.
Figure 1: Methanol and Dimethyl ether from carbon dioxide and water.
From water and the electric power needed for the electrolysis is generated by geothermal heat conversion to electricity (Figure 1). This is a special property of Iceland. Now the question arises, where does the carbon dioxide come from? In the most common case. Carbon dioxide is separated from exhaust gas from fossil fuelled power plants and industrial processes. Using fossil carbon dioxide in plant process the George Olah plant [3] is now accelerating the consumption of fossil fuels if we use methanol as a fuel. Therefor methanol should be used in chemical industry fixing carbon dioxide [1]. But if we use methanol as fuel in transportation, the combustion of methanol leads to carbon dioxide and water being transferred to normally carbon dioxide transferred to the environment is a dilution of carbon dioxide in the air. We watch that methanol burned in a classical Otto motor cycle additional produces compared to fossil diesel fuel in a diesel engine higher pollution, dust, soot and a higher amount of carbon dioxide in the exhaust gas. Therefor methanol is converted to dimethyl ether by extraction of water under acid conditions [4,5].
Dimethyl ether is often mentioned as the ideal Diesel fuel [8], tested over long years from VOLVO [6] and by MACK TRUCK [7] in heavy trucks on the road. Dimethyl ether is the simplest ether a synthetic fuel, certificated by the ISO 16 681:2013 by the IDA, produced from methanol or by direct synthesis (Figure 2).
Figure 2: Mack truck testing Dimethyl ether.
In most cases there is no application of methanol in transport, civil, agriculture and forestry, because they are running on fossil diesel. Heavy strong robust power machines are needed and the diesel engine is the ideal power machine. Methanol cannot substitute fossil diesel directly. But dimethyl ether has this needed property. As shown from MACK TRUCK (New York) [7] testing Dimethyl ether in heavy trucks [7]. Since VOLVO (Sweden) [6] started in using Dimethyl ether in heavy trucks in 2008, running over five years the trucks on the road (Figure 3), and moved then to the USA at MACK TRUCK [7], it is well known that dimethyl ether is a story of success and dimethyl ether is the ideal Diesel fuel [6,7].
Figure 3: VOLVO heavy truck running on Dimethyl ether.
Ethanol, Biodiesel
Using corn from agriculture bioethanol is produced with fermentation. Corn is a food product not agricultural waste. Bioethanol has the same combustion and emission problem as methanol: it can only be used in a gasoline engine and leads to higher pollution, lower efficiency, soot dust, and high carbon dioxide than dimethyl ether. In Europe biodiesel is mixed with fossil diesel. Biodiesel is produced from oil and fatties over catalytic esterification, but again biodiesel has the same combustion problem as methanol: although biodiesel can be used in diesel engines, biodiesel leads to higher pollution, lower efficiency, soot dust, and high carbon dioxide than dimethyl ether [6].
Biogas
The anaerobic fermentation process enables to produce biogas, consisting of methane and carbon dioxide (CH4, CO2). Biogas can be produced from wet biogenic waste. The anaerobic process can be realized in wet phases or in dry phases but always lead to biogas and digestate, which can be recycled again. In most application biogas is used to generate electricity and heat. The electric efficiency of biogas engines is 30% up to 36%, and we have an exhaust gas, therefore no zero emission.
Forestry biomass
In Forestry wood is used for pulp and paper and for wood in civil and industry. Generating heat from wood chips with a warm water boiler is well known. In the most application biomass is used to generate heat. The thermal efficiency is low 75% up to 85%, and we have an exhaust gas and again no zero emission.
Reforming and gasification for dimethyl ether
Dimethyl ether can be produced from biogas and biomass. Biomass as waste biogenic mass can be used for gasification to generate synthetic gas and char coal. The char coal is carbon, the synthetic gas consists of CO:23%, H2:20%, CH:1%, O2 <0.1%, CxHy: 3%, Rest CO2. The heat caloric value is about 1.5kWh/m³. Charcoal can be reused again and converted to syngas over the known water gas reaction
Biogas can be used to generate synthetic gas with dry reforming:
The synthetic gas consists of CO:40%, H2:40%, CH:3%, O2< 0.1%, CxHy: 1%, Rest CO2. The heat caloric value is about 2.5kWh/ m³. In both cases syngas can be transformed to dimethyl ether over direct synthesis: 3CO + 3H2CH3OCH3 + CO2 + Q (- 254kJ/mol).
Hydrogen
Figure 4: Dimethyl ether and SOFC Cycle.
Cheap hydrogen is the basic requirement for the production of cheap and competitive dimethyl ether from methanol (Figure 4). Hydrogen from electrolysis costs electric power ~5.0 kWh/m³ H2. Hydrogen generated from waste heat, enables to split water into hydrogen and oxygen with metals at temperatures from 400 °C up to 800 °C:
SOFC or thermionic and magneto hydrodynamic Generator Using dimethyl ether in a SOFC (solid oxide fuel cell) cell dimethyl ether has to be converted to syngas by steam reforming
The exhaust gas from the SOFC cell consists of carbon dioxide and steam.
SOFC cells operate in a temperature range 800 °C up to 1000 °C, at nearly environment pressure and have an electric efficiency of 50% up to 60%. Another possibility is to generate heat with combustion of dimethyl ether in a metal oxide reactor.
The generated heat can be direct converted to electric energy with a thermionic generator. Thermionic generators have an electric efficiency from 25% up to 35%, combined with magneto hydrodynamic generators having an electric efficiency from 30% up to 40%, we gain in sum from 55% up to 75% for the direct conversion of heat to electric energy (Figure 5). In both applications we oxidize dimethyl ether to carbon dioxide and water under pressure up to 50 bars.
Do that the exhaust gas consisting of carbon dioxide and steam can be collected as condensate in different tanks. This enables carbon dioxide and water to be reused in such plants like the George Olah Plant [3] and Oberon plant [4] again. The step of collecting carbon dioxide and water is the closure of the methanol over the dimethyl ether processes. It is now a closed cycle collecting carbon dioxide in a tank wo be recycled to methanol and dimethyl ether process again. This closed cycle now reduces the emission of greenhouse gas like carbon dioxide and can be seen as a sustainable property of the carbon dioxide recycling. Carbon dioxide now is a substrate and a basic part in the fuel production and not a pollution in the exhaust gas anymore. Under this conditions carbon dioxide and the emission certificates connected to carbon dioxide can be used in a global trade [8].
Figure 5: Dimethyl ether and high temperature heat generation.
Closing the cycle
To reach zero emission we must convert Dimethyl ether into carbon dioxide and water. Carbon dioxide and water can be converted back (recycled) to dimethyl ether with electric energy and heat. Under this cycle we generate only this amount of carbon dioxide, connected with dimethyl ether. Using more dimethyl ether enables to reuse more carbon dioxide and the process is acting like a carbon dioxide sink. Focusing on this property of zero emission enables to save energy and substrate in agriculture and forestry, in civil and transportation (Figure 6). Using waste from agriculture and forestry, using biogenic waste from hotels, food industry and biogenic waste from municipal and civil waste, reduces the pressure on new and fresh biomass, reduces the pressure on fossil substrates. Under the property of zero emission the methanol cycle of the George Olah plant [3] will be renewable and also the dimethyl ether plants of Oberon [4,9].
Figure 6: Dimethyl ether closed cycle.
For more Agriculture Open Access Journal articles Please Click Here:
https://www.lupinepublishers.com/agriculture-journal/Lupine Publishers
0 notes
Text
Lupine Publishers | Biogas and Dimethyl Ether are Providing Water, Fertilizer for an Intelligent Smart Soil
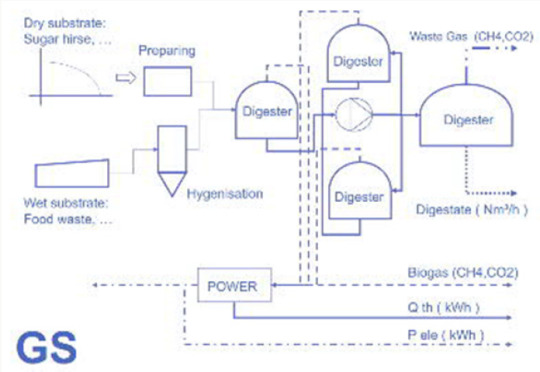
Short Communication
Biogas is well known in agriculture and food industry. In Austria we realized a project Hagenbrunn [1] nearby Vienna/ Austria, a biogas plant running on waste food and liquid biogenic waste. The electric power output is given with 1320kW ele, the thermal heat generation is given with 1800kW thermal heat realized with warm water (95 °C/60 °C), the substrate feed is given with 25, 000t/year, and the digestate coming out of the biogas plant is 35000t/year. The biogas generation of the different substrates, like waste food, grass, potatoes (e.g.) is done by measurements, testing and calculation and leads to the biogas generated by fermentation in a range of 700Nm³/h up to 800Nm³/h, with a methane concentration of 50% up to 65%. The biogas plant Hagenbrunn [1] has a deep influence on the way of irrigation, the way of fertilizing in agriculture and vine culture. The biogas plant Hagenbrunn [1] has a deep influence on the regional jobs, the regional companies, it is acting like a knot and center of competence and initiating a lot of spin offs. The main advantage of the biogas plant is using biogenic waste as input substrate and therefore the communities are glad to have a sink using and converting waste food and liquid biogenic waste to biogas. Biogas from the plant is only an intermediate step. In the first realization step biogas is converted to electricity and heat.
In the next realization step the biogas plant was enlarged with a preparation of the digestate, to distilled water, solid particles and fertilizer, and the gasification of biogenic solids and the conversion of syngas from gasification of the biogenic solids, biogas from the biogas plant, and the waste biogas from the closed digestate tank to generate syngas with steam gasification and producing dimethyl ether. Dimethyl ether is stored in two tanks, with a volume of 30,000liters, and a filling station of mobile movable bottles substituting LPG by Dimethyl ether. Heavy tank trucks are transporting Dimethyl ether to the clients. The production of dimethyl ether in Hagenbrunn [1] is given by 800L/h, using 10,000t/ year biogenic solids, 80,000m³/h waste gas (CH4=5%, CO2=95%) from the digestate tank of the Biogas plant, and 400m³/h biogas (CH4=50%,CO2=50%) from the biogas plant. Additional heat from the CHP engine is used for drying the solids biomass to a moisture lower than 10%. The electric power needed for the production of dimethyl ether, for the drying process, and the generation of fertilizer and water from digestate is produced by the gasification plant. Now the Biogas plant now can convert liquid biogenic waste and solid biogenic waste and can so take over the waste from the region.
.
Biogas plant
A biogas plant consists of substrate storage for at least a six months operation (Figure 1), buffering the different mass flow of substrate during the operation of a year. Additional we have a preparation of the substrates increasing the surface, and to prepare for the fermentation in the digester. Because of the wet process we have to mix the substrate with the fluid circulating in the plant between the digester by a pump (often called central pump). For the biogas process we have to understand biogas processes operating on waste, like food waste, manure, and substrates like corn, maize, beet. The process ends with a digester and the with a storage of the digestate (end product of the fermentation process). In input substrate is defined by the gas production of the fresh mass (measured, tested or calculated by formulas (Brick, Schumann)), the anaerobic fermentation process, and at the end to get back the digestate. The biogas resulting form the digester is collected and burned in a CHP engine to produce electricity and heat. But nobody needs electricity and heat, additional the earn of electricity and heat is very small, the economic situation becomes very bad. To get a feeling about the dimension, area, input, output, efficiency we have: electric power output: P=500kW ele, input feed: 17,500 t/year wet fresh substrate, output 15500 t/a digestate, generated heat Q(th)= 700kW th, generated biogas 300Nm³/h (50% CH4, 50% CO2), the agricultural area needed for supporting the biogas plant with waste is at least needed with 200 ha area. The area needed for the biogas plant itself is about 1 ha. With this correlation we plan and design the water consumption, water storage, fertilizer and soil needed. Additional the digestate resting in a tank is producing waste biogas (5% CH4, 95% CO2) with 40,000m³/year.
Figure 1: Biogas Plant.
Dimethyl ether
Dimethyl ether is well known. It is the simplest ether consisting of two carbon atoms, one oxygen atom and six hydrogen atom, molar mass MZ~ 46g/mol [2]. It is certificated by ISO 16 681: 2013 by the IDA. At a pressure of 6 bar Dimethyl ether is in liquid phase at an environment temperature of 25 °C [2] The simplest ether is synthetic and can produced with two pathways: the production in two steps in the first step over the intermediate product methanol (methanol synthesis) CO+ 2H2 ⟶ CH3OH+Q (-225 kJ/mol) and in the second step over dehydration (water removal) 2CH3OH ⟶CH3 OCH3 + H2O + Q (-15kJ/mol), or in the direct synthesis in one step 3CO+3H2⟶CH3OCH3+CO2+Q (-254 kJ/mol). The difference between both chemical processes is the energy (heat generated and needed) the resulting mass flows generated by the processes. The caloric heat value of dimethyl ether is given caloric combustion enthalpy Hc=1460kJ/mol [2], the formation standard formation enthalpy Hf =184 kJ/mol [2]. The combustion of dimethyl ether in diesel engines leads to nearly no soot, dust, a reduction of carbon monoxide and nitrogen oxide [3].
Figure 2: Biogas Plant and reformer for syngas.
Biogas to dimethyl ether
The convertion of biogas to dimethyl ether can be done in two pathways. One pathway is steam reforming of biogas, which leads to a snygas consisting of carbon monoxide and hydrogen and carbon dioxide (SR=steam reforming reaction) (Figure 2). CH4+H2 O⟶CO+3H2+Q (+316kJ/mol), or in combination with more steam (WGS = Water gas shift reaction) to carbon dioxide and hydrogen CH4+2H2O⟶CO2+4H2+Q (+ 161kJ/mol) (Figure 3). The second pathway is dry reforming of biogas to carbon monoxide and hydrogen CH4+CO2⟶2CO+2H2+Q (+251kJ/mol) [1]. In processes we need heat, generated from the biogas itself CH4+2O2⟶CO2+H2O+Q (-574kJ/mol). The gained syngas is then converted to dimethyl ether. The standard process of convertion of syngas to dimethyl ether consist of a gas compression up to 50 bar till to 100 bar, the reduction of carbon dioxide by cooling down the syngas and condensation of carbon dioxide and storing in a tank, the convertion of the syngas to methanol in one reactor, with recycling of the unconverted syngas and condensation of water and methanol mixture [1]. The condensate mixture is separated with distillation into process water and methanol. The methanol is dehydrated to dimethyl ether and the condensate mixture of dimethylether, water is separated with distillation into process water and dimethyl ether.2CH3OH ⟶ CH3OCH3+H2O+Q (-15 kJ/mol) [1].
Figure 3: Biogas Cleaning and syngas reformer.
Combination of processes
Figure 4 to increase the efficiency of a biogas plant the biogas plant is combined with a gasification plant. Such as gasification plant is realized in the project Traismauer in Austria [4]. The gasification plant converts solid biomass to weak gas mainly consisting of CO=20%, H2=23%, CH4=1%, CxHy=3%, Rest CO2, with a heat caloric value Hu~2.2kJ/m³, tar< 5mg/Nm³, dust < 5mg/Nm³ which is used to generate with a CHP engine (combined heat process) electricity and heat. Syngas from the gasification and char coal are converted with steam gasification to syngas with a steam reformer operating at nearly environment pressure and a temperature of 800 °C up to 1000 °C. The syngas composition is given by CO=30%, H2=30%, CH4=1%, CxHy=3% and the rest is CO2, with a heat caloric value Hu~2.8 kJ/m³. In the project Hagenbrunn [1] we combined the biogas plant with a gasification plant as done in the project Traismauer [2]. We call this gasification the bottom cycle producing weak gas with a caloric heat value Hu~2.2 kWh/ Nm³ (Figure 5). To generate the needed heat for steam (hv=2560kJ/ kg) and to superheat steam up to 800 °C till 1000 °C, we need a combustion chamber, in which the weak gas of the gasification plant is burned with oxygen to carbon dioxide and steam. Additional we use the biogas from the biogas plant in the steam gasifier and fine milled biomass mixed with char coal from the biomass gasifier. CH4+H2O⟶CO +3H2+Q (+206kJ/mol), C+H2O⟶CO+H2+Q (+145kJ/ mol). A very interesting property is given by using carbon dioxide in steam gasification C+CO2 ⟶2CO+Q (+180kJ/mol). The syngas has now a composition by CO=40%, H2=40%, CH4=1%, CxHy=3% and the rest is CO2 with a heat caloric value Hu~3.5kJ/m³, tar<0.5mg/ Nm³, dust<1mg/Nm³. This syngas is converted to dimethyl ether. From the CHP plant we generate the electric energy and heat needed in the enlarged biogas plant to run all processes.
Figure 4: Gasification plant and syngas reformer.+
Figure 5: Biogas Plant combined with a gasification plant and syngas reformer.
Intelligent smart soil
One of the main and central (Figure 6) parts of the project Hagenbrunn [1] is the conversion of the digestate into solids, water and fertilizer. The disadvantage for a classical Biogas plant, we need electric power and heat. In the project Hagenbrunn [1] we need P=150kW ele and Q=800kW thermal power for digestate 35,000 t/year. This is not efficient for a classical Biogas plant. Therefore we need additional heat and electric power and we need a high valued product like dimethyl ether to reach an energetic and financial efficiency to be worth for investment (Figure 7). First let have a look on the digestate from the Biogas Plant [1]. The digestate consist of metalöls like Cadmium, Chrome, Copper, Lead, Nickel, Mercury, Zinc, Arsenic, Cobalt, resulting from food itself. Under solid parts we understand organic particles and fibers coming out of the fermentation process, consisting of lignin, cellulose, hemi cellulose and poly sugars (called the TS=dry substance). Then we have the fertilizer parts like Ammonia, Phosphates, Calcium oxide, Potassium oxide, Magnesium oxide, Natrium oxide, Sulfates, Chlorides, Nitrates. The preparation process for the digestate is divided into two steps: the mechanical step, and the refining step of the liquid fertilizer.
Figure 6: Biogas Plant and up scaling digestate conversion.
Figure 7: Content of dig estate -Biogas Plant [3].
The first step is a mechanical separation of the solids out of the digestate. The digestate consists normally of 90% water, 3% up to 5% solid particles and 5% fertilizer solved in water. After the mechanical separation done with a sieve separator we use a fine sieve again to prepare the liquid digestate for filtration by membranes. The solid water mixture is like slurry is recycled in a water plant. The filtration process is closed with a membrane process, the ultra filtration stage (d~1μm) to clear and separate the collides from the digestate. Now we have reached a clear liquid fluid with solved minerals, oxides, carbonates, phosphates and sulfates. This is the first stage of usable for droplet irrigation. The advantage for this first stage: it is easy to reach, the electric power needed is P~50kW/Nm³ is very small. The disadvantage is we cannot influence the concentration of the solved minerals, oxides, carbonates, phosphates and sulfates itself. The clarified digestate from the first stage can be easily used for droplet irrigation, which saves more than 50% of water consumption. The needed electricity and energy is gained from the gasification plant and from dimethyl ether, which can be used as fuel for the diesel engine driven pumps transporting the water in the pipe lines on site outside the Biogas plant. So we save energy, we save water consumption and we have the possibility of installation of doplet irrigation. Those parameters are very interesting for investors and communities and companies in agriculture and food and wine industry forced to save costs, water and fertilizer. There is no need of continuing the wasting water by inefficient water irrigation and also the costs for synthetic fertilizer can be reduced.
In the second step we take now the liquid fertilizer and separate the water. We use the Nano filtration (d~0.01μm) to reach a high concentration of the solved minerals, oxides, carbonates, phosphates and sulfates, stored in a tank. Now we are in the position to dilute the high concentrate with water according to the demands of the clients. In the project Hagenbrunn [1] we also developed a step further. We are in close contact with the client and measure the moisture of the soil; we measure minerals, oxides, carbonates, phosphates and sulfates in the soil [3]. Although the biogenic plants, like a vine culture, are intelligent by it and can organize and influence the microbes by chemical substances in the soil, we now can support the plant culture with water, minerals, oxides, carbonates, phosphates and sulfates according to the measurements and the need. What do we understand under need: we measure the quality of the grapes, corn, fruits in the different growing state itself, depending on the temperatures, solar environment, and with this data we are now in the position to close the controlling cycle: the measurement of the actual state of the culture pant, the quality to be reached and the need on water, minerals, fertilizer. This all is realized in a digital process system and visualization for steady local watching and controlling. The realization of this project enables us to get a deep inside look into the structure and behavior of the soil and the growth of the plant and enables us to optimize and to increase the growth efficiency.
Closure
In the project Hagenbrunn [1] we have shown that a Biogas plant can be enlarged with a gasification [4] to generate electricity and heat, to support the production of dimethyl ether [5] and to prepare and separate the digestate from the Biogas Plant into distilled water and fertilizer [1]. Under these conditions dimethyl ether becomes a smart rural fuel with an impact on transportation, on water supply and consumption in agriculture and food industry and in the consumption of fertilizers. Additional the Biogas Plant is now converting to a center of competence influencing the regional companies and jobs and as a hot spot it is a part of a network. If we now spread of a region Biogas plants with a power of 5MW we cover up an agricultural area of 2000 ha up to 3000 ha. With Biogas Plants in the power range of 5MW up to 50 MW we can cover up a region of 2,000,000 ha agricultural area. With this network of Biogas Plant as hot spots in the region we can lower the water consumption, we can dramatically increase the production of dimethyl ether as a fossil Diesel substitute and we can reduce the synthetic fertilizer consumption. Additional we increase the jobs in the region and we supply. Biogas Plants costs investment, but the financial investment for private investors is much smaller than the investment of a congress or community in water pipe lines. Over a period of 15 years we develop the region sustainable and as an add on we save the environment. But this is not important for an investor looking for a low risk investment, and for opportunities in future. But the network of Biogas plant is not working against itself; the Biogas Plants are supporting the network, are supporting each other and therefore are stabilizing the infrastructure and environment [6-11].
For more Agriculture Open Access Journal articles Please Click Here:
https://www.lupinepublishers.com/agriculture-journal/Lupine Publishers
0 notes
Text
Lupine Publishers | Fresh Water-an Emerging Global Concern with Special Reference to India

Abstract
Increase in population requires increased demand of fresh water with the life style of people. Fresh water is a limiting resource and consequently there has been an increasing water stress in many parts of the world. Such a stress is assuming alarming proposition leading to conflicts and fights and may further aggravate the situation to an alarming level. An effort has therefore been made by the authors of the present paper to assess and present the situation at global and India level for evaluating and formulating the timely actions.
Keywords: Water; Global availability; Demand; Population; Water stress
Introduction
The world population was 2.5 billion in 1950, 4.4 billion in 1980, 6 billion in 2000 and projected to grow to 8 billion in 2025 and further likely to increase to 9.3 billion in 2050. Majority of this growth will occur in urban areas of developing countries (UNDESA, 2002). Such an increase in population coupled with higher standards of living will pose enormous strains on land, water, energy, and other natural resources. In the present context, the growing population and resulting demand for water is one of the most significant global concerns facing the mankind currently and in future. The availability and quality of freshwater resources around the world are of growing concern along with growing climate change which has resulted into misbalancing water resources [1].
Understanding the problem of freshwater scarcity begins by considering the distribution of water on the planet. Approximately 98% of our water is salty and only 2% is fresh. Of that 2%, almost 70% is snow and ice, 30% is groundwater, less than 0.5% is surface water (lakes, rivers, etc) and less than 0.05% is in the atmosphere. Climate change has several effects on these proportions on a global scale. The main one is that warming causes polar ice to melt into the sea, which turns fresh water into sea water, although this has a little direct effect on water supply
Global Water Budget
It is estimated that the world contains about 1.4 billion (1,386 million)km3 of water (Shiklomanov, 1998) which is enough to cover the entire globe with a layer of water 2,718m deep (Shiklomanov, 1993). It is aptly said that water is difficult to create or destroy under most natural conditions and thus it recycles globally through its three states of liquid, solid, and vapor [2]. As a result, the total quantity of water on Earth today has remained relatively constant since approximately 2 billion years ago (Christopherson, 2002). Out of the total water available on earth, 2.5%, amounting to about 35 million (35,029,000)km3 is freshwater and if all this water was located on the surface and evenly distributed, it would be enough to cover all the continents with a layer of water 235m deep (Shiklomanov, 1993). However, approximately two-thirds of this freshwater (24,364,000km3) occur in the form of permanent ice or snow in polar and mountainous regions and is not readily accessible for use [3]. Hence, liquid freshwater (including atmospheric vapor and biological water) available is only 10,665,000km3, or 0.77% of the global water resource [4].
The most of the fresh water is available as ground water which is to the tune of 10,530,000km3 or 98.7% whereas less than 1 percent of the order of 104,620km3 occurs in lakes, marshes and wetlands, and rivers, and only 0.1% amounting to 12,900km3 is in the atmosphere as water vapor. However, useable freshwater comes from rainfall which is generated through the hydrologic cycle and this water is recycled continuously as a result of evaporation driven by solar energy [5]. The water evaporates from the oceans is of the order of 502,800km3/yr which falls on the earth as precipitation to the tune of 458,000km3/yr resulting in continuous transfer of freshwater from the ocean to the land. However, the average annual rainfall over land accounts to 119,000km3/yr which is only 20% of all precipitation over the Earth out of which around 74,200km3/yr evaporate back into the atmosphere (Shiklomanov, 1998). It may however be noted that countries are defined ‘water stressed’ when annual water supplies drop below 1,700m3/ person whereas ‘water scarce’ when drop below 1,000m3/person. A country is defined as high water stress if demand is greater than 40 percent of the renewable water supply [5].
Indian Scenario
India has 16 percent of the world’s population whereas only 2.5 percent of the worlds land area and 4 percent of the world’s water resources at its disposal. Around 4,000 trillion liters of fresh water is provided through precipitation in the form of rain and snowfall in India out of which majority is returned to the oceans via rivers and a portion of this water is absorbed by the soil which is stored in underground aquifers whereas smaller percentage is stored in inland water bodies such as lakes, ponds, tanks and reservoirs [6]. It has been estimated that around 1,869 trillion liters of water reserves are available in India out of which only an estimated 1,122 trillion liters can be exploited due to topographic constraints and distribution effects [7]. However, the demand for water has been increasing at a high pace in the past few decades and the current consumption in the country is approximately 581 trillion liters with irrigation requirement as high as 89 percent followed by domestic use at 7 percent and industrial use at 4 percent [8].
The rapid increase in population, urbanization and industrialization has resulted into significant increase in water requirement in as much as that industrial requirement is expected to be doubled from existing 23.2 trillion liters to 47 trillion liters in next decade whereas domestic demand is expected to grow by 40 percent from 41 to 55 trillion liters while irrigation will require only 14 percent amounting to 592 trillion liters from existing 517 trillion liters. It has also been estimated that demand in the country will very soon overtake the availability of water. However, in some regions of the country, it has already happened. As per the Ministry of Water Resources, Government of India the per capita water availability in 2025 and 2050 is estimated to come down by almost 36 percent and 60 percent respectively as compared to 2001 levels.
India has turned into water deficiency country and over the coming years the demand scenario is projected to become worse in as much as that water supply for the average citizen could drop from an average of 105 liters to only 65 liters a day with a large section of the population having no access to potable water. There has been a regional disparity in availability of water across the country due to uneven rainfall and most of Indian cities, including Chennai and Mumbai, depend on rainfall for their yearly water supply. Moreover, groundwater levels have reduced significantly for the last 60 years and as a result out of total 5723 blocks assessed across India by the Central Ground Water Authority, 839 have been found to be overexploited, and 226 are classified as critical, while 550 are under the semi critical stage.
Conclusion
Fresh water availability is essential for the survival of human kind and supporting attributes but with the growing population with increasing life style, the needed fresh water demand is posing threat to the available resources. In Indian context, the most of fresh water occur on account of rain fall but majority of which is discharged in oceans through rivers. Therefore, there is a strong need with commitment to interlink all the Indian rivers so that fresh water is not allowed to be wasted by entering into oceans. If such an arrangement is made, the availability of fresh water will be distributed across the country to avoid regional disparity.
For more Agriculture Open Access Journal articles Please Click Here:
https://www.lupinepublishers.com/agriculture-journal/l
Lupine Publishers
0 notes
Text
Lupine Publishers | Effects of Urban Farming Practices on Income Poverty Reduction in Dodoma Municipality, Tanzania

Abstract
The main objective of this paper is to reveal the less known effects of urban farming practices on income poverty reduction in Dodoma Municipality, Tanzania. Collected primary and secondary data were analyzed both manually and by the use of SPSS software in which descriptive statistics and multiple responses presented by frequencies and cross tabulation employed. The findings show that the male raised higher income (61.7%) compared to women (38.3%) resulted from urban farming practices. It also shows that the majority of urban farmers use rain water compared to other sources of water. The capital availability found to be a problem (73.3%); has income below TZS 90,000 per month. The study also revealed that urban farmers use poor technology in farming activities. However, the study found that urban farmers practice agro-forestry which help to prevent land degradation and to enrich soil fertility as well as acting as wind breakers and shade provision. It was found that, though urban farming practices contribute to reduce income poverty in the study area but there are some factors which found to hinder the improvement of urban farming such as inadequate water supply, inefficiency laws and by laws and lack of improved seeds due to insufficient capital. These problems can be minimized through early seed provision from government and NGOs, use of irrigation technology rather than depending on rainfall, efficiency and effectiveness implementation of laws and by-laws and increase area for urban farming as population increase in Dodoma municipality due to concentration of colleges/universities and government activities.
Keywords: Urban farming; Urban famers; Income poverty; Land degradation
Introduction
Background information
farming is very extensive in urban areas in developing countries. Urban farming includes activities such as crop farming, vegetables, gardening, livestock keeping and poultry. It is estimated that; urban farming is practiced by about two thirds of urban workforce in developing countries [1]. Urban farming could contribute to mitigating the two most intractable problems facing third world cities which are poverty and waste management. Urban farming is one of several food security options for households. Similarly, it is one of several tools for making productive use of urban open spaces, treating urban waste, saving or generating income and employment and managing fresh water resources more effectively ibid, 2000.
The main motivation for urban farming is food production and/or higher income for personal consumption or sale ibid, 2000. Tanzania economy is still depending on agriculture as its main stay. In the year 2015, the contribution of the agriculture to the total GDP has been around 29%, and contributed 70% to the total employment and 55% of the country’s foreign currency [2]. Dodoma urban as one of the semi-arid areas in the country, through municipal councils’ authorities set strategies on encouraging farmers to put priority on production of drought resistant crops such as cassava, millet, sorghum and sunflowers in all areas with an annual rainfall between 400mm-600mm (Municipal Agricultural and Livestock Development Officer, 2016). In Miyuji ward there was more than 13.6 hectares which were used for growing grapes and other plants but now only 6.2 hectares are used for these activities (Dodoma Municipal Report, 2016). This shows that there is a decrease in urban farming practices in Miyuji ward more than half of the area which planned for agriculture.
Statement of the problem and significance of the study
Dodoma municipal council has 196,000 hectares suitable for cultivation but only 137,200(70%) hectares have been cultivated. Out of cultivated area, 11433(12%) hectares are used for urban farming and only 1509(1.1%) hectares are used by small farmers in Dodoma municipal council. Urban farming in Dodoma was mostly practiced by farmers in Miyuji, Msalato, Veyula, Mzakwe, Makutupora and other areas in Urban and Peri-Urban (Dodoma Municipal report, 2016). About 68% of the estimated 16,579 human population (2016) in Miyuji ward are relying on arable farming and livestock keeping.
The ward estimated to have 3832 hectares of arable land but only 1734.7 hectares are used for farming (Miyuji WEO office report, 2016).Despite of the hectares used for urban farming in Miyuji ward is being decreasing, yet the living standard of people, especially urban farmers, is very poor in the ward. Therefore, this study intended to examine the effects of urban farming practices on income poverty reduction in Dodoma municipality. The findings of the study will be useful in reducing income poverty to urban farmers by promoting urban farming through identified constraints and opportunities facing urban farming practices and formulating competent national policies which will be used in improving urban agriculture, and help to add literature related to urban farming.
Research objectives
General objective: The main objective of this research was to examine the effects of urban farming practices on income poverty reduction in Dodoma municipality.
Specific Objectives: Specifically, the study was intended to:
Examine factors affecting the performance of urban farming practices in the study area
Examine contribution of urban farming on income poverty reduction in the study area.
Examine the effects of urban farming on the environment in the study area.
Conceptual framework
The primary interested variable of this study is the dependent variables which is assessment of urban farming practices. The intermediate variables will be used in attempt to explain the dependent variables; these variables are amount of inputs, farmers’ income, Extension services and farming practice. Independent variables acting on and operating through intermediate variables which cause or determine or influence dependent variable to occur. The Figure 1 below shows the conceptual framework in a clear and simple way.
Figure 1: Conceptual Framework of the Study.
Research Methodology
The study area
The researcher chooses Miyuji ward as the study area in Dodoma municipality due to the fact that, it is among the area which urban farming practices were given priority and there were planned land for such activities (Dodoma Municipal council report, 2016). Miyuji ward is located in urban area of Dodoma Municipality which lies between Latitude 60–6030/ South and longitude 3503/–36002/ East. Dodoma Municipality has an area of 421km2 of which 346km2 is arable land, 57.1km2 is residential and industrial area 17.9km2 occupied by natural resources and planted forests, mountains and non-arable land (Figure 2). According to projection basing on year 2012 population census, the current population of Dodoma municipality accounts to 446, 579 inhabitants, where by 240, 481 inhabitants live in urban areas and 206, 098 live in peripheral zone consisting of villages. The population size of Miyuji ward in 1988 was about 14,288; 2002 was about 15,779; and 2012 was about14, 965. This situation shows that the size of Miyuji was dramatically decline for about -0.47%/year from 2002 to 2012.
Figure 2: Map of the study area.
Data types and sources
Both primary and secondary data were used. Primary data such as income levels and farm sizes were collected in Miyuji ward by using household questionnaire. Secondary data such as number of extension workers, number of market centers were collected from street and ward executive offices by reading different reports and documents existent.
Sampling design
Sampling frame: A list of all households was used to pick respondents where a sample of 70 respondents was taken to represent the total population. Judgmental sampling was categorizing samples into different groups such as household with large arable land, household with small arable land, local leaders, extension workers (EW) and District Agricultural Officer (DAO)
Sampling unit: The sampling unit for this study was a household.
Sample size: The sampling size for this study was 100 (Table 1), which involves 90 households and key informants. Yamane (1967), provides a simplified formula for calculating sample size as follows:
n=N/1+N(e)2
Where: n=Sample size
N=Population size (Number of households in my case)
e=Level of Precision
In Miyuji ward: N=3684
e= 10% as recommended to social sciences
n=3684/1+3684(0.1)2
n= 97~100 households
Sampling procedure: Both probability and no-probability sampling techniques was used.
Probability sampling: The method was used to obtain the sample required by employing stratification where the population was divided into a number of homogenous sub-population and a sample helped the researcher to obtain 90 respondents.
Table 1: Respondent Sample Composition.
Non-probability sampling: The method was used to obtain the sample required by employing purposive sampling technique to select the 10 sample required to meet the objectives includes selection of AO (Agriculture Officers), MEOs (Mitaa Executive Officers), and WEO (Ward Executive Officer).
Data collection methods
Both primary and secondary data collection methods were used.
Primary data: Primary data was collected by using the following methods:
Interview: Structured questionnaire was used to enable face to face meeting in which the interviewer asked the interviewee questions and recorded responses. This method was used to obtain information from different respondents.
Observations: The method was used by visiting the selected areas to observe different things related to study such as how urban farming is practiced.
Focused group discussion: Focused group discussion enabled respondents to express and exchange their views on how they practice urban farming. This group involved Mtaa C/p, Extension officer, and few urban farmers. Group of not more than 25 people is recommended since they will be difficult to manage [3]. Fourteen respondents were invited to participate in focus group discussion for Miyuji ward as follow; Ward executive officer (1), Mtaa government chairpersons (3), Mtaa executive officer (3), Ward agriculture extension officer (1), and prominent urban farmers (6). Group discussions were conducted in a ward executive office where flip charts and marker pens were available after seeking permission from ward authorities. Questions were written on the flip chart, and the chairman who was elected by the participants guided the discussions by first reading the questions loudly for every member to hear and allowed for contributions through raising a hand. The group leader’s role also was to make sure that one person does not dominate and influence the discussion. The researcher took notes as well as probing questions when judged that the respondent’s statement was ambiguous. The information collected was used to supplement the household questionnaire.
Secondary data: Secondary data was gathered through.
Documentary review: The method was involving reading various published and unpublished materials related with the study. These materials include internet, books, Magazine, newspaper and Journals.
Data Processing, analysis and presentation
Data processing: Data was processed both manually and by computer using SPSS (Statistical package for social sciences) and MS-Excel where the exercise involved editing questionnaires, coding, clearing and verifying the entered data for easy interpretation.
Data Analysis: The data was analyzed manually and by the use of SPSS Version 11.5 software. Bivariate analysis technique was used in which the researcher examined the relationship between two variables for example farm size and Household income by the use of Cross- tabulation method.
Data presentation: The results from the research are presented by using charts, tables and graphs.
Limitations of the study
Time was not enough to cover the whole ward instead only 3 streets (mitaa) were represented.
Some respondent especially key informants were reluctant to give out the needed information as they thought that, they will be responsible when the wrong things/issues concerned with urban farming been recognized by the institution, however observation and literature review overcome this difficult.
Disturbances/bureaucracy of getting permission to conduct research in a study area.
Results and Discussion
General characteristics of the respondents
The study population comprised of males and females with different ages, family size and education background (Table 2). Of the household heads interviewed, 53.3% of the respondents were between 35-44 years old and 46.7% were between 25-34 years old. This was important because these age groups are the one who practice urban farming; understand the historical trend of their areas as well various indigenous technical knowledge. The study mitaa were found to have large household sizes. Results show that 55.6%have 6-10 persons per household and 44.4% have 1-5 persons. This is due to the behavior and culture of excluding family plan, of which results into a lot of dependents to feed and take care of Education background of the surveyed population is mainly primary education (90.0%), very few had college education (6.7%), and 3.3% had secondary education. Despite of having primary and secondary schools but the number joining secondary schools is small due to financial base of study population.
Table 2: General information on residents of study villages.
According to URT [4]; World Bank (2014); and Deloitte [5], one of the signs of both income and non-income poverty in the country is the low level of literacy and numeracy. The literacy level in Tanzania is now estimated to be 68%, down from 90% achieved in the 1980s. The gross enrolment rate for primary school pupils was 77.8% in 1996, down from 90% in 1980s. the literacy rate for youths and adults in the year 2014 was 76% and 73% for male and female youths respectively; and 75% and 61% for male and female adults respectively World Bank (2014).The Tanzanian government has managed to pay teachers’ salaries and allowances but number of teachers employed is not enough despite the efforts made to recruit more teachers due to agenda of having at least one secondary school in each ward and primary school in each village. With free tuition fees in public schools, the number of girls will be increased in schools as parents had have tendencies to choose between boys and girls to educate before the year 2016 because of cost sharing [6-8].
Factors affecting the performance of urban farming practices
Water availability: Availability of water is an important factor for urban farming practices. Miyuji ward is within semiarid region of Dodoma where enough rainfall for urban farming practices is a problem. The study mitaa in miyuji ward based on multiple responses (Table 3) found to have water mostly from rainfall (46.2%), 23.5% shallow wells, 19.3% underground water, 7.6% pipe water and 3.4% borehole. The results show that many urban farmers in Miyuji ward prefer rain harvesting as source of water, and due to low water table in Dodoma region, underground water also seems to be preferred although it require some fund for investment in it like pump machine, fuel etc.
Table 3: Main source of Water in Miyuji Ward.
Laws and by laws: The study mitaa found to have by laws that deal with urban farming. The results Table 4 shows that 77.7% of respondents in study mitaa understand and respect by laws present while only 22.3% claims that they do not know if there is by laws for making urban farming sustainable. By laws is very important for guiding urban farming practices. The following by laws which enforced in the study area based on multiple responses Table 5 shows that 45.3% of urban farmers responded to bylaw dealing with protection of soil erosion by restrict quarry activities, 36% protection of forests (cutting down of trees), 10.7% protection of water and 8% protection of illegal farm burning. The study made revealed that 80.4% of the urban farmers in the study area are aware with existing by-laws and its effectiveness. However, 19.6% of urban farmers complained that the existing by-laws are not enforced hence are not effective. It was established that 90.2% of urban farmers want any person acting against the existing by-laws to be penalized the rest 9.8% want any criminal to be jailed (Table 6).
Table 4: Presence of by Laws Dealing with Urban Farming.
Table 5: By laws guiding urban farming.
Table 6: Efficiency and Effectiveness of By-laws Guiding Urban Farming.
Table 7: Income level of Respondent per Month.
Capital Availability: Urban farming needs starting and operating capital so as to harvest considerable crops per acre and end products results from livestock and poultry. Capital helps to buy chemicals, fertilizers and other inputs helps in farming practices (Personal Observation). The study mitaa found to have different income groups in which 61.1% of study population has income per month above TZS 60,000 (Table 7). The results show that 38.9% of the urban farmers are living in absolute income poverty for both employed and unemployed and cannot even have power to buy any input for farming or self-sustenance. That majority with high income above TZS 60,000 can use the money earned to buy different equipment. During focus group discussion it was found that, urban farmers are not recognized in financial institutions for providing them loans unless they form a group of five persons or above and follow long procedures until given that loan. Also these urban farming practices are also done by employed people so as to raise household income, reduce income poverty and provide food to households’ members who are large in number. Also the study found that, urban farmers in Miyuji ward are practiced by both men and women from all income groups where by the majority of them were from below TZS 60,000 income earners as shown in Table 8. It was established that those urban farmers grow food crops for security and income generation as stipulated by Nugent [9,10] and URT [7]. In Miyuji ward women who engaged in urban agriculture are actively participate in urban garden for home production but also in food processing and marketing though in Miyuji ward women are involved in small scale production as explained much by Mouget [10] and URT [7].
Table 8: Income level of Respondent per Month interms of Sex.
Market availability: The study area found to have markets for their products from urban farming practices. The results show that 87.7% of study households said they have market for their farming products. This shows that in Miyuji ward market for urban farming products is not a serious problem what is required is to increase crops production. Crops produced includes millet, cassava, sorghum, sunflower, grapes, groundnuts, njugu, maize, vegetables, tomatoes and others; while livestock keeping includes cows, goats and pigs; and poultry which mostly includes hens (Table 9). Due to increase of higher learning institutions in Dodoma urban, it is likely the market to be extended and scarcity of this products resulted from urban farming practices increase and leads to poverty reduction to those people involved in these practices.
Table 9: Market availability of Crops, Livestock and Poultry.
Plot size and type of tools used for agriculture: The study area found to have scarcity of land for urban farming. The results show that 84.4% of study households own land and only 15.6% rent those lands for urban farming plots (Table 10). Also 100% of the study area own 1-4 acres of land and within this study population 95.6% claims that land is not enough and 85.6% propose average farmland required to be 5-9 acres and 14.4% propose to remain 1-4 hectares with maximum land size of 4 acres. Due to the use of hand hoe (low technology) in study area for agricultural activities, farmland shortage will continue to be a problem until the situation is reversed. Most urban farmers claim that, though urban agriculture is potentially viable and productive but not a panacea to solve the most severe problems of food security in Miyuji ward as explained also much by Nugent [9] and Mboganie [11].
Table 10: Market availability of Crops, Livestock and Poultry.
Use of fertilizers: The made in the study area found to have high fertilizers users. The results show that 63.3% use fertilizers and 36.7% are not using fertilizers (Table 11). This shows that disparities of income groups are the determinant for using fertilizers as those urban farmers with high income group are the one with ability to buy fertilizers. Also those practice either livestock keeping and agricultural or poultry keeping and agriculture can use manure type of fertilizer which is not costly [12]. Kinds of fertilizers used are shown in Table 12. The increase in fertilizer prices and reduction in credit have hit urban farmers harder because they are on poorer land which needs more of fertilizer which they are less able to afford. This has resulted in increasing cultivation of marginal areas with associated deforestation and erosion problems.
Table 11: Fertilizers Usage in Farming.
Table 12: Kind of Fertilizers Used.
Contribution of urban farming on income poverty reduction
Activities of urban farming: The study made found to have high number of household using rain fed farming as their main source of water for urban farming [13]. Results shows that, 56.7% use rain harvesting only 9.3% and 4.1% use pipe water and borehole respectively (Figure 3). This shows that those use pipe water from DUWASA are the one who cultivate leafy vegetables includes chinese, beans, sweet potatoes leaves, cassava leaves and non-leafy vegetable includes tomato, cucumber and carrot; and cultivate both vegetable and fruits includes orange, grapes and pawpaw. The common crops grown by both groups of different main water sources includes millet (23.6%), sunflower (23.2%), sorghum (21.4%), maize (14.5%), groundnuts (7.7%), cassava (5%), and njugu (4.5%)(Table 13). Also livestock kept includes cows (28.1%), goats (6.3%) and poultry (hens) (65.6%) (Table 14). These crops grown and livestock kept are both for subsistence use in families and business to increase income of household whereby keeping hens found to be done by large number of households in study area. The study found that, men in Miyuji ward dominate commercial urban food production such as sunflower and groundnuts and selling of livestock kept. Most of women earn/control the money from milk and eggs selling. The study also revealed that children were involved in urban farming activities through weeding and watering. Involving children is contrary to child labour rights [14].
Figure 3: Source of Water in Miyuji Ward.
Table 13: Crops grown kept in Miyuji Ward.
Table 14: Livestock kept in Miyuji Ward.
Table 15: Crops production per acre.
Amount produced and sold and price of products: The study population found to have medium production of urban farming products [15]. Crops production per acre as shown in Table 15 below shows that, 35.1% produce 2-4 bags per acre of sunflower, 21.6% below 2bags of sorghum, 25.8% produce 4-6 bags of millet per acre, 13.4% produce 6-8 bags per acre of Maize, Njugu 15.5% produce below 2bags per acre, 11.3% produce 2-4bags of cassava per acre, and 12.4% produce Groundnuts below 2bags per acre. Animal production based on end products shows (Figure 4) that, 43.3% produce hens’ eggs and 18.6% produce milk During focus group discussion, it was shown that, urban farmers of Miyuji ward use products obtained for home use and business whereby most of them sell all products in order to get income for covering some expenses for example paying fees for their children, health issues, water bills and all other household necessities needed rather than priotised using crops produced to solve the problem of food insecurity. Market availability for products produced is not a problem in a study area [16]. Results in Figure 4 shows that 88% of the respondents in study area have market for their products and only 12% have no market. This shows that as population increase in Dodoma urban then demands for urban farming products increases, therefore production should be increased in order sustain the available population.
Figure 4: Animal end product produced.
When the researcher interviewed households, it was found that, price of crops products varies depending on demand especially during parliamentary meetings and higher learning students’ institutions studying semester’s periods. Animal products includes milk and eggs found to have constant price of TZS 1000 per liter and TZS 500 per egg while the price of cow and chicken are subject to change ranging from TZS 300.000 to 600,000 depending on size and specie of cow, while chicken range from TZS7000 to 15,000. In order this farming practices to be improved so as to increase production, the study households suggested as shown in Table 16. 30.1% said if they can be supplied by early seeds provision, adopt irrigation technology (28%), establishment of market nearby, increase number of extension officers (8.3%), separating agriculture and livestock area (6.2%), education and training provision to urban farmers on good method of agriculture (3.2%) and Subsides provided on fertilizers and pesticides to reach urban farmers (3.2%) tgether with financial support from Banks and Credit agencies [17], altogether can improve urban farming practices and more urban dwellers can engage themselves as explained much by Nelson, 1996.
Table 16: Suggestion given by urban farmers on the improvement of their farming practices.
Effects of urban farming on the environment
Chemicals used and cow dung disposal: The study found that urban farmers have low usage of chemicals in farming practices. Results shows that, 71.7% do not use any insecticides or pesticides in crops production and only 28.3% use insecticides and pesticides for the crops production (Figure 5). This shows that farming products produced in Miyuji ward have little concentration of chemicals which can have negative effect to human being. However, during interview with ward agricultural officer, it was shown that sometimes aerial sprays to kill “koleakolea” have been done in the area few years ago. Also during focus group discussion, it was revealed that cow dung disposal in farm plots make them to increase nutrients as a results production per acre increase compared to plots without any fertilizer. Additionally, it was found that cow dung can be used for production of bio-gas which is alternative source of energy rather than concentrating using fuel wood and charcoal as the main source of energy in study area.
Figure 5: Market availability for crops and animals products.
Figure 6: Insecticides/Pesticides usage in farms.
Figure 7: Land Degradation Resulted From Urban Farming Practices.
The study area found to have land degradation resulted from urban farming practices. Results shows that 93.3% of study households experienced land degradation resulted from urban farming practices and only 6.7% do not experience it. This shows that poor farming practices present in the area, so the duty of extension officers to reverse the situation will be appreciated (Figure 6). Land degradation is among of the effects on urban farming which experienced in the study area [18]. Types of land degradation experienced are shown in Table 17. Also it shows that this land degradation decreasing. Results from observation and household questionnaire shows that, 92.9% of study households have seen this degradation as decreasing and only 7.1% responding to increasing land degradation (Figure 7). This shows that presence of extension officers helps to conservation of environment by teaching community proper way of practicing urban faming. Major reasons for increasing and decreasing land degradation are shown in Table 18.
Table 17: Types of Land Degradation experienced in study area.
Table 18: Major Reasons for Increasing and Decreasing Land degradation.
Figure 8: Status of Land Degradation.
Figure 9: Tree planting.
Table 19: Purpose of growing trees in study area.
Planting trees: Planting trees is a positive strategy towards environmental in many areas of the world, and collaborative measures whereby, all community together practice this tree planting for the benefit of extracting carbon dioxide gas concentration resulted from daily productive activities Smit and Nasr, 1997. The study found that 93% of respondents in study area planted trees and only 7% did not plant trees (Figures 8 & 9). This shows that indigenous technical knowledge and NGOs play a good role in providing conservation education and importance of growing trees for the benefit of urban farming practices. The study population found to have behavior of planting trees for shades rather than combating fuel wood shortage. Results shows that 27.4% of planted trees are meant for shades, 26.7% for soil fertility maintenance, 15.6% for fuel wood and building materials respectively, and 14.8% for wind breakers (Table 19). Also the study revealed that in Miyuji ward have high populations who plant few trees per year. Results in Table 20 shows that 40% of respondents planted two trees per year and 60% plant more than two trees per year. This implies that, as times goes on and those trees planted being protected then in few years to come Miyuji ward can have large amount of tree.
Table 20: Number of Trees Planted Per Year.
Conclusion and Recommendations
Conclusion
Generally, urban farming practices contribute much to reduce income poverty in Dodoma Municipal especially in Miyuji ward. Based on analyzed data most of respondents are in a position of improving their living standard and getting their basic human needs due to involvement in urban farming practices though there are some factors which observed to hinder urban farming practices in the study area such as inadequate water, inefficiency laws and by laws which govern urban farming practices, lack of enough capital, small plot size, low technology and lack of nearby market to sell their crops and livestock products.
Recommendations
Urban farming practices is a new employment opportunity to urban dwellers as the study shows it increase income to households, fight food insecurity, provide room for environmental conservation through planting trees and adopting proper way of farming and other benefits associated with urban farming. In order this sector to be improved and increase production, the following issues found in the study area must be taken into account:
Early seed provision from the government and non-government organization can help to improve urban farming practices in Miyuji ward. This can be facilitated by ward agricultural extension officer.
Improvements of irrigation method can help to improve urban farming practices rather than depends much on tap and rain harvest water. Urban farmers, extension officers and government are in position to incorporate in order to reach consensus.
Regular education to the urban farmers from urban farmers’ expertise can help to increase the crop and livestock yield hence poverty reduction to the urban farmers.
The village government must ensure implementation of existing laws and by laws governing urban farming practices which help to conserve the environment so as to be conducive for practicing urban farming.
Town planners should plan an alternative area for urban farming practices to suit the urban farmers as their areas are too small as compared to the size of their family.
For more Agriculture Open Access Journal articles Please Click Here:
https://www.lupinepublishers.com/agriculture-journal/
0 notes
Text
Lupine Publishers| Primary Determinant in Quality Deterioration of Fish Seed in Captivity

Abstract
This study was primarily undertaken to review the current status of fish seed production at freshwater sector of West Bengal, Bihar and Assam – three leading seed producing states of India (Figure 1) and its distribution range within the state and throughout the country. Main emphasis of the work was to assess how far the current practices are following the principle objectives of the technology i.e. production and supply of quality seed out of captive breeding. With the immediate standardization of the technology, West Bengal farmers adopted the technology of their own (in 98% cases) and started practicing the technology, initially through hapa breeding and afterwards through the establishment of Chinese hatchery. The realization of huge profit margin within a short period (4-6 months), attracted people from diverse sectors and soon mushroom hatcheries came, who started practicing seed production by learning the mechanical aspects of the technology from neighboring farmers.
The profit-making proposition attracted farmers from Assam and Bihar, who by learning the mechanical aspects of the technology from ignorant fish breeders of Bengal, started seed production in captivity by hiring skilled laborer from Bengal, which continues still today. Even today the entire hatchery operation in Bihar and part of the hatchery operations in Assam is under the control of hired people from Bengal. Misappropriation and profit-making proposition [1] of the technology and subsequent deterioration of quality starts from this point. In the subsequent years, the fish breeders, not being apprised of their faulty breeding practices due to want of any primary training on their part, used the technology only for profit. In the compromization with quantity, quality lost its fragrance and as a consequence a worthy technology became a curse in disguise for the sector.
Within very short period of introduction of technology, the ignorant farmers started practicing improper breeding practices like mixed spawning, use of small number of under aged and undersized breeding population and indiscriminate hybridization for their profit and convenience. Mixed spawning leads to hybridization inadvertently and ultimately affect the native gene pool. Maintenance of small number of founder population leads to inbreeding and the obvious genetic consequences are the increased fry deformities (37.6%), decreased food conversion efficiency (15.6%) and fry survival (19%). Again, the undesirable hybrids [2,3] when find their way into natural system results in “genetic intermixing” and affects the genetic biodiversity of the native fish fauna of Bengal. Along with these the fish breeders are introducing alien fishes almost every year without maintaining any code of practice. This alien introduction and repeated use of unauthorized drugs and feeds (composition totally unknown) severely affecting the native biodiversity and unless checked early it may lead to the extinction of some of the prized fishes of Bengal.
Keywords: Seed quality; Misappropriation; Mixed spawning; Genetic intermixing
Introduction
Indian carps are seasonal breeders and gonadal recrudescence in these fishes occurs after vernal equinox i.e. on 22nd March prior to breeding seasons [4]. These fishes develop eggs but cannot shed them in captivity. To overcome the demerits of natural collection of spawn, the techniques of induced breeding otherwise known as hypophysation was developed in experimental condition. The technique later transferred to field condition, which revolutionized the fish seed production and trade in Bengal in particular. It is observed that Bengal fish seed producer’s/hatchery owners, being illiterate and totally unaware of the scientific basis of the technology; inadvertently use the technology only for profit making purpose. In most cases the farmers learn the technology from the neighboring farmers and there was complete absence of any institutional transfer or training program and follow-up action. The Bengal farmers adopted the technology very well and shouldered the responsibility to produce more than 70% fish seed requirement of the country. At the same time, the farmers modified and refined the technology time to time with their innovative approach From Bengal the technology was transferred to Assam first and then to Bihar, while farmers of both the states visited Bengal hatcheries, may be at the end of seventies. The farmers of both the learn the technology from the ignorant and illiterate fish breeders of Bengal and for establishing hatcheries in their individual states hired skilled labors from Bengal. This indicates that initial establishment and implementation of such a novel technology were done without any scientific approach of program.
Now, with the standardization of the technology and entry of more and more entrepreneurs and business sector, a competitive approach developed among the fish seed producers. This led the farmers to adopt some unfair means and use the technology for profit making purpose. This includes mixed spawning, indiscriminate hybridization (and introduction alien species from neighboring countries. Added to this the farmers out of ignorance never considered potency of the gland and started using immature fishes due to scarcity of brooders during breeding seasons. All these phenomena resulted in serious genetic consequences like inbreeding, genetic introgression etc. The obvious consequences are the negative impact on stock integrity and genetic biodiversity of the native fish fauna. Target oriented research program with strict imposition of laws need to be initiated to check the further loss in biodiversity and maintaining sustainability.
Materials and Methods
The study conducted involving the leading hatchery owners in some of the major seed producing districts of West Bengal, Assam and Bihar. A questioner schedule was prepared and detailed field information was accounted based on the schedule. Fish breeders were interrogated and detailed information were documented regarding the present mode of the application of the technology. The data were compiled and presented in the text. The photographs presented in the text were taken during the field study. Initial study started with West Bengal as it was the pioneer state in implementing the technology, the technology for quality seed production in captivity. Then we proceed to Assam and Bihar as because after standardization of the technology in West Bengal it was transferred to the said two states from West Bengal hatcheries.
In case of Assam, the farmers turned fish breeders learn the technology from the ignorant and illiterate fish breeders, after visiting West Bengal hatcheries during late seventies or early eighties. The scenario of implementation of technology in Bihar is somewhat different. It was envisaged during visit that the entire hatchery operation is controlled by some ignorant hired fish breeders of Bengal, locally known as fish doctor. Even the doctors carry entire batch of pituitary gland with them from West Bengal. The entire operational procedure of implementation of the technology in captivity itself indicate how such a novel technology lost its significance within a period of 30 years and went away far away from its original goal to produce quality seed in captivity. Out of field study 25 hatcheries from each state were selected for and the operational procedure was incorporated in the present paper
Results and Discussion
The quality deterioration of seed, through the implementation of induced breeding technology, started with the following misappropriation.
Dissemination of Technology
The quality deterioration starts with the faulty implementation of the technology, after its discovery at the CIFA centre of Indian council of Agriculture Research, Orissa, India. The transfer of technology, if we count the codes of transfer of technology, developed in the scientific laboratory, here induced breeding technology, didn’t follow the code of practice of transfer. Here, we may consider it as an adoption instead of transfer as because the pioneer fish farmers turned fish breeders adopted the technology of their own from neighbouring 1 or 2 hatchery owners, who learned only the manual aspects of the technology from Govt. Official. Very soon Mushroom hatcheries has come up in and around two districts of West Bengal, India, and in most cases the fish farmers learned only the manual aspects of the technology as there was, practically, no initiation from the Govt. Sector and/or Institutional level to appraise the fish breeders about scientific basis of the technology at any level. Quality deterioration starts with the very first step of unscientific dissemination and as the short-term profitmaking quality is appraised, more and more people opted for captive breeding program by learning only the manual aspects of the technology.
Improper Potency of Pituitary Gland
At the initial stage, before the discovery of synthetic inducing agents like Ova prim, Ova tide, Wova FH etc., pituitary gland was the sole inducing agent. Following the principle of induced breeding, for initiating complete spawning, a pituitary gland should have the right potency. As indicated a rightly potent gland would be that one which is collected from the properly matured fresh fish i.e. fish should be in the 2+ age group and freshly collected. Initial dependence on pituitary led to the development of a chain comprising of gland collector, retailer and supply chain. Collectors are hired persons by the retailers and collects gland from the beheaded head parts of the ice preserved fish from the market. The second phase of the quality deterioration occurs with the collection of impotent pituitary gland about which all involved, from gland collector to fish breeders are not concerned out of ignorance and illiteracy. Final impact is the reduction in population size with consequential genetic phenomenon like inbreeding, genetic drift etc.
Brood stock – its Availability and Management
In a breeding program, the primary input is the readily available male and female fish at the peak of their maturity stage. Along with maturity age and size of the brood fish is also an important consideration for the successful spawning. According to the principle of induced breeding a brood fish in the age and size group of 2-5 is suitable. Collection of brood stock in adequate number from different geographical territories, cataloguing of their geographical origin, their genetic characterization and maintaining their pedigree record are important pre – requisites for breeding program. These aspects are of much genetic relevance for a scientific breeding aiming at quality seed production. Further proper feeding of brood stock and their health maintenance are some important management aspects. Different fish show considerable variations in the number of eggs develop i.e. Fecundity varies. As fecundity refers to number of eggs/kg of body weight so it is easy to assess the requirement of brood stock for production of specific number of eggs. The dietary intake of blood stock found to have profound influence on maturation and fecundity of fishes. Experimental results indicate decreased egg production (75%) when ration size reduced to half, again decreased ration size during second half of reproductive cycle decrease egg size (Table 1).
Table 1: Brood stock management practice in the area of study.
*(>6 species); * *Average; *** (>1500) kg.
Infrastructure for Brood Stock Raising
The available brood stock raising area, nursery, spawning pool, hatching pool, brood stock biomass etc. available in the hatcheries of study area was insufficient. Altogether, 84% of the hatchery owner had insufficient area for growing of brood stock in their farm (Table 1). Formula for calculation of the area required for brood fish pond according to Thomas (2003) is:
ABRP = BR×1/SD, where
ABRP = Area of brood fish production pond
BR = Weight of brood fish expressed in kg
SD = Stocking density of brood fish per ha.
Source and pedigree of brood stock
The study revealed that 72% of the hatchery owners do not have sufficient numbers of brooders to sustain the level of spawn production in their hatchery (Table 1). The small farmers depend entirely on outside source for collection of brood fish prior to breeding programme. The big and medium farmers depend both on farm raised and outside source. It was observed that 62% (average) of the total brood fish comes from farmers own pond and the rest 38% (average) comes from outside source and share basis prevalent among the farmers. The breeders in the hatcheries (80%), visited during study period, are least bothered to know the pedigree of fish stock they have for the breeding programme to be carried out in their farms (Table 1). None of the farms were found to maintain pedigree record of the brood stock, repeatedly using for seed production since long back, required to avoid the mating of close relatives. Cultured populations should be identified by using a proper marking system. Females & males should be from two different lines.
Culling
The practice of eliminating or culling of fish from the breeding programme is the necessity of the modern breeding programme. The culling of fish could be based on the criteria based on the phenotype of fish such as growth, disease, deformity, age, size, and most catchable fish than least catchable during harvesting. No such activity was adopted by any of the fish seed producers of the study area, instead one of the breeder was seen injecting a grass carp fish for induce spawning with a tumour like lump on the skull region of the fish (Figure 1). According to the information provided by him, it was learnt that he has been breeding the same fish for the last couple of years. Table1 conforms that majority of the breeders have no idea about the importance of culling of fish from the breeding programme. Quality deterioration finds its easy routes when a diseased fish used as brooders.
Figure 1: Tumour like lump on upper Cephalo -thoracic region, a potent candidate as brood fish.
Feed and fertilizer
Majority of the hatchery managers do not have proper feeding schedule for the brood stock or nursery management and provide (80%) feed and fertilizer on monthly basis (Table 1). It is just before the start of the breeding season there is a change in feeding schedule. From February onwards, protein rich feed composed of cereals, broken rice, fish meal etc., after boiling in large pot (karai) are broadcasted in the pond arbitrarily two times a day, without any consideration to the bodyweight. In West Bengal and Bihar, the farmers and fish breeders are more interested in using floating feeds, the reason, as they advocated that as the feeds are floating so it helps them to gaze the amount of feed required by the total biomass, besides it creates no pollution. Whatever it may be the entire supply chain of all the aquaculture products like feed, medicine, chemicals, probiotics and inducing agents are under the control of some unscrupulous middleman/agents. Many a times these products fail to fulfil the criteria of the specific needs for which they are used. The consequences are that the users are deprived of getting the expected results.
Table 2: Breeding Practices as adopted by the Fish breeders of Three States.
Figure 2: Need of the farmers as quantified (%) from the survey. (a=specialized training, b=Institutional Finance, c=soil and water testing d=institutional coverage, e=organized fish seed market, f=unhealthy competition, g=exemption of taxation during transportation, h=introduction of new species, i=change in land revenue act, j=supply of quality food, k=removal of discrepancy in breeding program, l=supply of quality brooders m=specific aquaculture medicine).
As indicated, the actors involved in operating the captive breeding program are totally ignorant about scientific basis of the technology and they are using the technology only for profit making proposition. Mixed spawning, multiple breeding (Figure 2) is the normal practice due to convenience and profit. Mixed spawning (more than 80%), is mainly undertaken to cut the water and electricity budget, as because in case of single species breeding, separate breeding pool is required. Mixed spawning leads to indiscriminate hybridization resulting in genetic introgression and other related consequences [5].
In Bihar the entire hatchery operations are under the control of some hired skilled labourer, but in Assam the operations are partly under the control of some hired skill labourer from Bengal. Not being appraised of the basic principles of the technology and to meet the demand of the customers as also to fulfil the profit of the hatchery owners, they adopt all sorts of misappropriation, starting from the use of impotent gland to mixed spawning, hybridization, multiple breeding, use of under aged diseased fishes as brood fishes. Cross verification of some of the leading hatchery owners of three states emphatically said that in more than 80% cases the fish breeders adopt all sorts of misappropriation to achieve their target.
Problems & Suggestions from Farmers
a) Inadequate technical know how
b) Finance
c) Poaching, poisoning of water body
d) Labor dispute, flooding and water logging of the farm sit
e) Availability of quality pituitary gland
f) Excavation of pond in agriculture land
g) Selling of fish seed on 3rd and 4th day of incubation.
8. Suggestions from the Fish Breeders/Farmers
a) Institutional Training Program
b) Changes in Land Revenue Act.
c) Easy Finance.
d) State wise Hatchery establishment for reducing mortality during transportation.
e) Standardization in breeding should be stopped.
f) Dishonesty in breeding should be stopped.
g) Some progressive farmer suggested that household waste water should be drained to a common place on a cluster basis and may be used for backyard fish farming so that some kind of social fishery might be developed. The farmer also suggested that suitable drainage plan should be incorporated during the plan making of house building.
h) Poaching should be stopped.
i) Management of water quality.
j) Subsidy in electricity.
Conclusion
The study indicates that how proper and scientific dissemination of a technology is important for sustenance of the technology. Here, illiteracy, ignorancy on the part of fish breeders about the scientific basis of the technology plays a negative role against its proper implementation. This is the 1st phase of the beginning of quality deterioration of fish seed in captivity. The initial phase starts with use of impotent gland in most of the breeding program. With the increasing demand for quality carp seed from captivity, the demand for pituitary glands were becoming more ex-pensive and their availability is decreasing. Often, batches of these pituitaries are bad as they are collected from the market where dead fishes are preserved under ice. Decrease in their potency is leading to failure in spawning. To overcome these problems, induced spawning of carps and other important fishes, in many countries, are now carried out with GnRH or its analogue [6] which release endogenous GTH and effects spawning in a much confident manner than the crude pituitary extract.
Besides, Pituitary extract very often also contains pathogenic micro-organisms causing infection in fishes. Moreover, pituitary GTH is glycoprotein in nature and is extremely sensitive to temperature denaturation. Hence, GnRH is no doubt a better alternative for induced spawning. But there is one problem with GnRH use; its activity is inhibited by endogenous dopamine. Dopamine occupies GnRH-receptor and thus blocked its action on pituitary gonadotroph cells. Use of domperidone (or pimozide), a dopamine antagonist, increases GnRH-receptor capacity, thus enhancing GnRH responsiveness [7]. Therefore, for induced ovulation, together with salmon GnRH-analogue, pimozide (antidopamine) has been use. On the basis of information, Ova prim, a commercial product has been prepared by the Syndel Laboratories, Canada, which is now marketed by Glaxo Laboratories Ltd for induced breeding of fish.
Though Assam breeders exclusively use synthetic hormones, the West Bengal and Bihar breeders still use the pituitary extract as the primary inducing agent. They claim that pituitary is more effective in stripping and also put blame about the ineffectiveness of synthetic hormone in many cases. Comparative study on the efficacy of two inducing agent on individual species may help in dissolving confusion.Though brood stock can maintain on maintenance ration but recent information, as revealed by various experimental results, indicate deficiency of certain dietary ingredients such as fatty acids (PUFA), vitamins, trace elements, can have negative impact on maturation, breeding, spawning, larval vigor and survivality. Keeping in mind that nutritional requirement varies according to species, proper experiment should be designed to formulate right food for individual brood stock so that supply of quality seed will be ensured to the farming sector.
Experimental study on wild stocks of C. catla represent a diversified genetic resource and indicates that in situ management practices, such as preventing the wanton capture of fish and creating sanctuaries for protecting small stocks such as those in major rivers, can help maintain and conserve the present diverse gene pool. Hatchery owners are accustomed to operating negative selection and polygynous breeding systems in which some males mate with many females year after year, resulting in genetic deterioration that subsequently cause a negative impact on aquaculture production. Based on our present findings, hatchery owners can collect their brood fish or replace their existing breeding populations with genetically diverse fish from stocks like those in the rivers and increase their effective breeding populations and thus improve the aquaculture production. However, the strict implementations of correct management practices are essential to maintaining the genetic diversity of the natural stocks.
Table 3: Faulty Approaches in Breeding practice & related criteria.
A further important point is that breeding between two genetically discreet or distant populations may have a positive impact on aquaculture production. As indicated in Table 3 due to dire scarcity of brood fish, except large hatchery owners there was no organized brood stock management practice, the fish breeders adopt all sorts of misappropriation to manage the customers demand. This create some important avenues for quality deterioration of seed in captivity, Mixed spawning, another profit-making approach by the fish breeders, leads to genetic introgression [8] among the genetically flexible different species of fish [9] while repeated use of small number of founder population for seed production results in inbreeding. All these faulty breeding practices throughout the years has eroded the qualitativeness of the technology, as established by the frequent claim by the seed buyers regarding the poor performance in terms of growth in particular. Other related criteria like use of skewed sex ratio and immature brood fish are also producing negative impact against quality of seed. A consolidated program from Govt. and institute level need to be initiated for general appraisal of the misappropriation with implementation of suitable laws banning the faulty practices can provide sustainability to such a novel technology [10].
In all, it can be said that the first criteria to consider the development of aquaculture sector is the steady availability of quality seed locally (within the states and country) to meet the requirements of the industry. Where ever this has not been possible, seeds and /or brood stock may be introduced through certification. It is encouraging to observe that we are in a stage where the emphasis is slowly shifting from quantity to quality. Only in very recent years farmers began to realize the importance of quality seed i.e. pathogen free uniform size seed to remove their sufferings and to maximize production. It may not be entirely wrong to say that this shift in emphasis (attitude) to seed quality has come about largely because of the recurrent disease problems that has besieged the aquaculture industry especially shrimp and fresh water prawn.
For more Agriculture Open Access Journal articles Please Click Here:
https://www.lupinepublishers.com/agriculture-journal/
0 notes
Text
Lupine Publishers | Onion (Allium cepa) Production in Urban and Peri-Urban Areas: Financial Performance and Importance of This Activity for Market Gardeners in Southern Benin

Abstract
Food safety has always been and continues to be a major concern for all countries of the world. This concern is all the more perennial in the developing countries like Benin with a low economic level and still rudimentary and extensive agriculture. To reduce a little bit of food insufficiency, is developed urban and peri-urban agriculture based mainly on market gardening. This study focused particularly on the production of onion in southern Benin. It aims to analyze its performance, to understand the importance of this activity but also to see what are the obstacles faced by these producers. Three municipalities were investigated: Grand-Popo, Cotonou and Sèmè-Kpodji. A total of 60 farmers were surveyed at 20 per municipality. Quantitative and qualitative tools were combined for the analysis of data collected through individual and group interviews. A joint analysis approach was used to achieve specific objectives. It consists to combine speech analysis, participant observation with statistical tools such as the frequency distribution, the regression model and calculation of performance indicators. It follows from all of these analyzes that onion production is profitable from a financial point of view. This performance is enhanced by factors such as age, experience and membership of a producer group. Similarly, the farmers claimed for majority that onion occupies a special place in their market garden production. This production improves their socio-economic and food situations. However, the constraints that undermine the more onion production and thus constitute important producer concerns are financial, institutional, organizational, property constraints and those directly related to production. Farmers therefore, expect a little more effort from agricultural policies to improve the development of this sector.
Keywords: Onion, Performance, Importance, Barriers, Southern Benin
Introduction
The agricultural sector provides essentially food security and livelihood in Benin, with 70% of the population earning their income from agriculture [1]. This sector is even more important for developing countries like Benin, where it is one of the pillars of the economy [2]. Nowadays, it is increasingly recognized that in the developing world, nearly three billion people live on less than US $2 per day [3]. Majority of this population are smallholder farmers producing staple food crops with little prospects of generating higher incomes. Hence, diversification into high-value horticulture is essential for increasing farm incomes, alleviating poverty and improving livelihoods [4,5]. Globally, food production is still a challenge [6,7], especially with the projected rise in world population to over 9 billion by 2050 and increased urbanization in cities [8]. There is therefore still some justification for increasing agricultural production in the coming years [9,10]. Urban vegetable production is an intensive agricultural strategy through which urban dwellers secure income and improve their livelihoods [11].Urban and periurban agriculture (UPA) has been defined differently by Mougeot [12,13], Moustier [14], and Van Veenhuizen [15], but they all lay stress on agriculture’s relationship with the city as a resource and destination for outputs [16].
Onion (Allium cepa L.) is one of the most important commercial spice crops of the world belongs to Amaryllidaceae family [17]. Moreover, essential oil and sulfur compounds have been found in onion which is responsible for unique odour, flavour, and taste [18]. Based on the interested situation in health food development, the properties of onion and its extract as a functional agent have been demonstrated in many previously [19]. Onion (Allium cepa L.) has been valued as food and medicinal plant since ancient times [20]. It is widely cultivated secondly to tomato, and is a vegetable bulb crop known to most cultures and consumed worldwide [21]. The major onion producing countries of the world are China, India, USA, Turkey, Japan, Spain, Brazil, Poland and Egypt [22]. In Benin West African country, this culture has become very important especially in urban areas where the market gardeners devote more land to the production of onion. It is in order to make an inventory and understand onion production in southern Benin that this study was conducted. Specifically, the study aims to analyze firstly the profitability of onion production, secondly to appreciate the importance of onion production in southern Benin and ending by identifying the difficulties facing the farmers.
Materials and Methods
Study zone
The municipalities of Grand-Popo, Sèmè-Kpodji and Cotonou are located in south of Benin and cover respectively 289km², 250km² to 79km². The town of Grand Popo is located in the southwestern department of Mono. It is limited to the north by the Athiémé, Comé and Houéyogbé communes, south by the Atlantic sea, to the southwest by the communes of Ouidah and Kpomassè and west by the Republic of Togo. Located between the parallel 6° 22 ‘and 6° 28’ north latitude and the meridian 2° 28 ‘and 2° 43’ east longitude, the commune of Sèmè-Kpodji is in the Department of Ouémé, the Southeast of the Republic of Benin on the Atlantic coast. It is limited to the north by the city of Porto Novo and Aguégué, south by the Atlantic sea, to the east by the Federal Republic of Nigeria and to the west by the city of Cotonou. The town of Cotonou in turn is located on the barrier beach that stretches between Nokoué Lake and the Atlantic sea, consistitued of alluvial sands of about five meters maximum height. It represents the only municipality in the Littoral department is bounded to the north by the municipality of Sô-Ava and Nokoué Lake, south by the Atlantic sea, to the east by the town of Seme-Kpodji and West by that of Abomey-Calavi. These towns are from a set that has a sub-equatorial climate except Sèmè-Kpodji bathed in a Guinean Sudanese climate. We find in these areas, the sandy type of soil, leached and hydromorphic. The municipalities of Grand-Popo, Sèmè-Kpodji and Cotonou have various socio-cultural group included the mina, the Goun, the Xwla and Toffins.
Methodology
To conduct this research, three (03) municipalities were selected in southern Benin. These towns were chosen partly because of their significant contribution to the onion production of the department to which they belong, and secondly because of the large number of onion producers they contain. We have Grandpopo, Sèmè-Kpodji and Cotonou. Therefore, (60) producers made object of investigation at the rate of twenty (20) producers per commune. This sample consists only of onion producers. Note that the sample was achieved in a simple random in order to give all producers the same probability of being selected. Table 1 show the composition of the sample per commune: The collected data is related not only to the characteristics of the producers, but also to expenditure and revenue of producers. The information has been collected on the basis of a questionnaire and a pre-prepared interview guide.
Table 1: Composition of the sample per commune.
Source: Results of investigation, 2018.
Data analysis
In this study, the performance of onion production in southern Benin was assessed using several indicators of financial performance. To this end, it is inspired by the work of Dédéwanou [23]. Several profitability indicators were therefore calculated, namely: Gross Product Value (PBV), Added Value (VA), the Gross Operating Income (RBE) and Net Operating Income (RNE). From Adégbola [24] and Bockel [25] studies, these indicators can be calculated as follows:
a) Product Gross Value (PBV): Denoting by Q the quantity of onion obtained and PU the selling price of the kilogram, the Gross Product Value (PBV) is given by: PBV = Q*PU.
b) The PBV is for this purpose the revenue made by the producer.
c) Added Value (VA): It corresponds to the difference between the Raw Product Noise Value and the value of intermediate inputs (CI). Intermediate consumption represents expenses related to the acquisition of insecticides, herbicides, and baskets. Its formula is given by: VA=PBV-CI.
d) The added value is obtained by deducting from the PBV, all expenses directly related to the production. Note that the added value is the wealth that the producer creates. This wealth contributes to the Gross Domestic Product of the country.
e) Gross Operating Income (RBE): It is given by the formula: RBE=VA-(Labor compensation + financial expenses + taxes). To estimate the RBE, it was considered only the hired labor.
f) Net Operating Income (RNE) This indicator represents the balance of RBE less the value of depreciation. Its formula is given by: RNE=RBE-Amortization.
g) The RNE expresses the gain (or loss) Economic agent once acquitted all current operating expenses. RNE, expresses the economic gain (or loss) given the investments made previously. Therefore RNE is obtained by deducting from the PBV all expenses related to production.
h) This study is also proposed to analyze the determinants of the profitability of onion production. For this purpose this study was based on the work of Tovignan [26] and Allagbe [27]. A multiple linear regression model has been developed on the basis of sixty (60) onion producers. Thus, the multiple linear regression formula can be written as follow:
y =α0 +α1xi+ εi
Where: y is the dependent variable, xi the explanatory variables, α is a constant called “intercept” and Ɛi the error term of the model.
The evaluation of the importance of onion production consists to determine changes in socio-economic and food orders induced by this production in the three investigated municipalities. To do this, in a collection of producer’s speeches about perceived improvements since they produce onion was done. The analysis fundamentally was based on the discourse of these producers and through participant observation. More simply, the analysis consists to explain the effects induced by the production of onion in a social context through producer’s speeches and participant observation. These explanations were supported by the comments of some significant producers. The frequency distribution and the farmer’s speeches allowed identifying the barriers of onion production in the study areas.
Presentation of the variables included in the model
Two types of variables are included in the regression model turned. We have on the one hand, the dependent variable and the other explanatory variables. The dependent variable is the Net Operating Income of producers. It was therefore question of identified and analyzed the factors influencing the income of onion producers. So many variables called ‘’ explanatory ‘’ were introduced in the regression model. The explanatory variables included in the model are: age of the producer (Age), household size (Mena), the number of agricultural household assets (ActifM), the level of literacy (Alpha), educational level (Inst), seniority (Anc), membership of a group (APPG), the cultivated area (Sup), the mode of land access (ACCT) and fixed costs (CF).
There are a lot of reasons for the incorporation of these variables in the regression model.
a) Age: Age is a variable expressed in years. Several studies identify age as a parameter determining the profitability of agricultural production. Indeed, the more the producer is aged, the more he gains experience enabling him to improve the financial performance of its operations. This variable has been introduced into the model to see if it has an influence on the net income of onion producers in South Benin. The age would have a positive effect on the financial performance of onion production.
b) Mena: This variable refers to the number of persons who form the household of the producer. Household size is a potential source of labor and allows producers to increase production. It therefore positively influences the net income of the onion producer.
c) ActfM: This variable represents the number of agricultural workers of producer household. The number of assets would have a positive effect on the profitability of production because the market garden production, especially onions requires a lot of labor.
d) Alpha and Inst: Education can acquire a base regarding the management of a exploitation. So, educated onion producers will have a higher income than their uneducated counterparts. The effect of literacy and education on the net income would be positive.
e) Old: This is the number of the producer seniority year. Over the producer has a number of high year of seniority, the more he has strengths and knowledge that will enable him to improve his onion production. It therefore positively influences the net income of the onion producer.
f) APPG: This variable represents the membership or not of the producer to a group. It is a binary variable taking the values 1 if the producer is a member of an onion producer group or 0 if not. This variable could have a positive effect on financial performance of the production, in the sense that the producer’s group members have the support of extension services as well as that of some development programs and projects in order to improve their performance.
h) ACCT: This variable represents the farmer’s access mode to the ground. This variable is set to 0 if the producer has access to land by inheritance; 1 if access rental. The fact that the onion producer owns the piece of land to his work, it could have an influence on his income because the latter will invest the necessary capital. A positive or negative sign of the coefficient for this variable would be expected.
i) CF: Fixed costs represent costs of production. Over were these expenses less producers take advantage of his farm. These variables will therefore have a negative effect on net income of onion producers.
Table 2: Summary of the model variables and the expected signs.
Source: Results of literature searches, 2018.
Table 2 shows a summary of all the variables included in the model with their expected signs. Note that two software’s were used in this section. SPSS has achieved descriptive statistics and STATA software was used to perform econometric regression.
Results and Discussion
A zoom on onion production and consumption
The following Table 3 shows the countries that produce most of onion in the world. China and India are the primary onion growing countries, followed by the USA, Egypt, Iran, Turkey, Pakistan, Brazil, the Russian Federation, and the Republic of Korea [21]. Onion productivity is highest in the Republic of Korea (66.16t/ ha), followed by the USA (56.26t/ha), Spain (53.31t/ha), and the Netherlands (51.64t/ha). With world production of 74,250,809 tonnes from an area of 4,364,000 hectare, the average productivity across the world is 19.79t/ha. The international trade in onion exports is 6.77 million tonnes. The Netherlands is the highest onion exporter (1.33 million tonnes) followed by India, China, Egypt, Mexico, USA, Spain, and Argentina. Bangladesh, Malaysia, the Russian Federation, the UK, Japan, and Saudi Arabia are the major onion importing countries in the world [21]. According to Bethesda [28], West Africa represents less than 2% of the world output of onion. However, it represents 10±25% of the vegetables consumption in West Africa: its culture is ancient in the region and extends through several agro-ecological zones, ranging from arid Sahelian countries to humid coastal countries [29]. In Benin particularly, the production of the onion is relatively young (40-50 years) [30].
Table 3: The ten largest producers of onion in the world.
Source: FAO, 201221.
If there is no recent and clear statistics of the volume of domestic onion production, it should be noted that the production has been in galloping development of around 70,000 tonnes against 15,000 just 20 years ago. According to Baco [31] and Affomasse [32], the average area of onion production is 1 ha in Benin representing 57% of total area under vegetable crops. Onion is the market garden predominant crop in Benin since it is grown by more than 80% of vegetable growers. Similarly, the onion is a product consumed by all the urban and rural beninese. Urban consumption is estimated at 3.3kg of onions per year per person. This demand represents a commercial demand for 7000 tonnes per year. The consumption of rural populations against is estimated at 1.1 kg of onions per year per person, a rural consumption of about 14 000 tonnes. Although the production of onion is growing, the country is unable to meet domestic demand of around 45,000 tonnes [33] throughout the year, which explains the need to import the remaining, mainly by Niger, Gaya-Malanville border [34].
Source of supply and sector’s actors
Niger, Burkina Faso, Nigeria and Benin are the biggest onion supply sources to West African consumers. Niger is the largest producer and exporter of onion in West Africa and its commercial network allows to supply the major coastal markets of the sub region. In Benin, for against the import of this speculation is more important because domestic production cannot meet the needs of people. However, nationally the most productive zones are Malanville, Karimama and Grand-Popo followed by large cities (Cotonou, Sèmè-Kpodji, Ouidah, Dassa and Glazoué) that also produce a considerable quantity of onion as urban or suburban vegetable. The production of onion, like most agricultural crops in Benin knows two periods: a period of abundance (January to May) characterized by high availability of onions on the market. Currently, importers of other countries (Nigeria, Burkina Faso, Nigeria) are sourcing local onion to neighboring countries. The second period, that of solder (August to December) is characterized by the scarcity of onions and increasing the product price on the market. In Benin, onion varieties are encountered onion Galmi (or white Galmi onion), purple Galmi (or onion Agades) and Dendi onion of Malanville (red onion or local onion). Of these varieties, the white Galmi remains the favorite onion for Beninese consumers. Besides his characteristics that one knows (bigger than the red onion, relatively smooth, easier to maintain, less spicy (less acidic)), it is its organoleptic qualities that are most appreciated (the pleasant flavor that it gives to the sauce and the fact that it does not blacken). Regarding the sale price of onions, it knows a big fluctuation depending on the period as specified above. Thus, the bag of 100kg of acceptable quality onion (red onion Galmi) and the most appreciated (white Galmi onion) respectively cost 14,500 CFA and 19,500 CFA in times of plenty against respectively 50,000 CFA and 75.000 CFA in lean period. Table 4 shows the selling price of 100 kg bag of different onion varieties in the study area.
Table 4: selling price of 100 kg bag of cultivated varieties of onion.
Source: Results of investigation, 2018.
The actors in the Value Chain (VC): a multitude of stakeholders
The onion sector is composed of a large number of actors can be subdivided into four groups. It is the operators of the value chain; supporters of the chain; institutional actors; stakeholders and external facilitators
a) The operators of the value chain are most concerned. They are upstream of the value chain and are for the most part the first owners of the product. They represent producers, sellers or resellers, customers or buyers, processors, intermediaries, wholesalers and retailers.
b) The supporters of the chain are those that are not directly related to the process of production or marketing. They are actors who sell their services to producers, processors and traders. This is usually suppliers of inputs (seeds, fertilizers, pesticides), moneylenders or credit providers, pumps sellers and gasoline retailers, MFIs, intermediaries, carriers, of agricultural laborers, carters to transport the onion over a short distance etc.
c) Institutional actors are the actor’s group that provides institutional support in the context of a continuous improvement and regulation of the sector activities. These include state structures (MAEP, CECPA, SCDA, customary chiefs, customs, police, gendarmerie, research and extension services etc.). The finding done is that these groups of actors do not really invest in the development of the sector.
d) Stakeholders and external facilitators are actors who aim to improve the socio-economic life of rural populations. They provide financial and technical support primarily to producers. These are NGOs, development projects and programs, and specific fund donors.
Downstream of the chain, there is a last group of actors which is relatively large: The consumers. Onion Consumers can be at any level of the chain. He may be the producer and in this case he practices subsistence farming or firm that process onion for example. It is important to note that in this sector, the actors play complementary roles. The value chain would not be good if each group of actors not playing its role effectively. The following Figure 1 shows schematically the various actors in the onion value chain in Southern Benin: In fact, some of the onions harvested by farmers are sold to rural collectors or directly to local markets. Intermediaries and wholesalers, for their part, buy onion for the most part from rural collectors or local markets. The purchased stock is then transported to urban markets (for example the Dantokpa,Malanville and Parakou markets). However, it should be noted that some producers sell their crops directly in these urban markets. The following circuit (Figure 2) shows the onion commercialization process described by respondent’s producers. All actors in the chain are present and the complementary relationship they have in the onion value chain.
Figure 1: Groups of actors in the Onion value chain in Benin.
Source: Results of investigation, 2018.
Figure 2: Process of marketing of onion value chain.
Source: Results of investigation, 2018.
Potential and motivations of onion producers
The onion production in both North and South Benin is favored by some natural assets available in the country. It is:
a) Agro-ecological potential of Benin (soils, climate, topography, vegetation, drainage network).
b) The geographical location of Benin (proximity to other producing countries such as Niger, Nigeria, Burkina Faso and other countries onion importers like Togo).
In addition to the natural potential, certain provisions promote onion production in Benin. We can talk about:
a) Mechanized irrigation through pumps for irrigation, from the shallow groundwater.
b) Interventions of many projects to support the intensification and promotion of fruit and vegetable crops.
c) Applied search to identify ways of improving vegetable production.
d) The producer’s enthusiasm for onion cultivation due to its high profitability.
e) The supply in specific inputs (Improved seeds, products pesticides, fertilizers...) from the 2000s.
f) Existence of market garders communal groups.
g) The existence of an international market and many village markets.
Especially for urban producers surveyed (Cotonou, Seme- Kpodji and Grand Popo) these are the following benefits that motivate these market gardeners to engage in the cultivation of onion.
a) The high financial profitability of onion production
b) More favorable conditions for the intensification of production systems, due to land pressure and pluriactivity that promote the enhancement of complementarities.
c) The geographical proximity to markets (Dantokpa market for example) reduces transportation costs compared to remote rural areas.
d) The reduction of energy and time in getting goods to consumers: transport, storage, especially for fresh produce.
e) The reduction of post-harvest losses due to the proximity of production areas.
f) Better product quality in terms of freshness for perishable products.
Socioeconomic and demographic characteristics of the surveyed producers
In southern Benin, specifically in the municipalities of Grand-Popo, Sèmè-Kpodji, and Cotonou onion production is predominantly male (78.3% of men against 21.7% of women). These producers have an average age of 28 (±08) with a tenure of 06 years (±04). Moreover, in the study area average household has 04 persons (±02) and 03 (±01) agricultural assets. Levels of literacy and education of the surveyed producers are more or less acceptable in public Grand-Popo, Sèmè-Kpodji and Cotonou. Note also that 50% of producers are active members of a group against a second half not belonging to a producer group. Overall, there are 81.7% literate farmers and 91.7% educated farmers. In the study zone, onion producers have an average area under crop of 2785.48 m2. These areas are obtained either legacy (61.7%) or rent (38.3%). To operate their farms, producers face two types of loads in their exploitations. These called ‘’variables’’ and those ‘’fixed’’. These charges are respectively 93 CFA/m2 and 5.76 CFA/m2. Table 5 shows the statistical variables characterizing respondents.
Table 5: Statistical variables characterizing respondents.
Source: Results of investigation, 2018.
Financial Performance of onion production
To assess the financial performance of onion production, analysis of operating farmers account was made. Thus, the results of the analysis reported in Table 4 shows that onion production is profitable in southern Benin as the average Net Operating Income calculated is positive (689 CFA/m2>0). These results are consistent with those of MAHRH [35] and Fanou [36] whose studies finally led to the conclusion that onion production is profitable. Table 6 below shows the operating account of onion producers. Note that the financial performance indicators used were calculated in CFA/m2.
Table 6: Financial performance indicators calculated.
Source: Results of investigation, 2018.
Determinants of onion production profitability
The multiple linear regression model performed to identify the determinants of the onion production profitability is generally significant at the 1% level (p=0.0000<1%). Variables such as age of the producer, the cultivated area, the level of literacy, membership in a group, the experience, and fixed costs are those which influence the onion production profitability in southern Benin. The variables of the model that are not significant are: household size, the number of farm assets, access to land and the level of producer instruction. Age has a positive significant effect on the threshold of 1% on the profitability of onion production. We therefore deduce that more the producer is old, more sometimes he took advantage of its business. The producer thus gains experience with time. Which experience allows him to improve the financial performance of his exploitations? However, these producers are very few open to new technologies that are proposed to improve their income. They therefore remain conservative. This conclusion stems from the fact that seniority has a negative significant effect on the threshold of 1% on the profitability of onion production. It is the same for literacy that has a negative and significant effect on the threshold of 1% on the profitability of onion production in southern Benin. These results are contrary to those obtained by Labiyi [37] which identify education as a determinant of economic efficiency of resource allocation in soybean production in Benin. Membership of the producer group has a positive and significant effect at the 10% threshold on the profitability of onion production.
Thus, onion producers who are members of a group have higher net profits than the others because they will benefit from certain advantages. We can highlight the sharing of information, mutual assistance and the expertise that a producer can take the other being a member of an onion producer group. These results are consistent with those of Tovignan [26] who found that producers who are members of a group have a higher net profit than others who do not belong to any group. Unlike the membership of a producer group, the wheat area has a negative and significant effect on the threshold 5% on the profitability of his exploitations. Thus, over the cultivated area, the less the onion producer benefits from his activities. The producers do not manage to meet the obligations belong to large farms. Note that these results contradict those obtained by Tovignan [26] who deduced that producers who have a large area under cotton production have a higher net profit than those having a small area. It is the same for the fixed charges that have a negative effect and significant at the 5% level on the profitability of the production of onion. Therefore, the more these expenses amounted less the producer benefits from his plantation. Table 7 shows the results of estimation of multiple linear regression model performed.
Table 7: Estimated multiple linear regression models.
*** = Significant at 1%; ** = significant at 5%; * = Significant at 10%
Source: Estimation Results, 2018.
Source: Estimation Results, 2018.
Onion importance for farmers: The onion producers constitute the largest actors group in the in the sector. Therefore, this production contributes to job creation for over 75% of agricultural assets during market gardening seasons in different regions of the study area. At the household level, onion cultivation is an important source of income and contributes to food and income security for producers. The onion is often the biggest source of cash income and helps to meet the needs of families. At Grand-Popo, as in all the investigated cities (Cotonou, Seme-Kpodji), deferred selling garden products, particularly onion is a powerful lever to support the food security of urban populations. As an activity of counter-season, onion belts allow producers not only to self-employed, to ensure household food security but also to receive significant revenue.
98% of surveyed producers recognized that onion production has resulted in many changes in their socio-economic life. In general, improving purchasing power has had a positive impact on food security, education and health situation of farmers. The onion income often also generates new income-generating activities such as petty trading, farming and others. Culturally, onion helps to prepare for marriage or pilgrimage to Mecca. Woman A and Man B two onion producers of Grand Popo and Cotonou asserted: ‘Onion production is very important to us. With this production I am more and more autonomous. I depend less on my husband. I don’t expect him anymore before buying coal or kitchen utensils. I do all my small expenses through this production income and I can even pay my tontine which was very difficult for me when I was not market gardner’ (A).’Onion is very profitable. I produce a lot of vegetables but little counter-season onion i produce, I can invest in my livestock and it is the same money that allow me paying my three children’s scholar fees each year’ (B).
Importance for input suppliers and other service providers
To carry out their activities, onion producers have much contact with a range of actors that are upstream in the value chain. Producers purchase pumps and pipes, gasoline, seeds, plows and small equipment, fertilizers and pesticides. Then, there is all kinds of economic relations between producers and suppliers, including the informal credit provision. The majority of the production costs regarding labor. Indeed, the onion sector creates many jobs, often for the poor. There is a redistribution of income from large producers to small producers, landless people in rural exodus through the agricultural labor. In most cases, producers raise funds to run production without financial institutions credit. Man C a Cotonou seed seller confirms these observations through these words:
‘In general market garden production allows us seed sellers to us to quickly sell our products in the city. Most of the time, people come to take the seeds of garden crops like onion and tomato. Many people feed through production. Carriers, agricultural equipment vendors, laborers ... ‘ (C)
Health and nutritional importance for producers-self consumer
Some market gardeners (6%) produce the onion just for its nutritional and health importance. For these producers, onion is a valuable culture that they not only produce for sale but also and especially for its therapeutic properties, organoleptic qualities and anti-erosive effect. Three onion self-consumers Men D, E and Woman F justify the importance of the Niger’s purple gold in their diet and their health situations.
‘The onion gives the taste and flavor. You can prepare a good sauce without putting a little onion. It is sometimes used to garnish the food or mitigate the effect of spicy chili’ (D)
‘The onion comes in many herbal tea in traditional therapies. When crushed with other products such as garlic, Goussi and others that can heal digestive problems, cancer, liver, rheumatism. It also helps to regulate menstruation cycle of women. My grandfather suffered from high blood pressure but with the adequate consumption of onions, it’s much better for a while ‘ (E)
‘The onion can be used in all forms: raw for salads, for example, cooked for frying or sauce, cut, beads, rapped or crushed. Onion juice can treat skin acne and provides a smooth and beautiful skin, as well as for hair growth and maintenance, colds, coughs, to sexual arousal’ (F). Figure 3 presents the advantages of onion production in southern Benin.
Figure 3: Importance of onion production in southern Benin.
Source: RResults of investigation, 2018.
Obstacles and expectations of onion producers in south benin
Onion production despite the many benefits that it brings to market gardeners, is facing various difficulties. Analysis of the Table 8 shows that the major constraints identified in onion production in southern Benin are institutional organizational, financial, land orders, and those directly related to production. The market gardeners interviewed affirmed that these constraints were also those for which it was essential that one find solutions. Among the most relevant constraints mentioned by farmers are: the lack of specific inputs for vegetable (onion), strong parasite pressure not control pests and vegetation in stock, the still extensive production system and low yields, low technical capacity of producers, difficult access to credit, poor organization of the onion sector in Benin, the lack of organization of market gardeners in general, deforestation and soil impoverishment, difficult harvest evacuation due to the degradation of most of the tracks, the low involvement of technical extension services, low supply of local services for the supply and distribution of specific inputs, lack of arable land, delay and poor distribution of rainfall in time and space and finally shortening the rainfall cycle.
Table 8: Constraints of onion production and relevance of these constraints by producers.
Source: Results of investigation, 2018.
These results are in the same direction as those obtained by Gotoechan-Hodonou [38] in northern Benin, attic of the onion production. Baco [31] also identified similar constraints in their studies in the field of seed production. The context of the difficulties faced by onion farmers in southern Benin is similar to the case of Niger where the constraints identified were the poor quality and availability of inputs and equipment, problems of access to certified seeds, low financial capacity producers, poor access and insufficient agricultural credit, poor mastery of production techniques, a lack of modern storage infrastructure and huge losses in stock, the traditional character of the transformation, the lack of appropriate packaging the variability of the weight of the bag, the existence of different methods of fixing and price volatility, weak infrastructure and road harassment [39], market saturation after the third cycle of production, the lack of regulatory mechanism supply and demand and competition from foreign imports in the sub-region39. However, among the identified constraints, are institutional, organizational and financial coming to the forefront. It is therefore imperative that the public and private agricultural institutions orient their policies in a process of facilitation and development of onion production in Benin. Despite the efforts, the producers of South Benin still face enormous difficulties that significantly hamper production. Producers have issued many approaches that could improve production conditions and therefore their living conditions. The most important approaches proposed by the producers were related to the main constraints mentioned. Man X and Woman Y, two onion producers argued about it, respectively:
‘We know that we are in cities, so with regard to the land is lacking but we did not complain too much. But there are things the government can do to make our job easier. For example, they can create agricultural credit services for onion producers, they can put us in group; can also be formed on the most effective technologies of production. It is necessary that the state helps.’ (X)
‘It is difficult to produce in cities, but we mostly need help. We receive no government support. Nobody supervises us, we cope alone. We would like the state begins to take us for help. The state focuses on cotton or cashew forgetting that gardening provides food security especially those urban populations. I don’t know if they know but especially gardening onion production is more profitable than cotton. I have produced cotton in the North before coming south for work. But finally I gave myself to the production of onion because it gives me more revenue especially against season. I strongly urge agricultural institutions to find us improved varieties of onion seeds, financing for irrigation and the launch of activities, organizing into cooperatives and especially we organize training courses.’ (Y)
Conclusion
Onion production is a very important sector which may be considered not only to ensure food security of urban populations but also to improve the living conditions of the producers. This production proves very financially profitable for producers in southern Benin. In addition to its financial performance, it also impacts on social, health, nutritional and environmental producers living. It allows a large number of producers and a considerable number of actors as service providers to have substantial income. However, it would be interesting for agricultural policies to develop actions to limit constraints of this production in southern Benin.
0 notes
Text
Lupine Publishers | One plus One is More Than Two? Reaping From the Synergy between Indigenous and Scientific Knowledge to Climate Adaptation in Ghana
.

Abstract
The rapid escalation and dangers of global climate change is bourgeoning astronomically and thus places colossal demands on stakeholders to marshal innovative ways and processes for connecting knowledge systems to tackle its negative upshots. These demands in contemporary climate related discourses have led to calls for the integration of indigenous knowledge (IK) and scientific knowledge (SK) sources in climate adaptation efforts. However, studies that advocate and utilize the co-production of IK and SK as the way forward to climate adaptation efforts in Ghana remain scanty. This paper supports by reporting promising outcomes in economies that have embraced the co-production of IK and SK into their adaptation action plans. It is envisaged that this paper will spark stakeholder discussions and subsequently galvanize efforts leading to the integration of both IK and SK into adaptation policies in Ghana. Thus, one plus one can be more than two should Ghana thread on the path of knowledge co-production in climate adaptation initiatives.
Keywords: Global climate change; Indigenous knowledge; Scientific knowledge; Climate adaptation
Opinion
Copious evidence supports climate change-induced decline in crop and livestock productivity in the global landscape [1,2] , more especially in weather-sensitive agricultural production regions such as sub-Saharan Africa where those most vulnerable to these impacts are the indigenous people whose source of livelihood depends solely on small-scale farming. Presently, the agricultural sector contributes 22% of Ghana’s GDP [3] and employs 42% of the economically active workforce [4]. In 2017, Ghana’s GDP recorded a growth rate of 8.5%, with the agriculture sector expanding from a growth rate of 3.0 percent in 2016 to 8.4 percent in 2017 [5]. Nonetheless, the agricultural sector is extremely imperiled as the EPA of Ghana predicts that the country stance to lose about 81.3 square meters of arable land yearly, and yields of maize and other cereal crops will reduce by 7 percent by 2050. This creates the urgency for best-fit climate adaptation practices to aid adaptation efforts by small-scale farmers, on whom the whole country depends mostly for food supplies. Thus, contemporary adaptation planning necessitates access to the preeminent available knowledge, whatever its source. Unfortunately in Ghana, there exists low levels of awareness and poor understanding of climate change impacts coupled with significant knowledge gaps about climate change processes [6]. These realities have mired effective societal decision making of climate change adaptation and mitigation. There is therefore the need to create such awareness and also integrate indigenous climate change adaptation and mitigation planning with sustainable development and poverty reduction goals [7].
In the light of this, countless developmental projects are known to have been created, funded and accomplished by outside resources and presented into rural communities with the hopes and promises of impacting the lives of small-scale farmers. Assessments indicate that these projects failed to recognize the culture of the people and resulted in low participation and success rates [8,9].As a consequence of these letdowns, there was a growing interest in the incorporation of indigenous knowledge (IK) and traditions to increase project participation rate and provide environmentally sound approaches to development. The main reasons for this paradigm shift towards indigenous knowledge and practices were (i) IK stem from the cultural context of the people concerned, (ii) IK evolves in close contact with the specific environment conditions and, (iii) IK is based on intimate knowledge of the environment in the traditional societies Mathias, 1995. Also, according to Adugna [10] and Woodley [11], IK adds value to climate change studies in the following ways; (i) IK systems create a moral economy, (ii) identifies a person within a cultural context, therefore providing decision-making processes or rules of thumb to be followed based on observed indicators or relationships within events, (iii) indigenous knowledge is progressively demonstrating a semblance with scientific methods as many ideas in indigenous knowledge that were once viewed as primitive and misguided, are now seen as appropriate and sophisticated, and (iv) indigenous knowledge systems provide mechanisms for participatory approaches. Valuable local knowledge of relevance to climate change assessment and adaptation is held by rural societies [12]. Thus, these sources see farmers in the agriculture sector as innovators with a sophisticated body of ‘indigenous knowledge’ comprised of practices gained through experience and transmitted through members of a community [13,14].
Extensive evidence of academic literature that documents how smallholder farmers use knowledge systems to adapt to climatic trends in Africa exist [15-17]. Owusu Ansah [18] in a study that examined indigenous knowledge sources, potency and practices to climate adaptation in the small scale farming sector cited 49 sources to indigenous knowledge in an article for the Journal of Earth Science and Climatic change. Crate [19], referenced 136 sources on climate change and culture in an article for the Annual Review of Anthropology. The United Nations Education, Scientific and Cultural Organization (UNESCO) and the United Nation University (UNU) [20] cited over 300 references in the 2012 report “Weathering Uncertainty: Traditional Knowledge for Climate Change Assessment and Adaptation”, which offers a synopsis of key issues and areas of research on indigenous knowledge. UNFCCC [21] ascertained the importance of indigenous knowledge conservation as key to the benefits of an ecosystems-based approach to climate adaptation.
The rapid acceleration and enormity of global environmental change places colossal demands on humanity to marshal innovative ways and processes for connecting knowledge systems that are conducive to sustainability learning and recognize the convolutions of socio–ecological systems and the challenges of the anthropocene [22,23]. In recent years, there has been a growing awareness that scientific knowledge (SK) alone is inadequate for solving the climate crisis [24] which has led to growing recognition of local, indigenous, traditional knowledge as an important source of climate knowledge and adaptation strategies. Byg [25] contend that it is erroneous to understand social ecological issues based on SK alone. Thus, the role of indigenous knowledge in climate adaptation in Ghana is required to buttress scientific knowledge adoption [26]. On the other hand, the challenges brought on by global climate change are beyond the lived experience of all knowledge holders, whether scientific or indigenous [27,28]. Owusu Ansah [18] opined that the utilization and efficacies of IK remained indubitable for decades but owing to recent unpredictability in the observed changes in the environment, coupled with the fast increasing susceptibilities of communities to climate change, absolute reliance on the sources of indigenous indicators for correctly predicting environmental changes have become more difficult and obsolete for farmers. Also, the potencies of the identified IK adaptation practices for yielding perfect responses to changes in the environment have become riskier and challenging as time goes by. Even though the relevance of indigenous knowledge sources and practices remain indispensable in the struggle to adapt to climate change, efforts will be more promising should there be a co-production of other knowledge sets (science based) to buttress established positive practices in IK Owusu Ansah [18]. This has led to several calls for interdisciplinary climate change research in modern studies [29-31]. Gratani et al. [32], show that integration of traditional knowledge through scientific validation can be respectful and empowering. To succeed, we cannot afford to lose insights and information originating from multiple knowledge systems [33].
However, studies that advocate and utilize the co-production of multiple knowledge systems that integrate IK and SK as the way forward to climate adaptation efforts in Ghana remain scanty. Aside from the relatively significant physiognomies of spatial locations in climate change manifestations on the global scale, existing literature on the subject is unsatisfactorily scanty in the context of sub-Saharan Africa and Ghana in part [18]. Thus, this paper reviews studies that have presented promising findings from the incorporation of IK and SK elsewhere to inform new approaches to climate adaptation in Ghana. In the face of climate change risks and impacts that remain uncertain and unpredictable, there is a growing need for policies and action that foster the co-production of new knowledge sets, based upon collaborative efforts involving IK and SK holders. Co-management regimes that bring communities and the State together to jointly manage natural resources, have provided an important arena for the development of knowledge coproduction [34-36].
Reaping From the Synergy: One Plus One is More Than Two
Studies by scholars provide examples from across the globe where the recognition of complementarities across knowledge systems have advanced the understanding, and in many cases improved management, of ecosystems, critical natural resources, and biodiversity. In Africa according to Guthiga and Newsham, (2011) and Kalanda Joshua et al. [37], rainmakers in the Nganyi community of western Kenya and farmers in Nessa Village in southern Malawi have worked in partnership with meteorological scientists to create integrated forecasts that are being disseminated by both indigenous and conventional methods to enhance community resilience to climate change and its adversarial upshots. Uganda [38] highlighted the maintenance, protection and continuity of the use of indigenous knowledge in the management of natural resources as a project in its National Adaptation Programmes of Action (NAPA). Also, Ethiopia included the documentation and advancement of indigenous rangeland resource management as a way to enhance resource management practices. Mozambique incorporated the role of local forecasting knowledge in strengthened early warning systems for detecting changes in the environment. The United Republic of Tanzania [39] encouraged the promotion of indigenous knowledge in the agriculture sector.
In Cape Verde, the Ministry of Environment and Agriculture promoted the need to understand traditional knowledge in relation to variations in the water cycle and agro-silvo-pastoral production systems. In 2008, Liberia recognized the necessity to better integrate indigenous and effective coping strategies into its national development policy and planning in order to better respond to the growing incidence and intensity of climatic shocks so that the country will be in a better position to address the situation within the context of its existing sustainable development policy processes. In West Africa, an initiative has been piloted by the Association for Indigenous Women and Peoples of Chad, the Indigenous Peoples of Africa Coordinating Committee and UNESCO, which brought together pastoralist M’bororo weather forecasting knowledge with scientific seasonal and long-term forecasts. This initiative is grounded on a sequence of discussions and exchanges between indigenous and scientific knowledge holders, with the support of indigenous knowledge experts [40]. This initiative occasioned instances where Meteorological services integrated indigenous knowledge, such as phenological data, into their projections to provide users with more broadly based information [41]. In Kenya and Ghana, multiple avenues of culturally appropriate communications are used to ensure that advisories and forecasts are disseminated to farmers and livestock keepers [42]. Also, CARE International’s “Joto Afrika: Climate communication for adaptation” provides an example of a platform where SK provides data for IK holders to assess their decision-making on when to plant. By providing the capacity to develop rainfall records from their own community rain gauges, agro pastoralists can take informed decisions on planting dates.
Based on a report by ACIA [43], The Arctic Council’s Arctic Climate Impact Assessment is a successful approach to the collaboration of IK with SK that resulted in the incorporation of a broad set of observations from indigenous peoples alongside a regional assessment of the impacts of climate change in the Arctic. This brought together representatives of IK and SK holders on the Artic Council to cooperate and integrate both knowledge sources into a report that produced two chapters on indigenous perspectives and incorporated nine case studies into the final report. Such collaboration led to a robust knowledge base on the impacts of climate change on the Arctic, with indigenous and scientific knowledge supporting each other [43,44].
Conclusion
Transforming governance of biodiversity and ecosystems toward sustainability will require a rich understanding of the complex interactions of people and nature at different scales, and of the drivers and feedbacks that affects these interactions [45]. The rapid acceleration and enormity of global environmental change places colossal demands on humanity to marshal innovative ways and processes for connecting knowledge systems that are conducive to sustainability learning and recognize the convolutions of socio– ecological systems. We argue that to achieve this, the science-policy community needs to embrace a diversity of knowledge systems, and when connecting to knowledge from local or indigenous communities, it must think beyond aspects that can easily be fitted into conventional models and frameworks. Also, the partial success of the use of traditional knowledge in coping with climate change leads to the conclusion that a healthy relationship between scientific knowledge and traditional or indigenous knowledge – which both have their limitations – is desirable, especially in developing countries where technology for prediction and modeling is least developed [46]. We therefore suggest that, in the face of climate change risks and impacts that remain uncertain and unpredictable, there is an increasing need for procedures and measures that nurture the coproduction of new knowledge sets, grounded on collaborative energies encompassing community-based knowledge holders and natural and social scientists to tackle the climate change bottlenecks that engulf Ghana [18]. Our study demonstrates that understanding and use of climate adaptation strategies should be overarching in the context of Ghana to incorporate indigenous and scientific knowledge to achieve a counterbalance. Through this, the strengths of both knowledge sources will combine to produce promising returns that could be achieved individually; one plus one is more than two [47,48]. Therefore, an understanding established on multiple evidences can afford stronger confidence in conclusions where knowledge and understanding converge across knowledge systems. Our findings accentuate the quintessential requirement for efforts that embrace continuous training and education on climate-smart farming practices, on-hand provision of extension officers and up-to-date meteorological data, constant supply of farm inputs and inculcate partnerships and periodic organization of regional-district-community workshops or forums that bring together IK and SK holders to forge new set of measures and mitigating strategies to adeptly tackle climate-induced challenges on the agriculture sector of Ghana.
For more Agriculture Open Access Journal articles Please Click Here:
https://www.lupinepublishers.com/agriculture-journal/
0 notes