
tradevision
Trade Vision
I want to teach you how to be successful in trading.
16 posts
Don't wanna be here? Send us removal request.
Last Seen Blogs


Text
Using a stop loss; still my Achilles heel
I think I can say I’m a pretty good trader but there is still one thing that I find hard to do and that’s taking a loss. My skills in technical analysis are good and I have a (some) strategy to trade the markets. When I would explain someone else where to enter and where to exit and why I very clear but still taking a loss may be my Achilles heel.
First let me start by explaining a little bit about my trading. I start with multi timeframe analysis on the weekly chart and then I move to the daily and 4 hour chart. Below that time frame I don’t analyse/trade. When I for example see e classic swing trade setup I try to enter on the pullback and my stop is at the previous low. Also a trend line can give me some direction on where to enter and/or exit.
This sounds very easy and if I would do this consistently my losses should be limited. Don’t get me wrong, my trading is profitable but here is the thing I’m doing at the moment with my stops. When a pattern breaks and my initial setup is not accurate anymore I start to read the chart again. My initial stop on the 4 hour chart sometimes gets moved to a different area in the daily chart. Or I wait for more information on the new direction. Often price comes back for a retest or a pullback. That should be a second opportunity to exit but for some reason I have my Take Profit somewhere where I still make a small profit instead of a smaller loss. A third thing I do is start hedging the position by opening a position in the other way to cover my losses. At the end this doesn’t solve the problem it just extends the losses with a opposite trade next to it. It feels less bad because of the hedge but a the end of the line you can better have money/margin free for better trades.
I’m sure a lot of people recognize one or all of these reaction to handling a loss and I think we can all agree that none of them is the right solution. Let me give you a recent example of a trade I should have gotten out of already but that I’m still in with a recently added long to cover my losses. Once price starts reversing again I won’t be able to take that trade because I’m already exposed to the downside to much and I have to miss out on a great opportunity.

Conclusion: DO YOUR ANALYSIS AND DETERMAIN WHERE TO ENTER AND WHERE TO EXIT. DO NOT AJUST THE SETUP AND NO MATTER WHAT HAPPENS: PLAN YOUR TRADE AND TRADE YOUR PLAN!
#stop loss#stoploss#forex#technical analysis#price action#naked trading#trading forex#forex trading#forex help#take profit#forex profit#risk management#risk reward#trader#trading#trading education#trade vision#forex market#forex system#forex strategy#trading system#trading strategy#make money from home#financial freedom
0 notes
Text
Followers questions
#1 Should I buy or sell?
I get these questions a lot (no joke). I always take the time to explain that in trading there is nog way of just saying now you should buy or sell. At least nog in my approach. When I look at a new market I take the time to analyse it on multiply time frames starting at the weekly and moving my way back down to the daily and the 4 hour chart. On those different time frames I draw support and resistance areas, trend lines, supply and demand zones, I look for chart patterns and I add some indicators to confirm what I’m seeing on price action. When all that is done I have a clear picture of what’s going on and then I can say where I’m willing to enter and exit the market. This takes up to 20 minutes at least so sending me a message and asking me if you should buy or sell right away is for that reason a bit complicated. And to be honest, if you’re asking others questions like that I get the feeling you don’t have your own trading under control. I want to help other become consistently profitable. So let’s work on your technical analysis skills to become more profitable.
#2 What’s your strategy? ‘I trade RSI’….
No sir, you do not. RSI (relative strength index) is one of the thousands of indicators that can be used in trading to help you get a clear picture of what is going on. Indicators add information or give you confirmation on things you are seeing on the charts but you never trade just an indicator. No never. When people start explaining their ‘strategies’ they often start talking about how they’re trading indicators but indicators are a ‘part of’ a strategy. The only way I can explain them the use of an indicators is by showing them the bigger picture and once again I upload a video of 20-25 minutes of an extensive technical analysis where I use one or two indicators around the 18th minute to confirm what I was already pointing out on the charts/price action. So remember, indicators are tools to add information to support your theory/analysis.
#3 I see a reversal because the previous low (or high) got broken and we’re starting to see more lower lows (or highs). Hold on hold on, wait a minute….
Yes when we see those shifts in patterns it attracts our attention but we need to see more first before we jump into any conclusions. For example often when support gets broken on the 4 hour chart (because that’s what happens when we see a break of the previous low) the low on the daily can still be intact. Or a moving average or a trend line can still hold and the bigger trend is still in tact. Of course it also depends on what time frame you’re trading. In this scenario there is money to be made in the short term but the overall picture doesn’t change that fast. So when you start seeing things like that you shoul start paying attention but you have to look for more clues of what’s going on. Often people get burned in the market for jumping into trades to early.
#forex trading#trading forex#follow#questions#followers questions#technical analysis#trading tips#forex tips#forex help#trading help#forex#trading#trader#traders#trade#trading education#forex education
0 notes
Video
youtube
Trend Trading
I’ve discussed Swing trading and Rang trading in my previous posts and today I want to share a new trading strategy called Trend Trading. We all know the saying “The trend is your friend, until the end when it bends” and it’s pretty obvious that you increase your edge when your trading with the trend. That way the probability that the move will actually go in your direction and hit you take profit is just a little bit more likely overall. But how do you maximize your profit with a Trend Trade? First you have to find a market/instrument that is trending. As I explained in my Range Trading post most of the time markets are moving sideways so for Trend Trading you have to find a stock or forex pair that’s moving. Looking at price action higher highs and higher lows or lower highs and lower lows show an up or down trend. Indicators like the moving average can tell you if a markets is trading to when price is above or below the moving average. I personally think price action in combination with indicators can tell you the direction and the strength of a trend. Don’t forget to check the fundamentals as well because when technically everting lines up but the earnings miss target by a longshot or a country cuts their rate without a clue price will react.
Now that you’ve found a trending market you should look for an entry. In my previous posts I discussed how to enter on pullbacks when Swing trading or trade within a range when Range Trading. The ideal moment to enter a Trend trade is when a strong stock just finished a major correction to the 61.8 Fibonacci retracement level. Why? Because in Trend trading you’re aiming to let a position run for as long as possible. If you get in on the first pullback you see the probability of reaching that price again when a major correction sets in is likely. In that case you wasted your time and money on the trade when it hits you break even or small profit or stop loss. I also look for entries on the weekly chart because you want to enter on the trade as low as possible. That way your long term trend trade won’t get touched (high probability that it won’t get touched) when price makes another correction. A lot of beginning traders focus on short term moves. They want to take profits. When you can look at the bigger picture you know when price is at a level where you should capitalize on the bargain the market is giving you. Don’t forget that just one trend trade can give you your years target. Even though I would bet on just that I think it’s wise to take a few trend trades next to you swing and/or range trades.
#Rang trading#swing trading#trend trading#trading#forex#forex trading#trading signals#forex help#forex course#forex market#forex profit#forex education#financial education#trading education#fxtrader#fxmarket#forex ideas#trading plan#trading strategy#forex plan#forex strategy
0 notes
Video
youtube
Weekly Analysis 26-02-2017 EURUSD, AUDUSD, AUDNZD, USDCHF
#eurusd#audusd#audnzd#usdchf#forex setup#forex signals#how to trade#trading#trader#forex trader#trading opportunities#oppotunities#trading setup#dollar#supply and demand#forex help#forex online#forex profit#forex#forex analysis#technical analysis
0 notes
Photo

Alibaba was a perfect range trade until yesterday when price broke the range. Today it pulled back into the range showing a false break out and a continuation of the range trade.
#range trading#trend trading#breakout#breakout trading#tradevision#Trading strategy#trade setup#supply and demand#supply zone#demand zone#take profit#stop loss#trading#forex#tradingstocks#stocktrading#forextrading#forexsignals
0 notes
Photo

Check out my detailed technical analysis of the forex pair AUD/NZD. It shows a nice Reversal Trade with great Risk:Reward.
youtube
#reversal trading#trend trading#swing trading#forex#learn forex#forex help#technical indicators#technical analysis#price action#supply zone#demand zone#support and resistance#risk reward#bulls and bears#trading opportunities#RSI#bollinger bands#moving average
0 notes
Video
youtube
Trading Strategy: Range Trading
In my last post I explained the trading strategy ‘Swing Trading’. To continue the trading strategy series I want to share the ‘Range Trading’ strategy. To me this is also a strategy to manage risk and get clear entry and exit signals.
Multiple timeframe analysis
Just like all the setups I want to know the current state of the market so I start at the weekly chart to see what the overall trend is. Then I zoom in to the daily chart to see where the market is on that time frame. Going through the different time frames I draw trend lines and support and resistance lines to get a feeling of where price will likely give a reaction. The last time frame I zoom in to is the 4 hour chart, this is where I make my decisions.
Define a range
What I’m looking for in a range trade is a market that isn’t trending. I’m looking for a market that is moving between a well-defined support and resistance area. When the overall trend is up, it feels most comfortable to go long near support but with range trading you can go short as well as long as you manage your risk with a hard stop loss above resistance. Of course when you’re going long your stop loss should be below support to manage your risk. Your take profit is very clear as well. This should be on the opposite side of your entry within the range. So when your long from just above support your take profit should be just below resistance with the range. And of course the same goes the other way around when you’re going short.
As you can see Range Trading gives very clear entry and exit (stop loss and take profit) signals so managing risk is very clear in the strategy. Once price breaks out of the range the strategy is over and you can switch to Swing Trading. Just wait for the retest of the previous resistance and if it acts as support and price doesn’t fall back into the range the market went from ranging (moving sideways) into trending.
#range trading#trading#forex#Stocks#trend trading#swing trading#trading strategy#forex strategy#technical analysis#stop loss#take profit#forex education#trading plan#trading course#forex mentor#trading mentor#how to trade#work from home#financial freedom
0 notes
Photo
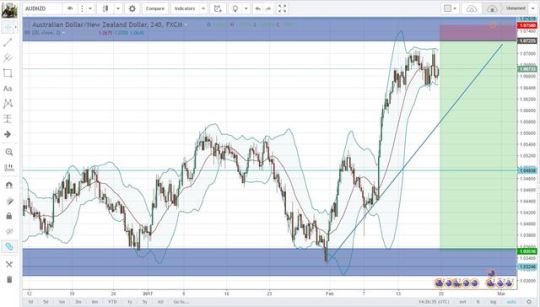
Price is running into a supply zone where price ran into a couple of times over the last year. A turn is likely also because the RSI is showing some major divergence. There is Great Risk:Reward in this setup because price is close to an important resistance and supply zone and there is a lot of potential to the downside.
To take this trade I personally will wait for another move up and probably a squeeze over there. Once price action is showing lower lows, and the moving average and the trend line gets broken the to me the move is confirmed.
#forex#audnzd#reversal trading#price action#trend lines#lower low#lower high#supply zone#demand zone#technical analysis#bollinger bands#moving average#rsi#relative strength index#trading#trader#trading forex#forex trader
0 notes
Link

Also follow me on Instagram for daily:
- Trade Ideas
- Trade Education
- Trading Analysis
- Trading Tips
- Trading Plan Videos
- Trade Motivation
- Trading Books
- Trading Movies and Documentaries
- Forecast
and more
#forex#trading#tradingforex#instagram#trading help#trading stocks#trading education#motivation#books#technical analysis#trade ideas#forex course#forextrading
0 notes
Video
youtube
Trading Strategy: Swing Trade
Now that we’ve talked about setting goals, the basics of technical analysis, indicators and how to manage a trade it’s time to put everything together in an actual trading strategy. In this video and article I will explain the Swing trading strategy.
What is the trend?
The first thing you have to know is the trend of the forex pair or stock you want to trade. Looking at price action a market that’s making higher lows and higher highs in an uptrend and a market that is making lower lows and lower highs is in a downtrend. A market that is moving in a range is not what we’re looking for when we’re looking for an instrument for Swing trading. When you’ve found a trending market draw in some trend lines and horizontal lines (support and resistance) to get a picture of the important price levels you need to know for you entries and exits. Also you can add an indicator to get extra information on where price is on the charts so you know when to enter or exit (take profit or stop loss).
Entry and exit
Now that you know the trend you need to locate the price level where you want to enter. When price pulls back to the trend line or the moving average that can be a great place to enter in the direction of the trend. A stop loss can be set below the trend line or the moving average but also below the previous low when you’re looking at price action. Another way to exit a trade, the preferred way to exit a trade, is at a take profit. Your take profit can be at the opposite trend line probably at a new higher high or for example at the outer Bollinger band.
Maximize profits
A way to maximize your profits in Swing Trading is to close a part of your position at you take profit target and let the other part run and move the stop loss with the trend. As long as price doesn’t break a previous high or low (depending on the trend you’re in) the position will keep running. On every pullback you can re-enter and repeat this setup.
#swing trade#forex#trading plan#trading strategy#forex strategy#stock trading#uptrend#down trend#trendtrading#stocks#forex help#forex mentor#trader#trading
0 notes
Video
youtube
Manage Your Trade
In the previous videos of the Trading Plan series we've talked about setting goals and knowing what you want to get out of trading. Also we've discussed how to read the charts based on price action and also by adding technical indicators to confirm your ideas. Now it's time to look at actually taking a trade and managing it for optimal profit and of course minimal risk of a loss.
Enter a trade
Once your analysis points out a nice opportunity and price comes to a spot where you want to enter the trade its time for action. Make sure you know where you want to get in but more important make sure you know where to take you profit as well as where you want to get out of the trade when your setup doesn't fit your criteria anymore. Your entry can be on a trend line a support or risistance line depending on your strategy. You can take the trade with a pending order or you can zoom in on the lower timeframes to find an entry signal. Just make sure you have the answer to all your questions before entering the trade because when you have to think about that once price comes near your take profit target or near your stop loss your judgement won’t be as objective anymore.
Take Profit
Your take profit can be somewhere around the opposite trend line of where you’ve entered. Or near the next resistance once price moves in your direction. When you are a trend trader you take profit can be very far away and you trade can be open for weeks, months or maybe years. When you’re a swing trader your take profit will be around the next area where price will likely struggle because of the past (support, resistance trend line). When you’re a range trader your entry and exit are well defined by the top and bottom of the range.
Stop Loss
Just looking at price action you stop could be just below the previous low (because when price starts to make lower lows the momentum can shift from up to down and your setup is invalid). When you draw support and resistance lines those can act as stop loss as well. The same goes for trend lines but also technical indicators like a moving average can act as an stop loss criteria. Some people also use mental stop losses. As long as the overall trend is still in their favour they don’t see why they should exit because price will likely resume the trend they think it was going in.
Lot size
Depending on the setup you have your lot size gets chosen for you. When an opportunity presents itself where your entry is very close to your exit/stop loss your lot size can be bigger than when your entry and exit are further apart. The percentage you’re willing to risk on your total account in combination with the distance of your entry and exit makes the size of the lot you can trade.
Maximize your profit
When you’ve located a trend and you’ve entered a position you can look for more entries as long as the trend continues. If you for example get the change to enter 3 or 4 times your trade becomes bigger and bigger with managed risk. Of course you need to move your stop loss with the trend so you don’t lose everything once the trend turns around. Swing trading often offers more entries when riding the same trend.
Remember, there is always a reason why you enter and exit a trade. Nothing in professional trading is a guess. Make sure you have the answer to all before you open a trade.
#trading plan#trading course#trading help#how to trade#take profit#stop loss#price action#risk management#Forex#trading#trading forex#stock trading#forex education#Forex strategy#Trading strategy
0 notes
Video
youtube
Adding Indicators to your analysis
Now that you've studied the basics of Price Action you can see where price is. You can say if it's an up or down trend or that the market is moving sideways in a range. You can also see where trend lines an support and resistance will cause price to stall, turn or start moving.
Technical Indicators can help you justify what you see. In this article I will highlight some of the indicators in the video and in the end I will emphasize how you can use them (and how NOT to use indicators).
Relative Strength Index
The relative strength index, or the RSI, tells you something about the direction and the momentum of price. Just as on your charts if price goes up and the RSI is going up to the place on the RSI shows how strong the move is. Above 80 and below 20 in the RSI is an indication that price het rallied to strong and it’s time for a break. This never happens by just the information on the RSI by the way, price action is always the first thing you look at. I personally use the RSI to spot divergence, This is the point where the market is making for example lower lows but in the RSI you’re already seeing higher lows. That’s an indication that the momentum is shifting to the upside. Once I see that price is starting to make higher lows and higher highs as well I start adding position in the direction of the new trend.
Moving Average
There're a lot of different moving averages looking depending on the timeframe you use and there're also a lot of different ways to use moving averages. For example the 9 day moving average shows the average price of the last 9 days. When price is moving above the moving average we can asume the trend is up and when the moving average breaks the trend shifts to the down side.
Just like with support and resistance and trendlines the moving average get more valuable on the bigger times frames and with the longer timeframes used for the moving average. For example the 50 day or the 200 day moving average. Also when moving averages cross each other that tells us something about the overall trend as well.
Use technical indicators for CONFIRMATION!
As you can see technical indicators can help you to confirm your idea on a trade. Now this is important: NEVER use an indicator as a buy or sell signal. You don't 'trade' an indicator, it's always a tool for extra information. Often I hear people talk about for example selling when the RSI is overbought. That's not a strategy and you'll lose money. Technical indicators a great to combine with Price Action to form a strategy all together but they have no value on their own.
#trading plan#trading help#trading education#technical indicators#forex#trading#moving average#RSI#relative strength index#bollinger bands#MACD#fibonacci
0 notes
Video
youtube
Price Action Basics
What makes the markets move? You, me and everybody else in the world that's trading in the financial markets. Buying and selling moves prices up and down. When you're trading stocks, of course how the company is doing influences the price as well. When You're trading Forex economic numbers, interest rates, war or disasters influence the strength or weakness of a currency. Before we go into price action let me first clarify the difference between technical and fundamental trading.
Technical VS Fundamental Analysis
Fundamental analysis is analysis of the market based on the news. This can be earnings when it's about stocks or it can be a new product, the coming or going of a CEO, a disaster like the BP oil spill. When you're trading currencies things like a new president, NFP, home sales, jobless claims, economic growth, interest rate decisions or war can influence the direction of the trend.
Technical analysis doesn’t look at the above things but instead just looks at the charts. Often technical traders say they don’t even want to see or hear any news so it can’t influence their trading. They just look at chart patterns. Of course they see price moving once an important economic event is in the news but then they just trade what they see. Often these events don’t change the bigger picture from a technical perspective.
Now that you know the difference between fundamental and technical trading we can go in on price action in further detail. Price action is the basic movement of price. When Price moves up the line in the chart does to. If price is viewed in candles instead of lines the candles are mostly green and are moving higher than the precious bars. Price action is also about chart patterns where multiple bars form a move up and then a couple of bars form a pullback. After that price moves even past the previous high and it will form a new 'higher high'.
Trend Lines
After a couple of these patterns (waves or swings) the lows can be connected with a trend line. The trend line doesn't just show that you're looking at an uptrend it also becomes an area where price will turn around again for the new move up because all technical traders look at that line! So when you’re for example Swing Trading, the trend line can help you to see where your new entries will be.
Horizontal Lines
Another thing that can give you valuable information are horizontal lines. Support and resistance lines drawn based on information in the past can tell you that price will react in the future. Especially on the bigger times frames these lines have meaning. So when you know that price is reaching a resistance line now you know that price will pause or maybe turn around over there. Also when that line breaks and comes back to that line it will probably act as support and you can take a save entry. It’s also possible that price is stuck within a support and a resistance area. Then you know you can trade that instrument within a range (range trading).
Before adding indicators, buying fancy software or trying out complicated strategies make sure you understand price action. This really is the core of technical analysis and of become successful as a trader. Stop guessing where price is going to go make sure you KNOW what price is going to do!
#price action#trading#forex#trader#trend lines#horizontal lines#support and resistance#trading plan#trading help#trading education#trading course#forex help#forex course#forex education#how to trade#learn to forex#learn forex
0 notes
Text
The First Step In A Succesfull Trading Career
Setting Goals
Before you get into technical analysis, developing strategies, back testing and way before trading with real money you should know what you want out of trading. I know it sounds like you could skip that because of course you saw the huge amounts in your DEMO account (which is not a realistic picture of what you’ll be earning in the beginning because you probably don’t start with that big of an account). But believe me, knowing exactly what you want and where you want to move and in what timeframe, will help you in your trading career. Emotions like greed and fear can be controlled to a curtain degree once you have a clear goal.
Do you want to pay your rent or do yo want to become a millionaire?
First of all you should know with what amount you’re willing to start trading and also what you would want to be making in what time. That may sound like a lot but let me give you an example: Let’s say you want to start with 1000,-. For example your goal, since you’re new to trading, can be that you want to pay your telephone bill and your sports bill every month. That way 100,- would be your goal. Maybe you want to pay your rent once your trading improves and your goal would be 800,- a month. If you really want to make a living out of trading and you want to earn 3000,- your investment in money, time and knowledge will be different. You can also have a goal of becoming a millionaire with a couple of years, of course your weekly, monthly and year goals will be different to achieve that.
Greed and Fear...
When you don’t have a goal and you make 100,- the human mind wants to make 200,- the next month. That’s called greed. If you start with 1000,- and you’re in a bad trade and you have to close it at minus 100,- or even minus 200,- the human mind doesn’t want to do that because we don’t like to lose. We start thinking that the position will turn around and you’ll still make a profit instead of a loss. That’s called fear. Do you get where I’m going with this? When you have clear goals you know when you had a good or a bad month. That way you don’t need to strive for more and more and you also can take a loss more easy when you know that overall you reach your monthly goal (taking a loss is NEVER easy…).
I think financial goals are important especially when you connect them to time. BUT! You should also have goals focussing on the process. These are even more important than financial goals in my opinion. Process goals can be goals that measure the kind of trades you take. How was my entry? Did I ride the trade long enough? What made me get out? Those are examples of questions you can ask yourself to measure if your trading skills are getting better.
Before you get an account set up with real money make sure to have clear financial and process goals. Let me sum up the things you should think about:
What’s my financial goal?
? in one week
? in one month
? in one quarter
? in one year
? in five years
What’s my process goal?
? winning trades
I just take trades that meet ? criteria
? loosing trades and I/m done for the day
What am I going to trade?
Forex?
Stocks?
Commodities?
How much time can I spend on trading?
Fulltime?
Parttime?
1 hour per day?
1 hour per week?
How am I going to trade?
Daytrade?
Swing trade?
Range trade
Trend trade?
#trade#trader#trading#Forex#learn to trade#how to trade#tradingforex#trading stocks#stocks#trading course#forex education#stock trading
0 notes
Video
youtube
How to start in trading? First set clear goals so you know where you’re going. What do you want to get out of trading? Pay the rent? Make money to get that car? Or become a multi millonaire? How much do you want to make and in what time? What do you need to become a successful trader? What will you be trading? Forex? Stocks? Commodities? What timeframe will you be trading? Daily? 4 hour? 1 hour? 5 minutes? And finally what are you first rules to enter and exit a trade?
For more Trading education visite my YouTube channel: https://www.youtube.com/channel/UC-jzTZ9mii7weX9XvUxPswA
#forex#stocks#commodities#trading#Setting goals#learn to trade#trading course#trading plan#trade#trader
0 notes
Text
This is my story
You can find a lot of information about trading online and not all is of the same quality. By starting this blog I want to share my story with you. First I want to tell you who I am, what got me into this business and of course how I eventually became successful.
Who am I
I’m 33 years old and I have a happy family with a little boy and a brother or sister is on the way! Furthermore I love sports. Last year I ran my first marathon and this year I started CrossFit. In the past I was into boxing, kickboxing and other martial arts. Musically I’m all about Hiphop! I started listing in the middle of the 1990’s when Tupac an Biggie where still with us. After that I enjoyed the Aftermath, Shady and G-unit era. Also DMX, Jay-Z and Kanye West where one of my favourite artist back than (and still). Nowadays I also like the new sound of Hiphop with Lil Wayne, Rick Ross, Gucci Mane or ASAP MOB. But enough about my sport and musical taste, let’s get to business.
My background
I finished an education in Health and Business but after working in that sector for 5 years I started an online marketing company with two friends back in 2013. We managed a couple of websites where we made a nice income with every month and we offered SEO services as well. Business was good but this never was my true passion. I started the business because I liked the freedom and the possibility to earn money on autopilot. After one year I took a job through a friend of mine in IT/Sales and my friends run the online marketing business until this day. They’ve actually travelled to different places in Asia and Europe while working online so they are living the freedom life as we once dream of which is great!
My introduction into trading
We often got SEO orders for websites that offered Broker Review or Trading Advice content (these websites are often the ones that tell you trading is easy and you get rich in a couple of months, WHICH IT’S NOT). After I left the online marketing business I started looking at those brokers and it got me interested in trading. I opened an account and started looking at the charts (no idea what I was looking at but I tried to make sense out of it). I traded with a demo account for a week and then I thought it was time open a real account a start to make money. I actually made money but I had no idea what I was doing. I remember when I found that that I could trade the market up (long) but also down (short). I thought that was amazing, that way I didn’t have to wait and I could make money both ways. After a couple of weeks a got stuck in some really bad positions and I had to close them to save my account. I was back it the level where I started…
My first success
My dream of being my own boss and being free was coming back to me and I was really interested in this way of making money. My first year I made a lot (400,- into 10k) and at the end of the year I gave it all back to the market. It didn’t get me down, instead it motivated me to pursue this even more. I started reading books, listen to podcasts, watch videos on YouTube and I tried to connect to people to learn more and more about trading. It was a very exciting time and I tried a lot of different things. Looking back at that time I was system hopping a lot. One week I was going in and out of the markets within a day (day trading) and then I was just entering and adding positions to moves that where moving (trend trading). One day I was looking at support and resistance and trading ranches and the other day I was waiting for breakouts or pullbacks.
The big move
Out of all those strategies, trend trading was the first way for me to make some serious money. It was 2014 and the US FED ended their Quantitative Easing program and in Europe they were starting to talk about Quantitative Easing. Their monetary policy was exactly the opposite which resulted in a strong trend in the EURUSD that fitted my trend trading strategy perfectly. I was adding and adding short position to the currency pair and it seemed like a never ending move. In the beginning of 2015 the ECB actually announced the actual plans for the Quantitative Easing program and the EURUSD took a final dip. By that time my 1000,- turned into 60.000,-! By that time I was already thinking of quitting my job but shortly after this amazing move I learned the that was to quick.
The hard learned lesson
I kept all my shorts even the ones that where not in profit because I thought that eventually it had to go further down. A lot of popular websites where all forecasting EURUSD parity by the end of the year so there was no need to worry. Or was there? The rest of that year the EURUSD was consolidating (moving in a range) so the trend was over and therefor also my strategy. I tried trading AUDUSD, USDCHF and NZDUSD but I couldn't find a big trend to ride anymore. 2015 I lost more then half of what I had in January of that year so I quit.
Never quit
NO I DIDN'T! I read a lot, I always did and I still do. Next to a lot of books about trading I was also reading a lot of books like The Power of Self Confidence by Brian Tracy, Rich Dad Poor Dad by Robert Kiyosaki or Psycho Cybernetics by Maxwell Maltz. Those books helped me to take control of my thoughts, my life and my future. It's sounds corny but success is in fact a choice and I made the choice to become a MILLIONAIRE and even more, become self made and (financial) free!
I win or I learn but I never loose
It kept me going. I learned from every mistake I made and it made me read, watch and practice even more. Successful people make more mistakes the unsuccessful people the difference is that they don't quit. You only fail when you quit. I always say, I win or I learn but I never loose. It was time for me to work out a new strategy that worked in the environment the markets where moving in right now.
I became a master
That was when I started mastering technical analysis and I discovered how price moves ad how to actually read the charts. A whole new world opened to me because now I discovered that I often entered a strong moving stock right at a strong (previous) resistance. I also sometimes entered a trade thinking it came back so far the it had to turn around but looking at that same trade with my new skills showed me that a trade like that just entered an downtrend because it cam back past the last Fibonacci retracement, broke support, the long term trendline and the moving average. Looking at price action there where also lower lows and lower highs on that chart so all signs of a downward move where there and I just went long.
Read the charts
This also answered the question everybody new in trading is struggling with, the stop loss. There was no reason for me to place all those random stop losses. Just when a stock or currency pair had all the signs of the ending of a move and/or a reversal I'd close a trade (in profit or in loss).
My Goal
Now that everything started to fall in place and I started to make consistent profits I said to myself, where am I going with this? When will I become a Millionaire? That 'Master Plan' resulted in a date: 19-04-2019.
In the beginning of 2017 I started with a Instagram account about trading that's called 'Trade Vision' as well and a Twitter and YouTube account as well as this Tumblr account. I want others to follow me on my journey but most of all I WANT TO TEACH OTHERS TO BE SUCCESSFUL IN TRADNG AS WELL! I want others to enjoy the freedom, become self made and to earn money in trading to pay the rent or to become a millionaire as well.
Now that you know a little bit about me and my story on how I became a successful trader I hope you learn a lot on my social media accounts and that WHICH IT’S NOT
1 note
·
View note