#myfigs
Text


Peter Gadiot as Shanks in ONE PIECE (2023)

#peter gadiot#shanks#one piece#one piece netflix#onepieceedit#oplaedit#opla#myfigs#smallscreensource#cinematv#cinemapix#filmtvcentral#tvarchive#disclaimer so don’t @me#I have no idea what this show is I’m a peter gadiot fan/blog#but I’ll enjoy it anyways
568 notes
·
View notes
Text

Hehe they <3
1 note
·
View note
Text
i think ill make a new pinned post w my neocities and myfig. Just cuz
1 note
·
View note
Photo

just a happy pic i took with my itabag for her birthday, before knowing
36 notes
·
View notes
Photo

starting off with a favorite in my collection,
VOCALOID4 1/8 Library Stardust by Myethos
Released in 2017
#anime figure#stardust#myethos#anime blog#figure blog#vocaloid#figures#hatsune miku#moon#myfigs#collector#chinese figures#scale figure#figure reviews
4 notes
·
View notes
Text
years ago I think in like 2017 ufotable cafe had a bunch of stuff with kitsune archer and onmyoji lancer on it and to this day that’s my favourite matching outfit combo of them but the stuff they had it on is so obscure it’s not even listed on myfig and finding it is pretty much impossible

64 notes
·
View notes
Photo


#emmerdale#robert sugden#liv flaherty#myfig#mygifs#somebody probably giffed thsi already i dunno#but i couldn't wait so#thank tumblr gods for the larger space of gfs
52 notes
·
View notes
Text
Assignment - Week 2
Python Code

Output from Code
There are 213 records in the dataset.
There are 16 columns of data.
Frequency Distruibtuion Table for Polity Score.
Raw Count Cummulative Count Distribution Cummulative Distribution
-10.00 2 2 0.01 0.01
-9.00 4 6 0.02 0.04
-8.00 2 8 0.01 0.05
-7.00 12 20 0.07 0.12
-6.00 3 23 0.02 0.14
-5.00 2 25 0.01 0.16
-4.00 6 31 0.04 0.19
-3.00 6 37 0.04 0.23
-2.00 5 42 0.03 0.26
-1.00 4 46 0.02 0.29
0.00 6 52 0.04 0.32
1.00 3 55 0.02 0.34
2.00 3 58 0.02 0.36
3.00 2 60 0.01 0.37
4.00 4 64 0.02 0.40
5.00 7 71 0.04 0.44
6.00 10 81 0.06 0.50
7.00 13 94 0.08 0.58
8.00 19 113 0.12 0.70
9.00 15 128 0.09 0.80
10.00 33 161 0.20 1.00
Summary statistics for Continuous Variables.
incomperperson oilperperson relectricperperson
count 190.00 63.00 136.00
mean 8740.97 1.48 1173.18
std 14262.81 1.83 1681.44
min 103.78 0.03 0.00
25% 748.25 0.53 203.65
50% 2553.50 1.03 597.14
75% 9379.89 1.62 1491.15
max 105147.44 12.23 11154.76
Summary Notes
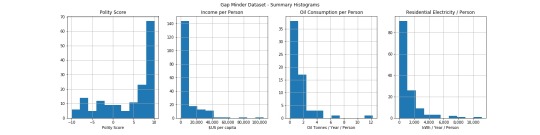
There is only one categorical variable in the Gapminder dataset – Polity Score – hence it is the only variable that I have compiled into a frequency distribution table. Income per Person, Oil Consumption per Person and Residiential Electricity per Person are continuous variable and hence it does not make sense to compile a frequency distribution table. These 3 variable have been described in terms of their classical statistics and frequency histograms.
There are 213 records in the dataset.
Polity Score is a value ranging from -10 to 10 (integers only), describing the country’s democratic and free nature (-10 being the lowest and 10 being the highest). There are 161 records with a value for polity score. The distribution is strongly negatively skewed, with most countries having a score of 5 or more.
Income per Person has 190 records, ranging from $US103.78 to $US105,147.44 with an average value of $US8,740.97. The data is very strongly positively skewed with the bulk of the countries having income per person less than $US10,000 per person.
Oil per Person has only 63 records in the dataset, with values ranging from 0.03 to 12.23 tonnes of oil per person per year. The average value is 1.48t/p/yr. The data is positively skewed with most countries having values less than 3t/p/yr. Since there is limited data for this variable (only 63 records), it may prove problematic for determining correlations and relationships in this study.
Residential Electricity per Person has 136 records and is also positively skewed. The values range from 0 to 11,154kWh/p/yr with an average of 1,173.18kWh/p/yr. Most countries use less than 2,000kWh/p/yr.
Python Code in Plain Text
(in case it is unreadable in above image)
# -*- coding: utf-8 -*-
"""
Created on Tue Mar 26 07:12:00 2019
@author: Shane Whittaker
"""
import os
import pandas
import matplotlib.pyplot as plt
import matplotlib.ticker as tick # used for label formtting
SourceData = "gapminder.csv"
myPath = "D:\\00_Coursera\\Data Management and Visualisation\Week_2"
myFile = os.path.join(myPath,SourceData) # compile path and fielname to source data.
data = pandas.read_csv(myFile, low_memory=False)
data.columns = map(str.lower, data.columns) # set all column names to lower case
pandas.set_option('display.float_format', lambda x: '%.2f' % x) # Set default output to 2 decimal places
#%%
# set all relevant data to numeric - errors='coerce' forces invalid entry to NaN (Not a Number)
data['polityscore'] = pandas.to_numeric(data['polityscore'], errors='coerce')
data['incomeperperson'] = pandas.to_numeric(data['incomeperperson'], errors='coerce')
data['oilperperson'] = pandas.to_numeric(data['oilperperson'], errors='coerce')
data['relectricperperson'] = pandas.to_numeric(data['relectricperperson'], errors='coerce')
#%%
# high level summary
print(f'There are {len(data)} records in the dataset.')
print(f'There are {len(data.columns)} columns of data.\n')
#%%
# calculate and display summary for categorical variables
ps_count = data['polityscore'].value_counts(sort=False).sort_index()
ps_dist = data['polityscore'].value_counts(sort=False, normalize=True).sort_index()
ps_dist = pandas.to_numeric(ps_dist) #convert returned object to numeric
summary_cat = pandas.DataFrame()
summary_cat['Raw Count'] = ps_count
summary_cat['Cummulative Count'] = ps_count.cumsum()
summary_cat['Distribution'] = ps_dist
summary_cat['Cummulative Distribution'] = ps_dist.cumsum()
print('Frequency Distruibtuion Table for Polity Score.\n')
print(summary_cat)
print('\n')
#%%
# buiew dataframe to display summary stats for continuous variables
summary = pandas.DataFrame()
summary['incomperperson'] = data['incomeperperson'].describe()
summary['oilperperson'] = data['oilperperson'].describe()
summary['relectricperperson'] = data['relectricperperson'].describe()
print('Summary statistics for Continous Variables.\n')
print(summary)
#%%
# create and display graphical plots
myFig, myAx = plt.subplots(1,4,figsize=(20,5))
polyplot = data['polityscore'].hist(ax=myAx[0], bins=10)
incplot = data['incomeperperson'].hist(ax=myAx[1], bins=10)
oilplot = data['oilperperson'].hist(ax=myAx[2], bins=10)
elplot = data['relectricperperson'].hist(ax=myAx[3], bins=10)
polyplot.set_title('Polity Score')
polyplot.set_xlabel('Polity Score')
incplot.set_title('Income per Person')
incplot.set_xlabel('$US per capita')
oilplot.set_title('Oil Consumption per Person')
oilplot.set_xlabel('Oil Tonnes / Year / Person')
elplot.set_title('Residential Electricity / Person')
elplot.set_xlabel('kWh / Year / Person')
myFig.suptitle('Gap Minder Dataset - Summary Histograms')
myFmt = tick.StrMethodFormatter('{x:,.0f}') # define string to parse to label formatter
incplot.xaxis.set_major_formatter(myFmt)
elplot.xaxis.set_major_formatter(myFmt)
myFig.savefig(os.path.join(myPath,"GapMinder Summary Histograms.jpg"))
1 note
·
View note
Text
nyaanko replied to your photo:@nyaanko: *looks around the room at my 5 link...
YOU HAVE TWO NATSUME FIGURES?!! Which ones do you have? I’ve been trying to get my hands on him forever I want the older alter figure but it’s so hard to find T__T And I know her princess figure is beautiful I wonder what her scale will be
I have the banpresto figure and the alter one of him sitting on the tree, and they announced a new one at wf that looks like it’s going to be really pretty ;0;
here’s my collection on myfig if you wanna see what I have~
2 notes
·
View notes
Text


Peter Gadiot as Shanks in ONE PIECE [2023]
Don’t you ever threaten my friends.
#peter gadiot#one piece#onepieceedit#one piece netflix#opla#oplaedit#one piece live action#shanks#myfigs#cinemapix#userthing#cinematv#filmtvcentral#smallscreensource#tvarchive#my disclaimer again: I’m only here for peter lol#idk anything about op and I only watched it for him#for any others who just want to see this for him he’s only in it for three eps for maybe 10 min each#spoiler alert#these are most of his scenes#most of his scenes are with a little boy which is cute#he has a limb cut off and he smiles a lot and he’s just a sweet guy#oh and yes he has his natural British accent#now if you excuse me I’ll get back to swooning over james valdez
352 notes
·
View notes
Text
Jorge Nuño’s Response to Bike The Vote L.A.
Below is 2017 City Council District 9 endorsement Jorge Nuño’s full questionnaire response to Bike The Vote L.A.:
1. What role do you see for walking, transit, and biking in the daily lives of Angelenos, particularly those who lack access to cars and rely on these other modes as their primary way of getting around?
It is no secret that the City of Los Angeles leads the world in traffic congestion. It is essential that we build development that encourages pedestrian walkability, that we update our existing transportation infrastructure to make our transportation system more safe and reliable, and that we increase safe bike lanes across the city that is accessible to points of interest, jobs, schools, and community gathering spaces.
2. Disenfranchisement and insecurity in the public space push many youth of color to seek safety and community in gang membership. How will you address these issues so that the area's youth can play a participatory role in building a community that is safer and stronger for all?
The lack of safe gathering spaces in South Los Angeles was a major factor in the opening of the Big House. I created the Big House so the neighborhood kids could have a safe space from the gang culture that prevails in our neighborhoods, whether they use the space for homework or just to use the wifi. I want to take this model and replicate it throughout our public spaces, we can do this at our recreation centers and we can do this at our local libraries and schools. We can also partner with local business and create private-public partnerships that will maximize and leverage City funds to give our youth access to sorely needed resources.
3. A longstanding lack of trust between law enforcement and the community has made passage through public space and on city streets rather fraught for many, especially teens and young men of color. What will you do to repair this relationship between law enforcement and the community they serve such that law enforcement can become a broadly trusted partner for CD9 residents?
We need to engage and invest in our youth, expand community policing and empower neighborhood organizations. Body cameras for example, have provided a new level of accountability and transparency between the public and the police. I believe that community policing is a strong tool in mending relationships. The Community Safety Partnership division of the LAPD is a fantastic model of community policing and as Councilmember I will advocate for the expansion of this program throughout CD 9 and South Los Angeles. A CD9 resident on the Police Commission is key in ensuring our concerns are heard.
4. Many residents in South Los Angeles lack access to cars. Of these, a large percentage, especially immigrants, depend on bikes as a way to get to work and school, but lack safe options to commute thanks to a host of factors, including prevalent speeding on city streets. Mobility Plan 2035 established “safety first” as the City’s top priority in transportation decisions. Do you support prioritizing the safety of Los Angeles’ most vulnerable commuters in implementing Mobility Plan 2035, both in CD9 and throughout Los Angeles?
So far the bicycle infrastructure expansion across the City seems to be aimed towards recreational uses, the multi-million dollar L.A. River bike path for example. I applaud the local elected officials that have championed that bike path and I am in support of safe, cycling infrastructure throughout the City but we cannot ignore the communities that use cycling as a main source of transportation to jobs. You are correct in stating that a large percentage of South Los Angeles residents depend on bikes to get to work but the build-out of the infrastructure network currently does not reflect that. A safe cycling network in South Los Angeles must be prioritized not just for recreational purposes but also for economic justice. Unfortunately, we do not have local elected officials in South Los Angeles that fight as hard for those bike lanes as other parts of the City do. I will fight my hardest to ensure that the Mobility Plan is implemented in an equitable and just way for the residents of South L.A.
5. Central Avenue has been the site of an increasing number of tragic fatal crashes over the past month, including Jorge Alvarez on December 19th and another unidentified man on December 7th. Despite high rates of injuries and deaths among people who commute by bike, Central was removed from Mobility Plan 2035’s network of streets designated for bicycle safety improvements, with the suggestion that people commuting by bike be steered towards Avalon Boulevard instead. Given that Central Avenue boasts the highest number of bicycle commuters of any street in Los Angeles, what will you do as Councilmember to ensure that people who currently commute on Central are able to do so safely?
I will introduce a plan to make sure that Central Avenue is placed back into the Mobility plan 2035 and that it is designated as an avenue that requires bicycle safety improvements. But, there is no reason why Avalon and Central cannot both be designated corridors for cycling commuters. These two avenues run through the most densely populated zip code in the country. In fact the only way we are going to ensure our cyclists and pedestrians are safe is to create a network of safe, multi-modal streets through South L.A. Multi-million dollar projects such as the ones proposed for Central Avenue, MyFig and the Slauson Active Transportation Corridor are big wins for the community but we must continue to make sure every street in our network is safe.
6. Los Angeles is beginning to employ bike share as a new transportation option, but many barriers to access remain, particularly the cost of riding and the fact that a credit card is needed to use the system. Some cities have offered subsidies to low-income riders and cash payment options to address these issues. What can the City of Los Angeles do to help as many residents as possible enjoy the benefits that bike share will bring?
Just like the rollout of bicycle lanes, the implementation of bike share in Los Angeles has largely been focused in downtown for recreational purposes. The communities of color can not participate in bike share if there is no station south of Martin Luther King Blvd. Because many of our communities live paycheck to paycheck, we must have subsidies to low-income residents.
0 notes
Photo

I’m so sorry I’m late, but
HAPPY BIRTHDAY TO HANJI ZOE
our one and only queen
our commander
my waifu
the love of my life
♥
#hanjizoe#myfigs#anime collection#ita bag#waifu#hange zoe#snk#hanji birthday#yes this is my personal collection uwu
26 notes
·
View notes
Text

went on myfig to see if rokurou has any figures (he doesn’t) and im crying real tears at this image

LOOK at this
25 notes
·
View notes
Last Seen Blogs

pecociraptor
Sin título

banca23co
Banca23 ⭐️ Siêu hoàn trả 2% tham gia bắn cá

whoisosmith
Entertainment Extrodinaire

katieeverett655
Katie

de-laurentis-brazil
De Laurentis Brazil