#Candlesticks pattern
Text
Unveiling the Magic of Shooting Star Candlestick Pattern
Title: Unveiling the Magic of Shooting Star Candlestick Pattern: A Step-by-Step Guide
Introduction:Candlestick patterns are essential tools for technical analysts in the world of trading. Among the myriad patterns, the Shooting Star stands out as a powerful indicator of potential trend reversals. In this blog post, we will delve into the nuances of the Shooting Star candlestick pattern,…

View On WordPress
#candlestick#candlestick chart#candlestick patterns#candlestick trading#candlestick trading patterns#candlestick trading setup#candlestick trading strategies#candlesticks#candlesticks pattern#elemer of the briar#forex trading against the trend#history of the elder scrolls#japanese candlesticks#making of the elder scrolls#swing trading guide#swing trading patterns#technical analysis chart patterns#the elder scrolls: arena - a complete retrospective
1 note
·
View note
Text
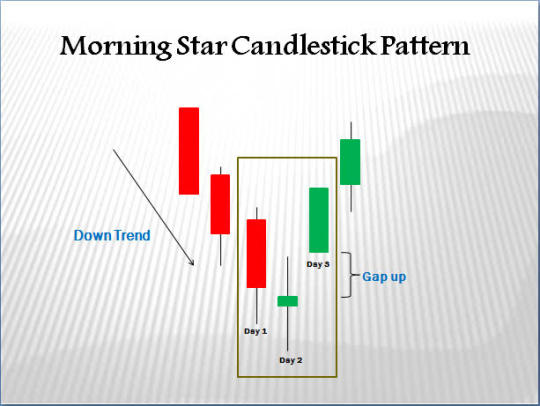
Triple candlestick patterns: morning and evening star
Triple candlestick patterns are technical analysis tools that are commonly used by traders to identify potential changes in the direction of price movements.
Triple candlestick patterns are technical analysis tools that are commonly used by traders to identify potential changes in the direction of price movements. Among these patterns, the morning and evening star are two of the most popular and reliable ones. In this article, we will provide a detailed explanation of what these patterns are, how they are formed, and how traders can use them to make…
View On WordPress
0 notes
Text
Mr. Nimblr calls candlesticks the trading candlesticks, and he specifies his reasons as to why. He will talk about the various parts of a candlestick and how one should observe the various parts of a candlestick body to make the most efficient decisions for their portfolio.
Following this, Mr. Nimblr talks about what makes his approach different from all the other ways of entering and exiting a trade and why he has chosen to abandon the various popular names by which the different types of candlesticks are known and just identify candlesticks with their body height, open and close. He will talk about his own categorization of candlesticks on the basis of candle height and the implications of these categories.
0 notes
Text


Spoonflower shop update! These designs are newly available to buy, as are a bunch of others, plus some new colour & scale variations... Take a look? spoonflower.com/profiles/rowanclair
#illustration#surface pattern design#victorian wallpaper#rose#candlesticks#chess#dragonfruit#snails#bees
44 notes
·
View notes
Text
Bearish Engulfing pattern can result in uptrend ! When and How?
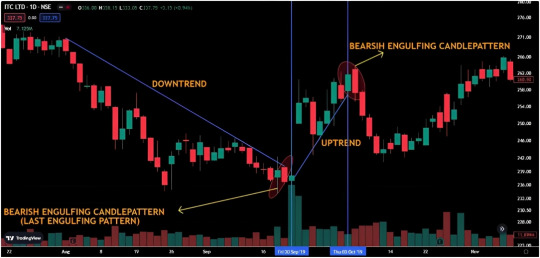
The above chart is a perfect example for a bearish engulfing pattern to act as a bullish trend reversal.This happens when bearish engulfing pattern occurs in the end of downtrend.
Click here to learn more about this in detail.
#stock trader#stock trading#candlestick pattern#crypto traders#future and option trading#forex trading#forex#earn money online#technical analysis
12 notes
·
View notes
Text
Candlestick Charting: A Tale of Tradition and Innovation from Japan
Candlestick charting's rich origins in Japan reveal timeless insights into market sentiment. Embrace the past's wisdom as we navigate today's markets, confident that understanding emotions will illuminate brighter trading paths! 🚀📈 #FinancialWisdom
Candlestick charting, a vital tool for traders globally, originated in 18th-century Japan amid a feudal society and a thriving rice market. Developed by legendary trader Munehisa Homma, it visualised price movements using candlesticks, revealing market psychology and predicting trends. Steve Nison’s introduction of candlestick charting to the West in the 1980s revolutionised technical analysis.…

View On WordPress
#Bullish and Bearish Patterns#Candlestick Patterns#Feudal Japan#Financial Education#Japan#Market Psychology#Modern Trading#Price Action#Risk management#Technical Analysis
4 notes
·
View notes
Text
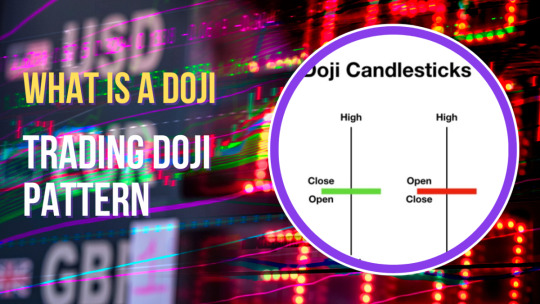
Doji Candlestick Pattern and Trading Doji
The doji pattern is a candlestick pattern commonly used in technical analysis to indicate indecision in the market. It occurs when the opening price and the closing price of an asset are very close to each other, resulting in a candlestick with a very small real body.
The doji pattern can have different shapes, but the common characteristic is that it has a small real body, a long upper and…
View On WordPress
#candlestick patterns#Candlesticks#Doji#dragonfly doji#gravestone doji#learn technical analysis#long legged doji#Patterns#stock markets#stock trading#technical analysis#trading doji
3 notes
·
View notes
Text
Indian Stock Market Hit by SVB Crisis and Global Market Volatility
The Indian stock market is facing turbulence due to the SVB crisis and global market volatility. #OptionTrading #BankNifty #Nifty50 #BankCrises #IndianStockMarket #GlobalMarketVolatility
Indian Stock Market Hit by SVB Crisis and Global Market Volatility
The Indian stock market is reeling from the recent failure of Silicon Valley Bank (SVB) in the United States and the ripple effect it is having on global equity markets. This comes on the heels of the Adani crisis, making it another blow to the market’s recovery efforts.
Investors have lost a whopping Rs 6.6 lakh crore in the…

View On WordPress
#bank stocks#bearish momentum#candlestick patterns#candlestick trading#global market volatility#rate hike#Silicon Valley Bank#SVB crisis#technical analysis#trading strategies
2 notes
·
View notes
Text
Candlestick Patterns - The Lazy Trader
A guide to candlestick pattern trading found on The Lazy Trader website
Candlestick patterns

2 notes
·
View notes
Text

#CandleScanner#CandleScanner V5.0.9#CandleScanner V5.0.9: Candlestick Patterns Trading Made Easy With Crack Download
1 note
·
View note
Text
Binance Exclusive: Start Trading with $100 for Free!

Take your first steps into the exciting realm of cryptocurrency trading with Binance! Sign up now and receive a complimentary $100 to kickstart your trading journey. Explore a diverse selection of cryptocurrencies, hone your trading skills, and potentially turn that initial $100 into something more. Don't miss this exclusive offer – seize the opportunity to trade on Binance with free funds! #binance #cryptotrading #freemoney
Link Below : https://bit.ly/BinanceFree100
#Cryptocurrency#Forex#Stocks#Day Trading#Swing Trading#Technical Analysis#Fundamental Analysis#Trading Strategies#Risk Management#Options Trading#Futures Trading#Bull Market#Bear Market#Market Trends#Stop-Loss#Take Profit#Margin Trading#Leverage#Candlestick Patterns#Market Volatility
0 notes
Photo

My entry for the current Spoonflower design challenge, dark academia! If I'd had more time I would have loved to do something more complex but I felt like these candlesticks suited it pretty well.
It's interesting to see what everyone made considering that the theme is a bit more loose in concept compared to some, even though there is common imagery that shows up. I’m enjoying these challenges a lot at the moment, they’re providing a great opportunity to try something new without much pressure, and getting to see how everyone else interpreted the theme is great fun, if you’d like to you can check out all the entries/vote here!
11 notes
·
View notes
Text
What makes the bearish harami a weak bearish reversal indicator?
A bearish harami is one of the weakest bearish trend reversal candlestick.It is due to the psychology behind it.
In simple terms, it is the bears and bull's behaviour in the market that makes the bearish harami a weak trend reversal pattern.

The above picture depicts the behaviour of bulls and bears in the market that leads to the formation of bearish harami and also makes it a weak indicator.
Click here to read the explaination about their behaviour.
#stock trader#investing stocks#stock market#future and option trading#forex trading#forex#earn money online#investor#candlestick pattern#crypto traders
9 notes
·
View notes
Text
#risk management#market capitalization#india#bullish reversal#market trends#chart pattern#candlestick pattern
0 notes
Text
Mastering RSI Divergence: A Comprehensive Guide to Trading Success
Trading financial markets involves a plethora of strategies and technical indicators that help traders identify potential opportunities. Among these, the Relative Strength Index (RSI) is one of the most popular tools used by traders. RSI divergence, in particular, is a powerful concept that can significantly enhance your trading strategy. In this comprehensive guide, we will delve into the…
View On WordPress
#Bearish Divergence#Bullish Divergence#candlestick patterns#forex trading#hidden divergence#MACD#Momentum Oscillator#multiple time frames#overbought and oversold#price action#relative strength index#Risk Management#RSI divergence#RSI trading strategy#stock market#Support and Resistance#technical analysis#Trading Indicators#trading signals#Trend Reversal
0 notes
Last Seen Blogs

princeleonstuff2
Prince leon

johnkatsmc5
return to the underground,the other side of music

cheion-writes
cheion-writes

queencvbra
𝐐𝐔𝐄𝐄𝐍 𝐂𝐎𝐁𝐑𝐀*
johnkatsmc5
return to the underground,the other side of music