#rsi indicator
Text
What Is A Good RSI Reading?

In this article, we unravel the intricacies of the RSI indicator, probing into its fundamental calculations, exploring its significance in Forex trading, and seeking guidance on how to interpret its readings.
0 notes
Text
ما هو مؤشر القوة النسبية؟ RSI indicator
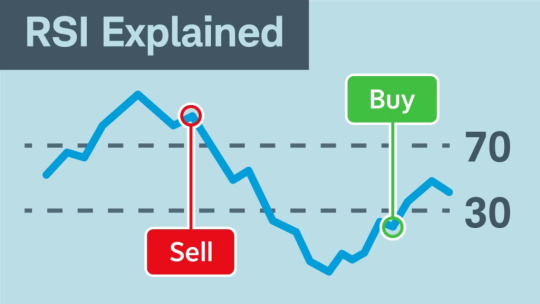
مؤشر القوة النسبية (RSI) هو مؤشر فني يستخدم لقياس قوة الاتجاه والتغيرات في السوق. يتم حساب قوة الاتجاه من خلال مقارنة الزيادات والانخفاضات في الأسعار خلال فترة زمنية محددة. ويتم تمثيل النتائج على شكل خط يتراوح بين 0 و100، حيث تعتبر قيمة RSI فوق 70 إشارة لتشبع الشراء، وتعتبر قيمة RSI أقل من 30 إشارة لتشبع البيع.
ويتكون مؤشر القوة النسبية من خلال حساب المتوسط الحسابي للزيادات في الأسعار خلال فترة…
View On WordPress
0 notes
Text
Forex & Crypto
Forex & Crypto
As a trader, you will probably experience hot and cold streaks at some point. They are not entirely predictable, but they will occur regardless of your strategy. In fact, a good part of trading involves learning to deal with psychological responses to these streaks. For example, some traders have strategies that have consistently won 90% of the time, but that often comes at the expense of low…

View On WordPress
0 notes
Link
Como usar o RSI Índice de Força Relativa para Obter mais Lucro no Mercado, Mercado Forex,Estratégia RSI,Aprender Forex, identificar uma reversão,Renda Todo trader de Forex experiente deve conhecer as quatro tendências do Índice de Força Relativa (RSI) em um ciclo de moeda. Os quatro ciclos são: as fases positivas e negativas de divergência e reversão. Esses 4 ciclos RSI têm uma correlação direta com a determinação da tendência de uma moeda... SAIBA MAIS!
0 notes
Text

RSI được viết tắt là (Relative Strength Index) có nghĩa là chỉ số sức mạnh tương đối. Đây là một chỉ báo động lượng đo lường mức độ thay đổi về giá gần nhất, xem xét điều kiện mua bán quá mức cho chứng khoán, cổ phiếu hoặc Forex,…
Cùng Brokervn tìm hiểu ngay nhé
Link: https://brokervn.net/chi-so-rsi-la-gi/
0 notes
Text
What is RSI Indicator and how to use it in stock market trading?
What is RSI Indicator and how to use it in stock market trading?
You may know what RSI Indicator is.
You may know that RSI is a very popular and widely used indicator.
But do you know how to use it properly in live trading?
I don’t know what you are thinking.
But I can say that most people don’t know how to use it properly.
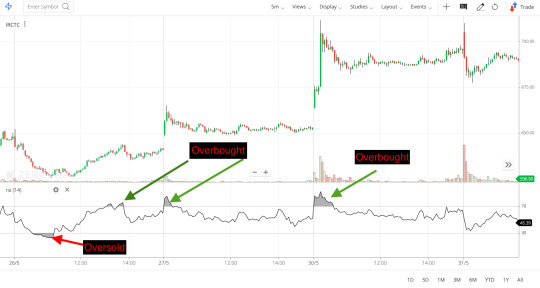
Most people know RSI is above 70 means over-bought and below 30 means over-sold of the stock.
But we may know a lot more by reading RSI…
View On WordPress
#does rsi indicator work#how to set the rsi indicator#how to use rsi indicator#rsi indicator#rsi indicator above 50#rsi indicator above 60#rsi indicator accuracy#rsi indicator analysis#rsi indicator combination#rsi indicator divergence#rsi indicator divergence example#rsi indicator explained#rsi indicator for options trading#rsi indicator for swing trading#rsi indicator guide#rsi indicator how to use#rsi indicator in kite#rsi indicator in tradinview#rsi indicator in upstox#rsi indicator in zerodha#rsi indicator leading or lagging#rsi indicator levels#rsi indicator mt4#rsi indicator mt5#rsi indicator pdf download#rsi indicator settings#rsi indicator strategy#rsi indicator technical analysis#rsi indicator trading strategy#rsi indicator tutorial
0 notes
Text
Mastering Trading with the Time Series Forecast Indicator: A Comprehensive Guide
In the complex and often unpredictable world of financial trading, having robust tools at your disposal can significantly improve your trading outcomes. One such powerful tool is the Time Series Forecast (TSF) indicator.
This post will delve deeply into what the TSF indicator is, how it works, and how you can effectively incorporate it into your trading strategy.
Understanding the Time Series…
View On WordPress
#Combining TSF with RSI#cryptocurrency trading#Cryptocurrency trading strategies#Divergence analysis#Forecasting in Trading#Forecasting price movements#forex trading#Forex trading strategies#Identifying trends#learn technical analysis#Linear Regression#Linear regression in trading#Moving averages and TSF#Predicting future prices#Risk management in trading#stock market#Stock market strategies#technical analysis#technical analysis tools#Time Series Forecast Indicator#Trading Strategies#trading tools#Trading with TSF#Trend Identification#TSF trading
0 notes
Text
Indicators that may be useful to you in the bull market!
BTC With the holding above $65,000, the bull run in the cryptocurrency market accelerated. Altcoins, which are rising one by one, continue to make crypto investors happy. Indicators, which make it easier to follow the course of the market, are even more critical with the bullish effect. So, what are the most valuable indicators to consider in the bull market?
1- Relative Strength Index (RSI)
One…

View On WordPress
0 notes
Text
Learn The Importance Of Matching RSI Settings To Different Time Frames

This article will delve into the intricacies of RSI settings and time frames, exploring how this can enhance decision-making and increase trading potential.
0 notes
Text
Aiming Higher: Uniswap's UNI Token Gathers Steam, Eyes 15% Price Increase
Uniswap's native cryptocurrency, UNI, has recently exhibited a robust bullish trend, surging past key resistance levels at $6.00 and $6.20. The token's ascent above $6.50, accompanied by a 5% growth, has ignited discussions among investors and traders regarding a potential rally toward the $8.00 mark.
The breakthrough of a critical bearish trend line, formerly a stronghold near $6.60, has injected optimism into UNI's market dynamics. The token's steady climb above the $6.75 resistance level signifies its strong upward momentum, with attention now turning to the next significant obstacle at the $7.25 resistance.
As of the latest update, UNI is valued at $6.82, reflecting a modest 0.51% increase in the past 24 hours and a weekly gain exceeding 10%. The ongoing battle between bears and bulls has shaped UNI's price action, with the bulls currently seeking to surpass the resistance at $6.90.
Detailed analysis of UNI's technical indicators adds further weight to its bullish stance. The 4-hour MACD signals a growing bullish momentum, complemented by an RSI firmly above 50, indicative of a robust market sentiment favoring the bulls. The token's consistent performance above the 100 simple moving average further strengthens the positive outlook for UNI's short-term trajectory.
Uniswap's dominance in the Ethereum ecosystem throughout 2023, marked by substantial transaction volume and efficient gas processing, has translated into UNI's notable price movement. A 28% increase following the launch of new initiatives and expansions underscores the platform's influence in the decentralized finance (DeFi) space, contributing to UNI's current upward trajectory.
#UNI token#Uniswap#cryptocurrency#DeFi space#bullish trend#resistance levels#technical indicators#price analysis#UNI/USD#CoinMarketCap#MACD#RSI#Cryptotale
0 notes
Link
Understanding and Utilizing RSI in Stock Trading
The provided article delves deeply into the significance and utilization of the Relative Strength Index (RSI) in the realm of stock trading. RSI serves as a crucial indicator for assessing whether a stock's current price is in an overbought or oversold state. The article comprehensively explains how RSI functions, its components, formulas, interpretation strategies, and practical tips for effective application.
This article is a comprehensive guide for investors, offering insights into the RSI's mechanics and its practical value in evaluating market conditions. By clarifying the concept of overbought and oversold levels, the article empowers investors to make more informed decisions and implement better trading strategies. The explanations and application strategies provided assist traders in using RSI as a valuable tool for understanding market dynamics and anticipating potential trend reversals.
#RSI#stock market#technical indicator#trading strategies#overbought#oversold#market conditions#trend reversals#investor education#trading insights
0 notes
Text

The Saptarṣis
“Master of Pahari painting at the court of Mankot (attr.), c. 1675–1700. Government Museum and Art Gallery, Chandigarh.”
Image and text from: Ardor (2010)- Roberto Calasso
“The hymns of the Ṛgveda were said to have been seen by the ṛṣis. The ṛṣis may therefore be described as “seers.” They saw the hymns in the same way as we see a tree or a river. They were the most disconcerting, least easily explainable beings in the Vedic cosmos. Chief among them were the Saptarṣis, the Seven who lived in the stars of the Great Bear, who have some affinity with the Seven Greek Sages, with the Islamic abdāls, and with the Seven Akkadian Apkallus of the Apsu. But something in the very nature of the ṛṣis was an epistemological scandal: they alone were allowed to belong to the unmanifest and at the same time take part in the events of everyday life, which they secretly ruled.”
(Calasso, p. 93)
#Hinduism#Vedas#Rsis#Saptarsis#saptarishis#seers#yogis#rg veda#indian art#Indic art#pahari paintings#roberto calasso#ardor#chandigarh#personal archive
1 note
·
View note
Text
Here Is A List Of The Most Common Trading Indicators
In trading, an indicator is a statistical measure of market conditions used to forecast price changes.
These are some of the most commonly used trading indicators, which are typically available on trading platforms like KuCoin:
Simple Moving Average (SMA): An average of the price over a certain number of periods (like days or hours). The formula for SMA is (A1+A2+A3…+An)/n, where A is the asset…

View On WordPress
#ATR#Average True Range#Bollinger Bands#crypto trading#EMA#Exponential Moving Average#Fibonacci Retracement#MACD#Moving Average Convergence Divergence#Relative Strength Index#RSI#Simple Moving Average#SMA#Stochastic Oscillator#trading indicators#Volume Weighted Average Price#VWAP
1 note
·
View note
Text
#rsi#relative strength index#crypto indicators#cryptocurrency news#cryptocurrency#crypto#btc news#bitcoin#eth#ethereum#blockchain
0 notes
Text
Pivot Pinball Forex Day Trading Strategy
Pivot Pinball Forex Day Trading Strategy
Among the most common day trading strategies, the Pivot Pinball Forex Strategy has proven to be very profitable and easy to follow. It utilizes the same formulas that are used by professional day traders to generate a lot of profit. This strategy will also help you to neglect the most common mistakes that most beginners make.
RSI divergence
RSI divergence in pivot pinball forex day trading…

View On WordPress
0 notes
Last Seen Blogs

93-12-23
all about

patipi
f_patipi93

oboesoda9
پمپ وکیوم سرمایش

tasbell
Ykader

timesickdrunkandlovely
l'audace