#renko charts
Text
Keltner Channel Forex Renko Chart Strategy
Keltner Channel Forex Renko Chart Strategy
Using the Keltner Channel Forex Renko Chart Strategy will help you identify overbought and oversold levels and give you the edge you require to succeed in your trading. These simple techniques can be used on a daily, weekly, or monthly basis to get an edge in your trades.
Overbought and oversold signals
Identifying overbought and oversold signals in the Keltner Channel Forex Renko chart…
View On WordPress
#Keltner Channel#Keltner Channel Forex Renko chart strategy#Keltner channel helps#Keltner Channel indicators
2 notes
·
View notes
Text
The Analyst Who Knows Every Step of Bitcoin Published a Rarely Seen Chart! What does it mean?
Peter Brandt, an investor with over 40 years of experience, weighed in on a unique tool: the weekly Renko chart. This seemingly obscure method sent shockwaves through the market, with many questioning whether it could be the key to unlocking the future trajectory of Bitcoin (BTC). Here are the details…
Veteran analyst points to Renko chart for Bitcoin
Brandt’s reinforcement is no ordinary…

View On WordPress
0 notes
Text
Techninė analizė. Kryžiukai ir nuliukai
Kryžiukai ir nuliukai (KiN, Point and Figure) yra dar vienas kainos grafiko tipo pavyzdys, kuris remiasi tik kainų pokyčiais, be laiko
#trading #money #pricechart #pointandfigure #kryziukaiirnuliukai #technineanalize
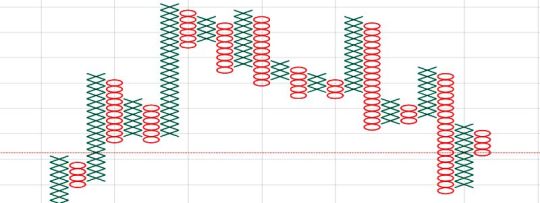
Kryžiukai ir nuliukai (KiN, Point and Figure) yra dar vienas kainos grafiko tipo pavyzdys, kuris remiasi tik kainų pokyčiais, be laiko intervalų. Tokiu būdu KiF grafikai yra panašūs į Renko, Kagi ir Line Break grafikus. Pagrindinis KiN grafikų supratimas yra tas, kad jas sudaro stulpelių serija, sudaryta iš ‘X’ arba ‘0’.
Continue reading Untitled
View On WordPress
#Investavimas#Kagi#Kryžiukai ir Nuliukai#Line Break chart#Money#Pinigai#Point and Figure#Renko chart#Techninė analizė
1 note
·
View note
Text
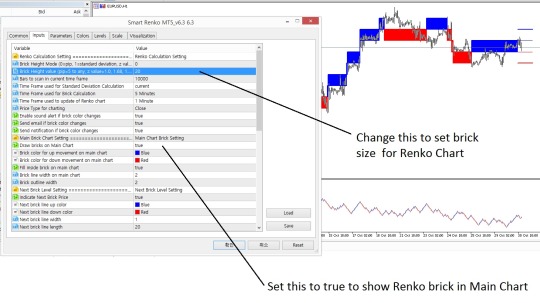
#Smart Renko is a unique Renko Charting Tool with customizable Brick Height for your MetaTrader Platform#priceactionforex#forextrading#priceactionstrategy
0 notes
Text
you know charting the progression of maribel's faces over time you really see her lose her hinges

uwu baby

a little smug because she knows something that you don't. that's fine

[Mlle Not Appearing In This Image]

confused

fin de siecle romance protagonist

"you are listening to me, right?"
to, abruptly

"i can see god now"

"i know what's happening in that other world and you will listen to me about it"

"i am confident in social situations"
rainbow-colored septentrion isn't so smug on its own:

but add in the renko, and you'll realize that they've almost exactly flipped their ghostly field club demeanors:

anyway. excited to get a new CD whenever that happens. something wrong with her.
74 notes
·
View notes
Text
creating a chart in my head currently only defined by renko and tsukasa’s positions
10 notes
·
View notes
Text

I don't do a lot of shipping, but I realized I haven't done a post in months that isn't LostWord related, so here's my shipping chart with my boring shipping picks. My explanation for some of these:
Maribel / Renko: Don't know a single thing about the Sealing Club characters, but I believe it when people call that couple mega-turbo-super-canon
Hisami / Zanmu: Hisami for sure has feelings, this is more about wanting Zanmu to reciprocate / not wanting it to be 1-sided
Grassroots Polycule: I've always liked Wakasagihime X Kagerou, but I've started to like the idea of it being a polycule. The polycule dynamic is "introvert Sekibanki being adopted by extroverted Wakasagihime and Kagerou." I definitely prefer it over Kogasa X Sekibanki which doesn't work for me because canon Sekibanki hides her youkai nature, Kogasa is a fairly public youkai and they're both pretty active in the Human Village. I feel like their relationship would be strained by disagreements about how they'd hang out in the village / around humans. That'd be less of an issue with the Polycule, since they would only hang out outside of the Village (no gossip unless someone decides to trail Sekibanki all the way to Misty Lake, which won't happen). TBH I'd probably put Kogasa X Sekibanki as Past Fling if I ever remade this chart.
Depends How I'm Feeling: I just cannot settle on a Reimu ship. Reimu X Marisa should be the best option, but Reimu X Sanae amuses me (the idea of Kanako, Suwako, Yukari and Kasen having to be in-laws sounds hilarious) while Reimu X Akyuu has that tragic aspect (IIRC Akyuu's memory relates to youkai, so I imagine her future incarnations would have a lot of memories working with Reimu since she exterminates youkai. Future incarnations would know they were close, but they would not be able to recall the most intimate memories that had nothing to do with youkai. Basically, the ship is about future Children of Miare being cursed with incomplete memories of Reimu forever).
I Only See Them As Friends: It's mostly self-explanatory. Just adding that I respect others that ship these, even if I don't ship them myself.
(Not On This List) All The Ships I Hate: I didn't include them here, but I'm against pretty much every "Dating Your Boss" ship. So Eiki/Komachi, Youmu/Yuyuko, Ran/Yukari, Aya/Megumu, Sakuya/Remilia etc.
Some (dis)honorable mentions that aren't just "Dating Your Boss Is Bad" are the old school Tenshi ships that make her into a masochist (so Tenshi X Yuuka or Yukari) and also Reisen X Junko (because 99% of the time it's just "lol wouldn't it be hilarious to have Junko stalking / harassing Reisen?")
Also, Reimu X Mamizou and Sannyo X Mamizou are totally missing from the list. Sannyo X Mamizou would probably be my definitive Mamizou ship (they're both old, experienced and wise in different ways. Also, they'd totally smoke weed together). Reimu X Mamizou would be with the other Reimu ships and the appeal is similar to Reimu X Sanae but with shapeshifting shenanigans (I wanna see Reimu react to Mamizou turning into a copy of her).
10 notes
·
View notes
Text
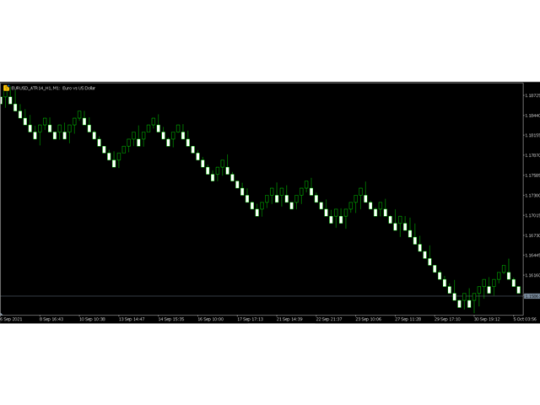
Renko Chart Generator
This is the Best Renko chart generator ever in the market
you can set the box sizes based on ATR or Fixed Size:
1. Fixed Box Size
2. Current ATR Size
3. ATR size of the Chart Start Time.
also you can set the Renko chart cut of date and time to start as reference of creating renko charts.
you need to attach to a symbol chart that want the renko chart of it, then immediately a new chart will be opened which is based on renko, you can use this generated chart and attach your EA to trade on or you even can run strategy tester to run your EAs based on generated chart.
Renko Chart Generator
0 notes
Text
Renko Charts: An Insight into Definition, Functionality, and Analytical Utility
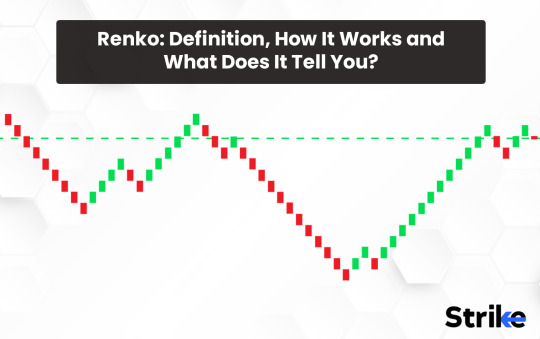
Renko charts, a lesser-known yet powerful tool in the realm of financial analysis, offer a unique perspective on price movements. Derived from the Japanese word 'renga' which means bricks, Renko charts provide a distinctive way of visualizing price action. Unlike traditional candlestick or line charts, Renko charts focus solely on price changes, filtering out market noise and presenting a clearer picture of trend direction and market sentiment. In this comprehensive guide, we delve into the definition, mechanics, and analytical significance of Renko charts, shedding light on their practical applications in financial analysis.
Understanding Renko Charts:
Renko charts are constructed by plotting bricks or blocks of a fixed size, typically representing a predetermined price movement, rather than plotting price changes over time. Each brick on a Renko chart is plotted only when the price moves beyond a specified threshold, known as the box size or brick size. If the price moves beyond this threshold in the upward direction, a new brick is added above the previous one, indicating an uptrend. Conversely, if the price moves below the threshold, a new brick is added below the previous one, signaling a downtrend.
The primary characteristic of Renko charts is their uniformity in brick size, irrespective of the time taken for each brick to form. This uniformity eliminates the temporal aspect of conventional charts, focusing solely on price movements. Consequently, Renko charts tend to filter out minor price fluctuations, offering a clearer visualization of significant price trends.
Mechanics of Renko Charts:
To comprehend the mechanics of Renko charts, it's essential to grasp the concept of brick size and its implications on chart formation. The brick size is determined based on the desired level of granularity in price movements. For instance, a smaller brick size would capture more price fluctuations, whereas a larger brick size would filter out noise and focus on broader price movements.
Each brick on a Renko chart has two main components: the body and the wicks. The body of the brick represents the price movement within the specified threshold, while the absence of wicks signifies that the price remained within the brick's range throughout the specified period. This characteristic distinguishes Renko charts from candlestick charts, where wicks represent price fluctuations outside the body's range.
Renko charts can be customized further by adjusting parameters such as brick size and reversal criteria. The reversal criteria determine when a trend reversal occurs and a new brick is plotted in the opposite direction. By fine-tuning these parameters, traders can tailor Renko charts to suit their trading strategies and preferences.
Analytical Significance of Renko Charts:
Renko charts offer several analytical advantages over traditional charting methods, owing to their ability to filter out noise and focus on significant price movements. Some key benefits of Renko charts include:
Trend Identification: Renko charts excel in identifying trends, as each brick represents a predefined price movement. Traders can easily identify uptrends, downtrends, and sideways movements based on the direction and arrangement of bricks on the chart.
Support and Resistance Levels: Renko charts provide clear support and resistance levels, as these levels are determined by the brick formations. Breakouts and bounces from these levels can signal potential trading opportunities.
Entry and Exit Signals: Renko charts generate clear entry and exit signals based on brick formations and trend reversals. Traders can use these signals to time their trades more effectively and minimize risks.
Volatility Measurement: Renko charts can also help in assessing market volatility, as the brick size remains constant regardless of market conditions. A series of small bricks indicate low volatility, while large bricks signify high volatility.
Pattern Recognition: Patterns such as double tops, double bottoms, and trend continuation patterns are easily identifiable on Renko charts, aiding traders in making informed decisions based on price patterns.
Conclusion:
Renko charts offer a unique perspective on price action, focusing solely on significant price movements while filtering out noise. By visualizing price trends in a clear and concise manner, Renko charts empower traders to make informed decisions and capitalize on trading opportunities more effectively. Whether used independently or in conjunction with other technical analysis tools, Renko charts have proven to be a valuable asset in the arsenal of traders and analysts, enhancing their ability to navigate the dynamic world of financial markets.
0 notes
Text
What are the important chart types in share market?

In the share market, several types of charts are used to analyze price movements, identify trends, and make trading decisions. Some of the important chart types used in the share market include:
Line Charts:
Line charts are simple and commonly used in the share market.
They display the closing prices of a security over a specific period by connecting the closing prices with a line.
Line charts help in identifying trends and patterns in price movements over time.
Bar Charts:
Bar charts provide more detailed information compared to line charts.
Each bar represents the high, low, open, and close prices of a security for a specific period.
Bar charts also show the trading range and price direction (up or down) within the specified time frame.
Candlestick Charts:
Candlestick charts are similar to bar charts but provide additional visual cues about price movements.
Each candlestick represents the open, high, low, and close prices of a security for a specific period.
The body of the candlestick (the rectangle) shows the opening and closing prices, while the "wicks" (the lines above and below the body) represent the high and low prices.
Candlestick patterns are widely used by traders to identify potential trend reversals and continuation patterns.
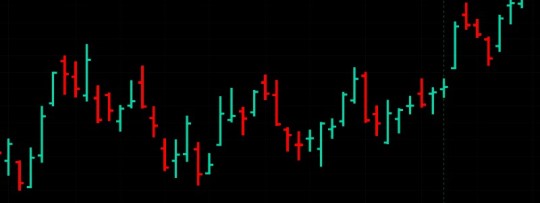
OHLC Charts (Open-High-Low-Close Charts):
OHLC charts are similar to candlestick charts but without the visual representation of candlesticks.
They display the open, high, low, and close prices of a security for a specific period using vertical lines with horizontal dashes.
OHLC charts provide the same information as candlestick charts but in a different visual format.
Renko Charts:
Renko charts focus on price movements and filter out noise by only plotting bricks (or boxes) when the price moves beyond a predefined amount.
Each brick represents a fixed price movement, and bricks are not drawn during periods of consolidation.
Renko charts help traders identify trends and reversals more clearly by removing insignificant price fluctuations.
Point and Figure Charts:
Point and figure charts are used to identify support and resistance levels and trends.
Instead of using time intervals, point and figure charts use price movements to plot Xs and Os on the chart.
Xs represent rising prices, while Os represent falling prices.
Point and figure charts are particularly useful for long-term trend analysis and identifying price objectives.
One of the best way to start studying the stock market to Join India’s best comunity classes Investing daddy invented by Dr. Vinay prakash tiwari . The Governor of Rajasthan, the Honourable Sri Kalraj Mishra, presented Dr. Vinay Prakash Tiwari with an appreciation for creating the LTP Calculator.
LTP Calculator the best trading application in India.
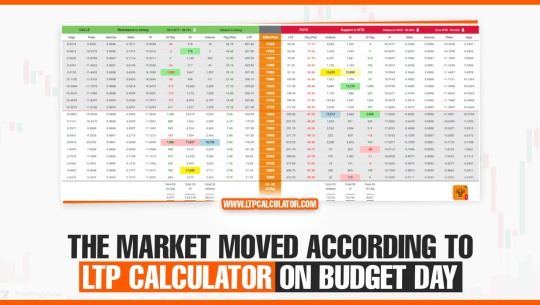
You can also downloadLTP Calculator app by clicking on download button.

These are some of the important chart types used in the share market for technical analysis and trading decisions. Traders often use a combination of these chart types to gain insights into market behavior and make informed trading decisions.
0 notes
Text
Types of Charts in the Stock Market

In the dynamic world of the stock market, information is not just valuable; it's essential. Traders, investors, and analysts rely on a variety of tools to interpret and analyze market data. Among these tools, charts stand out as indispensable assets. Charts visually represent price movements, trends, and patterns, offering valuable insights into market behavior. Let's delve into the world of stock market charts, exploring their types and how they provide a window into the market's intricacies.
1. Line Charts
Line charts are perhaps the simplest and most familiar type. They plot the closing prices of a stock or index over a specified time frame, connecting the dots to form a continuous line. Line charts are excellent for showing long-term trends and are especially useful for beginners due to their simplicity. However, they may lack some granularity compared to other chart types.
2. Bar Charts
Bar charts are more detailed than line charts, providing additional information within each data point. Each bar represents a specific period (like a day, week, or month) and displays the opening, closing, high, and low prices for that period. The bar's vertical line indicates the trading range, with small horizontal lines on each side showing the open and close prices. Bar charts are versatile, offering a snapshot of price movement and volatility.
3. Candlestick Charts
Candlestick charts originated in Japan and have become immensely popular among traders worldwide. Like bar charts, each candlestick represents a period of time (day, week, etc.) and displays the open, high, low, and close prices. The "body" of the candlestick illustrates the opening and closing prices, colored differently depending on whether the stock price rose or fell during that period. The "wicks" or "shadows" represent the high and low prices. Candlestick charts are prized for their ability to reveal market sentiment and potential trend reversals.
4. Area Charts
Area charts are similar to line charts but with the area beneath the line filled in, providing a visual representation of the price movements' magnitude. They are useful for emphasizing changes in trends or the overall size of movements over time. Area charts are effective for comparing multiple stocks or indices on the same chart, showing how they stack up against each other.
5. Renko Charts
Renko charts are unique in that they focus solely on price movements and filter out time. Instead of plotting prices against time, Renko charts create "bricks" where each brick represents a price movement. If the price moves beyond a predefined amount, a new brick is added in the new direction. These charts are excellent for identifying trends and filtering out market noise.
6. Point and Figure Charts
Point and Figure charts are another type that eliminates the noise of time and focuses solely on price movements. They use Xs and Os to represent increases and decreases in prices, respectively. Each column of Xs or Os represents a specific price range and helps traders identify support, resistance levels, and potential breakouts.
7. Heikin-Ashi Charts
Heikin-Ashi charts are a variation of candlestick charts, designed to filter out market noise and emphasize trends. The calculations for these charts involve averaging the open, close, high, and low prices of the previous period to create a smoother chart. Traders use Heikin-Ashi charts to identify trends more easily and stay in trades longer.
Conclusion
In the intricate world of the stock market, charts are indispensable tools for traders and investors alike. Each type of chart in the Stock Market offers a unique perspective on price movements, trends, and market sentiment. Whether you're a seasoned trader or just starting, understanding these chart types can provide valuable insights into market behavior. From the simplicity of line charts to the detailed analysis of candlesticks and beyond, the world of stock market charts is vast and diverse, ready to be explored by those seeking to navigate the complexities of trading and investing.
0 notes
Text
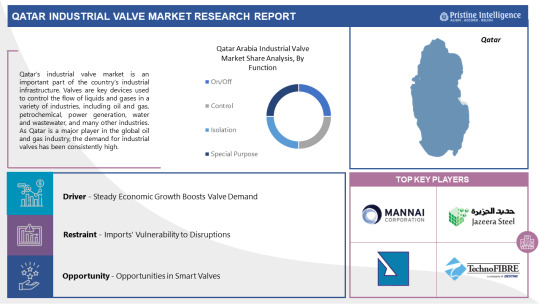
Qatar Industrial Valve Market: Forthcoming Trends and Share Analysis by 2030
The Industrial Valve is Expected to Grow at a Significant Growth Rate, and the Forecast Period is 2023-2030, Considering the Base Year as 2022.
An essential component of the nation's industrial infrastructure is the industrial valve market in Qatar. In many different industries, such as oil and gas, petrochemicals, power production, water and wastewater, and many more, valves are essential components that regulate the flow of liquids and gases. Due to Qatar's significant role in the global oil and gas sector, there has always been a high need for industrial valves.
The industrial valves market in Qatar is influenced by variables such as national economic development, government infrastructure spending, and programs aimed at expanding the industry. The need for valves has grown recently due to the expansion of the energy and construction industries.
Offering a broad range of valve types and sizes for varied industrial needs, major multinational valve makers and local businesses compete in this market. Furthermore, there is a growing need for sophisticated valves that may help save energy and safeguard the environment as a result of the increased emphasis on sustainable and efficient industrial operations.
Get Full PDF Sample Copy of Report: (Including Full TOC, List of Tables & Figures, Chart) @
Updated Version 2024 is available our Sample Report May Includes the:
Scope For 2024
Brief Introduction to the research report.
Table of Contents (Scope covered as a part of the study)
Top players in the market
Research framework (structure of the report)
Research methodology adopted by Worldwide Market Reports
Moreover, the report includes significant chapters such as Patent Analysis, Regulatory Framework, Technology Roadmap, BCG Matrix, Heat Map Analysis, Price Trend Analysis, and Investment Analysis which help to understand the market direction and movement in the current and upcoming years.
Leading players involved in the Qatar Industrial Valve Market include:
Mannai Industrial (Qatar), Al-Jazeera Tube Mills Company (Qatar), Faisal Jassim Trading Company LLC (Qatar), Techno Fibre Middle East W.L.L. (Qatar), Flowline Mechanical Engineering (Qatar), RENKO Group (Qatar), International Gulf Trading Company (IGTC) (Qatar), United International Trading Company (UITC) (Qatar), Elite Middle East (Qatar), Al Jaber Trading & Contracting Company (Qatar), Aswan International Engineering Company (Qatar), Al Shoumoukh Group (Qatar), Hamad and Mohd Al Futtaim Co. LLC (HMAF) (Qatar), KBS Enterprises W.L.L. (Qatar), Al-Asmakh Facilities Management Company W.L.L. (Qatar), Qatar Air Distribution Network Manufacturing Factory W.L.L. (QADNET) (Qatar), Techno Q (Qatar), Power International Holding (Qatar), Qatar Integrated Plastic Bags Factory (Qatar), Qatar Plastic Products Company (QPPC) (Qatar) and other major players.
If You Have Any Query Qatar Industrial Valve Market Report, Visit:
Segmentation of Qatar Industrial Valve Market:
By Type
Ball
Globe
Gate
Butterfly
Plug
Check
By Material
Steel
Brass
Bronze
Cast Iron
Plastic
By Size
< 1”
1”–6”
6”–25”
25”–50”
50”
By Application
Oil & Gas
Power
Energy
Chemical
Water & Waste Treatment
By Function
On/Off
Control
Isolation
Special Purpose
Highlights from the report:
Market Study: It includes key market segments, key manufacturers covered, product range offered in the years considered, Global Qatar Industrial Valve Market, and research objectives. It also covers segmentation study provided in the report based on product type and application.
Market Executive Summary: This section highlights key studies, market growth rates, competitive landscape, market drivers, trends, and issues in addition to macro indicators.
Market Production by Region: The report provides data related to imports and exports, revenue, production and key players of all the studied regional markets are covered in this section.
Qatar Industrial Valve Market Profiles of Top Key Competitors: Analysis of each profiled Roll Hardness Tester market player is detailed in this section. This segment also provides SWOT analysis of individual players, products, production, value, capacity, and other important factors.
If you require any specific information that is not covered currently within the scope of the report, we will provide the same as a part of the customization.
Acquire This Reports: -
About Us:
We are technocratic market research and consulting company that provides comprehensive and data-driven market insights. We hold the expertise in demand analysis and estimation of multidomain industries with encyclopedic competitive and landscape analysis. Also, our in-depth macro-economic analysis gives a bird's eye view of a market to our esteemed client. Our team at Pristine Intelligence focuses on result-oriented methodologies which are based on historic and present data to produce authentic foretelling about the industry. Pristine Intelligence's extensive studies help our clients to make righteous decisions that make a positive impact on their business. Our customer-oriented business model firmly follows satisfactory service through which our brand name is recognized in the market.
Contact Us:
Office No 101, Saudamini Commercial Complex,
Right Bhusari Colony,
Kothrud, Pune,
Maharashtra, India - 411038 (+1) 773 382 1049 +91 - 81800 - 96367
Email: [email protected]
#Qatar Industrial Valve#Qatar Industrial Valve Market#Qatar Industrial Valve Market Size#Qatar Industrial Valve Market Share#Qatar Industrial Valve Market Growth#Qatar Industrial Valve Market Trend#Qatar Industrial Valve Market segment#Qatar Industrial Valve Market Opportunity#Qatar Industrial Valve Market Analysis 2023
0 notes
Text
Qatar Industrial Valve Market: Forthcoming Trends and Share Analysis by 2030

The Industrial Valve is Expected to Grow at a Significant Growth Rate, and the Forecast Period is 2023-2030, Considering the Base Year as 2022.
An essential component of the nation's industrial infrastructure is the industrial valve market in Qatar. In many different industries, such as oil and gas, petrochemicals, power production, water and wastewater, and many more, valves are essential components that regulate the flow of liquids and gases. Due to Qatar's significant role in the global oil and gas sector, there has always been a high need for industrial valves.
The industrial valves market in Qatar is influenced by variables such as national economic development, government infrastructure spending, and programs aimed at expanding the industry. The need for valves has grown recently due to the expansion of the energy and construction industries.
Offering a broad range of valve types and sizes for varied industrial needs, major multinational valve makers and local businesses compete in this market. Furthermore, there is a growing need for sophisticated valves that may help save energy and safeguard the environment as a result of the increased emphasis on sustainable and efficient industrial operations.
Get Full PDF Sample Copy of Report: (Including Full TOC, List of Tables & Figures, Chart) @
Updated Version 2024 is available our Sample Report May Includes the:
Scope For 2024
Brief Introduction to the research report.
Table of Contents (Scope covered as a part of the study)
Top players in the market
Research framework (structure of the report)
Research methodology adopted by Worldwide Market Reports
Moreover, the report includes significant chapters such as Patent Analysis, Regulatory Framework, Technology Roadmap, BCG Matrix, Heat Map Analysis, Price Trend Analysis, and Investment Analysis which help to understand the market direction and movement in the current and upcoming years.
Leading players involved in the Qatar Industrial Valve Market include:
Mannai Industrial (Qatar), Al-Jazeera Tube Mills Company (Qatar), Faisal Jassim Trading Company LLC (Qatar), Techno Fibre Middle East W.L.L. (Qatar), Flowline Mechanical Engineering (Qatar), RENKO Group (Qatar), International Gulf Trading Company (IGTC) (Qatar), United International Trading Company (UITC) (Qatar), Elite Middle East (Qatar), Al Jaber Trading & Contracting Company (Qatar), Aswan International Engineering Company (Qatar), Al Shoumoukh Group (Qatar), Hamad and Mohd Al Futtaim Co. LLC (HMAF) (Qatar), KBS Enterprises W.L.L. (Qatar), Al-Asmakh Facilities Management Company W.L.L. (Qatar), Qatar Air Distribution Network Manufacturing Factory W.L.L. (QADNET) (Qatar), Techno Q (Qatar), Power International Holding (Qatar), Qatar Integrated Plastic Bags Factory (Qatar), Qatar Plastic Products Company (QPPC) (Qatar) and other major players.
If You Have Any Query Qatar Industrial Valve Market Report, Visit:
Segmentation of Qatar Industrial Valve Market:
By Type
Ball
Globe
Gate
Butterfly
Plug
Check
By Material
Steel
Brass
Bronze
Cast Iron
Plastic
By Size
< 1”
1”–6”
6”–25”
25”–50”
50”
By Application
Oil & Gas
Power
Energy
Chemical
Water & Waste Treatment
By Function
On/Off
Control
Isolation
Special Purpose
Highlights from the report:
Market Study: It includes key market segments, key manufacturers covered, product range offered in the years considered, Global Qatar Industrial Valve Market, and research objectives. It also covers segmentation study provided in the report based on product type and application.
Market Executive Summary: This section highlights key studies, market growth rates, competitive landscape, market drivers, trends, and issues in addition to macro indicators.
Market Production by Region: The report provides data related to imports and exports, revenue, production and key players of all the studied regional markets are covered in this section.
Qatar Industrial Valve Market Profiles of Top Key Competitors: Analysis of each profiled Roll Hardness Tester market player is detailed in this section. This segment also provides SWOT analysis of individual players, products, production, value, capacity, and other important factors.
If you require any specific information that is not covered currently within the scope of the report, we will provide the same as a part of the customization.
Acquire This Reports: -
About Us:
We are technocratic market research and consulting company that provides comprehensive and data-driven market insights. We hold the expertise in demand analysis and estimation of multidomain industries with encyclopedic competitive and landscape analysis. Also, our in-depth macro-economic analysis gives a bird's eye view of a market to our esteemed client. Our team at Pristine Intelligence focuses on result-oriented methodologies which are based on historic and present data to produce authentic foretelling about the industry. Pristine Intelligence's extensive studies help our clients to make righteous decisions that make a positive impact on their business. Our customer-oriented business model firmly follows satisfactory service through which our brand name is recognized in the market.
Contact Us:
Office No 101, Saudamini Commercial Complex,
Right Bhusari Colony,
Kothrud, Pune,
Maharashtra, India - 411038 (+1) 773 382 1049 +91 - 81800 - 96367
Email: [email protected]
#Qatar Industrial Valve#Qatar Industrial Valve Market#Qatar Industrial Valve Market Size#Qatar Industrial Valve Market Share#Qatar Industrial Valve Market Growth#Qatar Industrial Valve Market Trend#Qatar Industrial Valve Market segment#Qatar Industrial Valve Market Opportunity#Qatar Industrial Valve Market Analysis 2023
0 notes
Text
Techninė analizė. Grafikų tipas. Barai ir Žvakės
Neieškokime tiesos ten, kur jos nėra; neklauskime tų, kas jos nežino. Vienintelė birža mums suteikia visą teisingą ir reikalingą informaciją. Tenka išgirsti klausimas: Ar veikia TA Lietuvos biržoje? Ir pan. Nekorektiški tokie klausimai savo esme.
#technicalanalysis #charts #japanesecandlestick #line #
Grafikų tipas. Neieškokime tiesos ten, kur jos nėra; neklauskime tų, kas jos nežino. Vienintelė birža mums suteikia visą teisingą ir reikalingą informaciją. Tenka išgirsti klausimas: Ar veikia TA Lietuvos biržoje, Kriptorinkoje? Ir pan. Nekorektiški tokie klausimai savo esme.
(more…)
View On WordPress
#Heikin Ashi#Investavimas#Kagi#Kagi grafikas#Money#Pinigai#Profitunity#Renko chart#Spekuliavimas#Techninė analizė
0 notes
Link
0 notes
Text
Miami Music Week Chart by Maxinne

- Artists: Maxinne
DATE CREATED: 2024-03-11
GENRES: Tech House, House, Minimal / Deep Tech
Tracklist :
1. Jerëmie. - Space Blum(Original Mix)
2. Maxinne - Good Thang(Original Mix)
3. Sally C - Control(Original Mix)
4. Jerome Withers, Calum Percival - Nerve(Original Mix)
5. Viot, Vitor Vinter - FMF(Original Mix)
6. Lubelski, Wyatt Marshall - Out Of Phase(Maxinne Remix)
7. Adrian Mart, Kuff - Toxic Fan(Original Mix)
8. Skizzo - Sunny(Extended Mix)
9. Charles Ramirez, Luca M, JUST2 - Up & Down(Franky Rizardo Remix)
10. Josh Kalker - To The Top(Original Mix)
11. Lorenzo De Blanck - Feel My Desire(Original Mix)
12. Mason Collective, RENKO. - Roman's Laugh(Original Mix)
13. Class Sick - Freak Like Me(Extended Mix)
14. Jansons - Messan(Original Mix)
15. Gabriele Toma - Back It(Original Mix)
Download FileCat
Read the full article
0 notes
Last Seen Blogs

showtimcs
say my name


zamireane
Zami

sourcecitedfacts
Source-Cited Facts

redandblacktac
COMMISSIONS ARE OPEN