#adult dali x y/n
Text
𝓗𝓲 𝓽𝓱𝓮𝓻𝓮!
I’m 𝓒𝓱𝓲𝓱𝓪𝓻𝓾-𝓬𝓱𝓪𝓷 and I know some knows me already from my KNY fanfics! But here I am! Exploring Migi to Dali as I had seen a comment that there are only few fics for this wonderful anime.
As what I've said before, I will only write for adult Migi and Dali as I am not comfy writing about minor boys. So here we are!
Let's start with a simple HC for these wonderful twin XD emphasise on the WONDERFUL hahaha!
Tagging you guys as you commented on my Migi to Dali post before~
@ungovernable-corn-crab @jiya-beloved @dciphe-r
𝓝𝓸𝓷-𝓓𝓮𝓶𝓸𝓷 𝓢𝓵𝓪𝔂𝓮𝓻 𝓜𝓪𝓼𝓽𝓮𝓻𝓵𝓲𝓼𝓽
𝓓𝓮𝓶𝓸𝓷 𝓢𝓵𝓪𝔂𝓮𝓻 𝓜𝓪𝓼𝓽𝓮𝓻𝓵𝓲𝓼𝓽
𝒀𝒐𝒖𝒓 𝑬𝒏𝒊𝒈𝒎𝒂𝒕𝒊𝒄 𝑩𝒐𝒚𝒇𝒓𝒊𝒆𝒏𝒅
𝐂𝐡𝐚𝐫𝐚𝐜𝐭𝐞𝐫𝐬: 𝐀𝐝𝐮𝐥𝐭 𝐌𝐢𝐠𝐢 𝐚𝐧𝐝 𝐀𝐝𝐮𝐥𝐭 𝐃𝐚𝐥𝐢 𝐗 𝐅𝐞𝐦!𝐑𝐞𝐚𝐝𝐞𝐫
Content Warnings: None ^^

(Images aren't mine. Credits to the rightful owners)


🍑𝐌𝐢𝐠𝐢🍑
» As you know how emotional your boyfriend is, Migi is always clingy. Yes, it might be funny, but the guy wants you to always assure him how much you love him.
» He never ceases to tell you how pretty you are. He loves comparing you to Sali-chan, who appears to be his first love and who also turned out to be just the persona of his twin brother, Dali. At first, you found it weird. But when you knew about his life, you understood everything and appreciated your boyfriend more.
» Sometimes you end up thinking that Migi's love languages are all five. He's very sweet and affectionate, especially with his words. He loves giving you his time. He is clingy and loves physical affection. Migi is also ready to give you his time, all the gifts in the world, and even all of him if you want to.
» But of course, not every day is sunshine and roses. When there are challenges in your relationship, Migi is the one who will try to approach you first to solve them. He hates fights. He can put up a tantrum sometimes, but after that, he makes sure that he'll make it up to you.
» Migi is very enchanting and enigmatic, especially with how he handles things. You can't help but be amazed at how he moves and solves things. He's smart, and yet, he really needs that push from you. But, of course, things will never change.
» Migi can be so silly but you know that he is the only one who can make you happy.

🍑𝐃𝐚𝐥𝐢🍑
» Dali is definitely the serious one in the relationship. He's the rational one. Although he is not particularly outspoken regarding his emotions, the way he looks at you could stop your entire world.
» He isn't the kind of boyfriend who will throw compliments at you. He would rather show it to you instead. Or sometimes, he'll just end up teasing you, even if he meant the other way around. Even without expressing it overtly, the individual genuinely adores your appearance and demeanour. You'll always find him looking at you.
» Dali doesn't believe in love languages. He thinks it is funny. But then, even if he won't notice it, he seems to have the physical touch, quality time, and acts of service. He's sweet but not too sweet. He'll steal touches and kisses, but not always. And yes, he'll make sure to give you time, no matter how busy he is with the university.
» But of course, not every day is sunshine and roses. Dali won't be the one to fix things whenever you fight. Yes, he can be hard on you, and that can be tough. But then, you know his weakness is you, yourself, and so you use that to get his attention again and make up. You'll end up talking about the "logical ways" to solve your issues.
» Dali is very enigmatic. Actually, if you don't know him, you'll think of him as the definition of a mystery. But of course, there are times when he can be vulnerable as well (even if you can just count it on your fingers). But the quantity doesn't matter; it's the quality of relationship you have, and you know you can be proud of him as a boyfriend.
» Dali can be so serious, but you will know that you won't ever be complete without him by your side.

𝓣𝓱𝓪𝓷𝓴 𝔂𝓸𝓾 𝓯𝓸𝓻 𝓻𝓮𝓪𝓭𝓲𝓷𝓰!
Really hope you liked it!
There will be more non-KNY fanfics soon. So be on the look out!
See you on my next fics. Feel free to reblog, request, and comment!
Ja ne~
~𝓒𝓱𝓲𝓱𝓪𝓻𝓾-𝓬𝓱𝓪𝓷 🍑
#migi to dali fanfic#migi to dali#migi and dali#migi and dali fanfic#migi and dali x reader#migi and dali x you#migi and dali x y/n#adult migi and dali#migi to dali x reader#migi to dali x you#migi to dali x y/n#migi x reader#migi x you#migi x y/n#dali x reader#dali x you#dali x y/n#adult migi x reader#adult migi x you#adult migi x y/n#adult dali x reader#adult dali x you#adult dali x y/n#migi to dali headcanons#migi and dali headcanons#migi headcanon#dali headcanon
50 notes
·
View notes
Text
i was tagged by @what-grace-has-forgiveness
rules: copy this post into a new text post, remove my answers and put in yours, and when you are done tag up to 10 people and also tag the person who tagged you… and most importantly, have fun!
a - age: major (as opposed to minor)
b - biggest fear: being alone in the middle of the ocean
c - current time: 7:41 pm
d - drink you last had: vanilla coke
f - favorite song: knight of firmament is pretty cool
g - ghosts, are they real: yes, why else to my socks go missing randomly?
h - hometown: daly city, ca
i - in love with: strong platonic relationships
j - jealous of: athletic people, cause that is what i used to be
k - killed someone: indirectly - in games? probably. with intention - in my dreams? i have felled many a zombie.
l - last time you cried: 4 years
m - middle name: you wouldn’t be able to pronounce it
n - number of siblings: 1 (and a very adorable dog)
o - one wish: being able to communicate with people normally for at least 5 minutes
p - person you last called/texted: my friend who moved in with her bae
q - question(s) you’re always asked: what’s so funny? (everything)
r - reasons to smile: puppies, large adult puppies
s - song last sang: because of you
t - time you woke up: 6:15 am
u - underwear color: orange
v - vacation destination: somewhere with super fast wifi and awesome buffets
w - worst habit: always rushing ahead
x - x-rays you’ve had: teeth and clavacle
y - your favorite food: eggs are such a diverse food item
z - zodiac sign: aries
i tag: @rean--schwarzer @contrarian-magician @manu-snow-universe @bizabert @asahoe @americankimchi @fanpersoning @tanoraqui
1 note
·
View note
Text
Regional Inequality in Dental Care Utilization in Japan: An Ecological Study Using the National Database of Health Insurance Claims
Abstract
Background
This study examined regional inequalities in dental care utilization in Japan and the association of dental care utilization with socioeconomic factors.
Methods
Using the Fourth National Database of Health Insurance Claims and Specific Health Checkups of Japan Open data, this ecological study analyzed 216 million pieces of aggregated data from April 2017 to March 2018. Nine indicators of dental care utilization were used: outpatient visits, outreach services, cavity fillings, pulpectomies, dental calculus removals, periodontal surgeries, tooth extractions, dental bridges, and dentures. Standardized claim ratios (SCRs) for these indicators were calculated for Japan’s 47 prefectures, which were divided into three groups based on the number of dental clinics per population, average income per capita, and the proportion of university enrollments. Associations of the dental care utilization with dental supply and regional socioeconomic factors were examined.
Findings
The ratios of maximum to minimum of SCRs were 1·4 for outpatient visits, 19·3 for outreach services, and 17·6 for periodontal surgeries. Dental supply was positively associated with outpatient visits, outreach services, dental calculus removal, and periodontal surgeries. Regional average income and educational level were positively associated with dental calculus removals, and negatively associated with pulpectomies, tooth extractions, dental bridges, and dentures.
Interpretation
In Japan, regional inequalities in dental care utilization exist for periodontal care and outreach services but are smaller for urgent and substantial dental care. Regional income and educational levels appear to have influence on dental care utilization.
Funding
Ministry of Health, Labour and Welfare of Japan (H31–19FA1001).
1. Background
Oral health inequalities still exist around the world [[1]
Kassebaum NJ
Smith AG
Bernabé E
et al.
Global, regional, and national prevalence, incidence, and disability-adjusted life years for oral conditions for 195 countries, 1990–2015: a systematic analysis for the global burden of diseases, injuries, and risk factors.]: they have been reported in the United States [2
Feng X
Sambamoorthi U
Wiener RC.
Dental workforce availability and dental services utilization in Appalachia: a geospatial analysis., 3
Mejia GC
Elani HW
Harper S
et al.
Socioeconomic status, oral health and dental disease in Australia, Canada, New Zealand and the United States., 4
Northridge ME
Kumar A
Kaur R.
Disparities in access to oral health care.], Europe [5Socioeconomic inequalities in the non-use of dental care in Europe., 6
Wamala S
Merlo J
Boström G.
Inequity in access to dental care services explains current socioeconomic disparities in oral health: the Swedish National Surveys of Public Health 2004–2005., 7
Schwendicke F
Krasowski A
Rossi JG
et al.
Dental service utilization in the very old: an insurance database analysis from northeast Germany., 8
Piotrowska DE
Jankowska D
Huzarska D
Szpak AS
Pędziński B.
Socioeconomic inequalities in use and non-use of dental services in Poland., 9Income-related inequalities in unmet dental care needs in Spain: traces left by the Great Recession.], Asia [10Inequality in unmet dental care needs among South Korean adults., 11
Limpuangthip N
Purnaveja S
Somkotra T.
Predisposing and enabling factors associated with public denture service utilization among older Thai people: a cross-sectional population-based study., 12
Rezaei S
Hajizadeh M
Irandoost SF
Salimi Y.
Socioeconomic inequality in dental care utilization in Iran: a decomposition approach.], Oceania [[3]
Mejia GC
Elani HW
Harper S
et al.
Socioeconomic status, oral health and dental disease in Australia, Canada, New Zealand and the United States.], and other countries and regions [[13]
Monteiro CN
Beenackers MA
Goldbaum M
et al.
Socioeconomic inequalities in dental health services in Sao Paulo, Brazil, 2003–2008.]. These reports highlight the fact that inequalities in oral health and dental care have been neglected worldwide [[14]
Watt RG
Daly B
Allison P
et al.
Ending the neglect of global oral health: time for radical action.]. Previous studies, including those mentioned above, have identified socioeconomic factors such as income and education and the number of dentists, and others as the causes of such inequalities [[15]
Reda SF
Reda SM
Thomson WM
Schwendicke F.
Inequality in utilization of dental services: a systematic review and meta-analysis.]. In the Global Goals for Oral Health 2020, the World Health Organization aimed to reduce oral health inequalities among different socioeconomic groups within countries and inequalities in oral health across countries [[16]
Peres MA
Macpherson LM
Weyant RJ
et al.
Oral diseases: a global public health challenge.]. The former goal is consistent with the Second Phase of the Healthy Japan 21 plan that was published in 2013, in which the Japanese government acknowledged regional and social inequalities in dental and oral health and emphasized the need for health promotion policies to reduce these inequalities [[17]Ministerial notification no. 430 of the Ministry of Health, Labour and Welfare.].In Japan, previous studies have examined the associations of inequalities in dental visits, number of treated teeth and missing teeth, and dental prosthesis use with socioeconomic factors by analyzing health survey data or healthcare insurance claims data in one region. These studies revealed a linear association between income level and dental visits [[18]Income effects on medical care visits by health insurance association insured persons (in Japanese).,[19]
Nishide A
Fujita M
Sato Y
Nagashima K
Takahashi S
Hata A.
Income-related inequalities in access to dental care services in Japan.]. Additionally, lower-income groups are less likely to use dental prostheses than are higher-income groups [[20]
Matsuyama Y
Aida J
Takeuchi K
et al.
Inequalities of dental prosthesis use under universal healthcare insurance.]. A previous study showed that individuals with fewer years of education had a higher number of treated teeth and a lower number of remaining teeth as compared to their counterparts [[21]
Ueno M
Ohara S
Inoue M
Tsugane S
Kawaguchi Y.
Association between education level and dentition status in Japanese adults: Japan public health center-based oral health study.]. These Japanese results are consistent with those in other Organisation for Economic Co-operation and Development (OECD)-member countries [[3]
Mejia GC
Elani HW
Harper S
et al.
Socioeconomic status, oral health and dental disease in Australia, Canada, New Zealand and the United States.,[8]
Piotrowska DE
Jankowska D
Huzarska D
Szpak AS
Pędziński B.
Socioeconomic inequalities in use and non-use of dental services in Poland.]. The studies mentioned above are, however, small-scale studies conducted in one region. To the best of the authors’ knowledge, no national-level analysis regarding regional inequality in dental care utilization has been conducted in Japan, mainly owing to challenges in data collection. Understanding the current status of regional inequality in dental care utilization at the national level is necessary for planning future dental and oral health policies in Japan. This study, for the first time, examined regional inequality in dental care utilization in Japan using a national-level healthcare claims dataset recently made available to the public. This study also examined the associations of dental care utilization and dental care supply with socioeconomic factors, such as economic and educational levels, in each region.
2. Methods
2.1 Dental care supply system in Japan
In Japan, the universal public healthcare insurance system covers both medical and dental care. Treatment of dental caries, periodontal disease, and oral surgery and provision of dental prostheses are covered by insurance with a 30% copayment for adults younger than 75 years and 10–20% for adults older than 75 years [[22]
Ikegami N
Yoo B-K
Hashimoto H
et al.
Japanese universal health coverage: evolution, achievements, and challenges.]. Dental care services for the total population are provided by approximately 100,500 dentists at 68,500 dental facilities. In 2017, the total public dental expenditure was approximately 26·5 billion USD (i.e., 2·9 trillion JPY at the 2017 exchange rate) [[23]Internal Revenue Service Yearly average currency exchange rates.]; therefore, expenditure per capita on dental care was approximately 209 USD (23,000 JPY). This figure accounted for 6·9% of total healthcare expenditures [[24]
Zaitsu T
Saito T
Kawaguchi Y.
The oral healthcare system in Japan.]. The number of dentists per 100,000 people was 79·6 in 2017, ranking Japan ninth among 28 OECD countries [[25]OECD Stat Health Care Resources 2017.] and ensuring an adequate dental service supply system.
2.2 Study design
An ecological study design at the prefectural level was adopted. The annual data (April 2017–March 2018) of dental care practices, aggregated at the prefectural level from dental care claims of public medical insurance for nearly the entire Japanese population, was used to examine regional differences in access to dental care and treatment. Additionally, the influence of the supply of dental care (number of dental clinics per 100,000 population) and socioeconomic factors (average income and university enrollment rate) in the prefectures were examined. Forty-seven prefectures in the administrative regions of Japan were divided into three groups according to the supply of dental care in the region (the number of dental clinics per 100,000 population) or socioeconomic factors (the average income per person and the proportion of university or college enrollment) to examine national differences in access to dental services and treatment.
2.3 Data sources
2.3.1 Demographics, dental supply, and socioeconomic data
As regional factors for the utilization of dental care, the number of dental clinics per 100,000 population, which indicates the supply of dental care, and the average income and college enrollment rate, which indicate socioeconomic factors, were studied in each prefecture in Japan, with reference to previous literature. To calculate these regional factors, the official data of the population, the number of dental clinics, the average income per person, and the proportion of universities or colleges (including junior colleges, that is, 2- or 3-year programs) in each prefecture were used.
The following datasets were also used: Vital Statistics in 2017 [[26]Japanese Ministry of Health, Labour and Welfare
Vital statistics in 2017.] for population data, Survey of Medical Institutions in 2017 [[27]Japanese Ministry of Health, Labour and Welfare
Survey of medical institutions in 2017.] for the number of dental clinics, ESRI Statistics Annual Report on Prefectural Accounts for average income [[28]Japanese Cabinet Office
ESRI Statistics Annual Report on Prefectural Accounts.], and School Basic Survey in 2017 [[29]Japanese Ministry of Health, Labour and Welfare
School basic survey in 2017.] for the proportion of universities or colleges.
2.3.2 Health data
The Fourth National Database of Health Insurance Claims and Specific Health Checkups of Japan (NDB) Open data [[30]
Itoh H
Saito T
Nojiri S
Hiratsuka Y
Yokoyama K.
National burden of the pharmaceutical cost of wet compresses and its cost predictors: nationwide cross-sectional study in Japan.,[31]
Katano H
Ozeki N
Kohno Y
et al.
Trends in arthroplasty in Japan by a complete survey, 2014–2017.], which contain information on medical claims over the course of one year (April 2017 to March 2018) for nearly the entire population (approximately 126·2 million people) of Japan was used. The dental treatment codes on 216 million medical claims for dental treatment, excluding hospitalization treatment, were analyzed using data aggregated at the prefectural level. Since 2009, the Japanese Ministry of Health, Labour and Welfare has promoted the development of the NDB, and it aggregates all medical, dental, and pharmaceutical claims (covered primary, secondary, and tertiary care). Since 2016, the main aggregated data from the NDB have been published online as NDB Open Data. The NDB includes virtually all relevant information, such as patients’ sex and age, inpatient and outpatient appointments, diagnoses, medical/dental treatments, procedures, and prescribed medications provided through healthcare insurance.
2.4 Dental care indicators
The nine chosen indicators representing dental care utilization are as follows: outpatient visits, outreach services (dental care at home or in a nursing home for people who have difficulty visiting a dental clinic, such as older people receiving nursing care) representing access to dental services, cavity fillings, pulpectomies representing caries treatments, dental calculus removal, periodontal surgeries representing periodontal treatments, tooth extractions (with the exception of deciduous or impacted teeth) representing terminal treatment of teeth, dental bridges, and dentures representing occlusal restorative treatments (see Supplementary Table 2 for more details).
Table 1Standardized claim ratios of the nine indicators representing dental care utilizations
2.5 Standardized claim ratio (SCR)
Each indicator was standardized using an indirect method stratified by age, and sex, as described below. The standardized claim ratios (SCRs) of the nine indicators were then calculated in each of the 47 prefectures.
As an index to show the level of a target prefecture of the medical claims relative to the whole Japan, standardized claim ratio (SCR) has been developed32 as adjusting both sex ratio and age distribution, which was defined as:
Standardizedclaimratio(SCR)=ObservednumberofclaimsExpectednumberofclaims×100
Here observed claims are the total number of claims in a target prefecture in a year, and expected claims are the number of claims in a year if the situation of submitting claims (sex and age specific claims rate) of whole Japan was assumed for the population in the target prefecture. Expected number of claims is calculated as,
Expectednumberofclaims=∑sex,ageagegroups(populationofasexandagegroupinatargetprefecture×sexandagespecificclaimrateofthesexandagegroupinwholeJapan)
where the standard population of 2017 is applied for whole Japan, and sex- and age-specific groups were the total 2 × 18=36 groups of the combinations of (males, females) × (0-4,5-9,….,85 and over). Here, sex- and age- specific claim rate is, sex- and age- specific claim rate = (total claims for each sex and age group in a year) / (population for the sex and age group in a year).
The SCR is an index of the level of dental care utilization relative to whole Japan (100 for whole Japan) adjusted by sex ratio and age distribution of target prefecture with indirect method, which is similar to standardized mortality ratio.
SCR of 100 indicates the number of sex- and age- adjusted claims in a prefecture are equal to the whole Japan, which means the prefecture is the same level as the whole Japan for dental care utilization. SCR of higher(smaller) than 100 means the more(less) frequent level in dental care utilization relative to whole Japan.
The SCR can provide an objective and relative understanding of the nationwide status of medical care provision in Japan, and it can also be used to compare the status of medical care provision among regions. Therefore, it is used in research on regional differences in medical care [[32]
Murakami G
Muramatsu K
Hayashida K
Fijimori K
Matsuda S.
Ecological analysis of factors associated with mortality of cerebral infarction in Japan.]. Additionally, since it can be quickly calculated from the aggregated data, it is also used as an indicator for policymakers of national and prefectural governments to formulate medical plans.
As seen in the definition of SCR, the easiness to access to dental clinics (the concentration of dental clinics) is not adjusted. So, for examining regional difference in dental supply. we defined the supply-adjusted SCR (supply-adjusted SCR) as, supply adjusted SCR in a target prefecture = SCR / the number of dental clinics per 100,000 population
2.7 Statistical analysis
Dental care supply (i.e., the number of dental clinics per 100,000 population) and socioeconomic factors (economic level: average income per capita, educational level: the proportion of university enrollments) were configured to show regional inequality (differences) in Japan.
Regional differences in dental care utilization (outpatient visits, outreach services, cavity fillings, pulpectomies, dental calculus removals, periodontal surgeries, tooth extractions, dental bridges, dentures) were configured and tabulated using SCR.
We divided the 47 prefectures into three groups by tertile based on the number of dental clinics per 100,000 population, average income per person, and proportion of university or college enrollments. The associations of dental care utilization (nine SCRs) with dental care supply were then explored by the differences among the three groups (a) the number of dental clinics. Next, the associations of dental care utilization (nine supply-adjusted standardized claim ratios) with socioeconomic factors (economic or educational) were explored among the three groups based on (b) average income per person and (c) the proportion of university or college enrollments (Figures 1b and 1c, Supplementary Table 1).
Figure 1(a) Map of 47 prefectures categorized into three groups based on the number of dental clinics per 100,000 population
Show full caption
(b) Map of 47 prefectures categorized into three groups based on the average income per person
(c) Map of 47 prefectures categorized into three groups based on the proportion of university or college enrollment
Each difference among the three levels of groups was explored using rank statistics (Mann-Whitney test) with no adjustment for pairwise comparisons [[33]No adjustments are needed for multiple comparison.]. A two-sided p-value of less than 0·05 was considered significant. Statistical analyses were performed using Stata/16·0 (Stata-Corp LLC, 4905 Lakeway Drive, College Station, Texas 77845 USA).
2.8 Ethical considerations
This study was approved by the Research Ethics Committee of the University of Tsukuba (No. 1446). There was no direct patient involvement in this study. The NDB Open Data are anonymized medical claims data compiled and released by the Japanese Ministry of Health, Labour and Welfare; thus, the data do not identify individual patients and do not constitute personal information. Therefore, informed consent was waived.
2.9 Role of the funding source
This work was supported by a Health and Labour Sciences Research Grant from the Ministry of Health, Labour and Welfare of Japan (multidisciplinary research project on measures against lifestyle-related diseases such as cardiovascular diseases and diabetes mellitus). The research project aimed at the development of new evaluation indicators and methods for the preservation of dental and oral health: health services research to reduce health inequalities in Japan (no. H31-19FA1001, the principal investigator: Nanako Tamiya, MD). The funding source of this study had no role in study design, data collection, data analysis, data interpretation, or writing the manuscript.
3. Results
For the SCRs of the nine indicators, the median, mean, maximum, minimum, the ratios of maximum to minimum, and distribution are shown in Table 1 and Figure 2. The ratios of maximum to minimum of SCRs were 1·4 for outpatient visits and 19·3 for outreach services. For dental procedures, the ratios of maximum to minimum of SCRs were 1·5 for cavity fillings, 1·4 for pulpectomies, 3·1 for dental calculus removals, 17·6 for periodontal surgeries, 1·3 for tooth extractions, 1·7 for dental bridges, and 1·5 for dentures (see Supplementary Table 3-1 for the results in each prefecture).
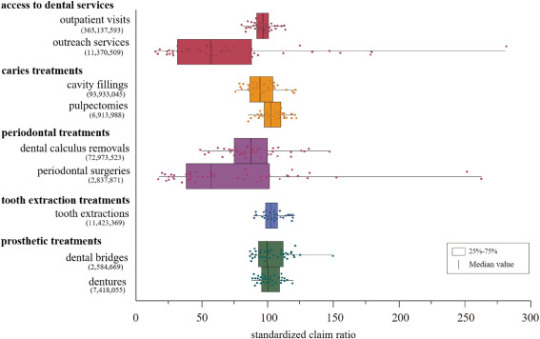
Figure 2Standardized claim ratios of the nine indicators representing dental care utilization
Show full caption
The dots indicate the following: red for access to dental services, yellow for caries treatments, purple for periodontal treatments, blue for tooth extraction treatments, and green for prosthetic treatments. Bold text represents the category of the indicators. ( ) :number of dental care records.
The mean number of dental clinics per 100,000 people of the 47 prefectures was 49·8. In the higher, medium, and lower groups, the mean values were 56·2 (range: 51·2–77·5), 49·2 (range: 47·8–50·5), and 43·6 (range: 38·0–46·8), respectively. The mean prefectural average income per resident of the 47 prefectures was approximately 26,500 USD (2·91 million JPY). In the higher, medium, and lower groups, the mean values were 30,100(range: 27,400–48,600) USD (3·31 (range: 3·01–5·35) million JPY), 26,200 (24,900–27,000) USD (2·88 (2·74–2·97) million JPY), and 23,000 (20,600–24,800) USD (2·53 (2·27–2·73) million JPY), respectively. The mean percentage of university or college education attainment of all 47 prefectures was 51·2%. In the higher, medium, and lower groups, the mean values were 58·6% (range: 54·2–66·2), 50·6% (47·2–53·1), and 44·2% (39·5–46·9), respectively (Supplementary Table 1).
The number of dental clinics per 100,000 people was positively associated with outpatient visits (pFigure 3, Supplementary Table 4-1).
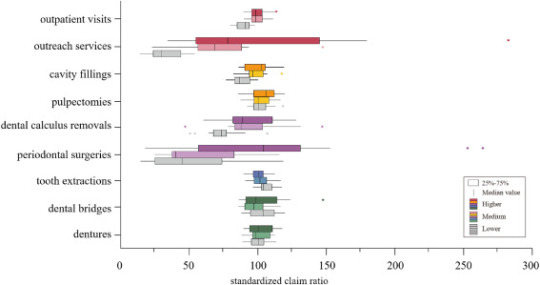
Figure 3Comparison of standardized claim ratios of dental services among the three groups based on the number of dental clinics per 100,000 population
Show full caption
The dots indicate the following: red for access to dental services, yellow for caries treatments, purple for periodontal treatments blue for tooth extraction treatments, and green for prosthetic treatments. The 47 prefectures were divided into three groups by tertile (higher: 16, medium: 15, and lower:16) according to the number of dental clinics per 100,000 population. Each difference of the standardized claim ratio based on the nine indicators among three groups of the number of dental clinics per 100,000 population was explored using rank statistics (Mann-Whitney test) without adjustment for multiple comparisons.
The average income per person was positively associated with dental calculus removals (p=0·024 L–H) but was negatively associated with pulpectomies (p=0·022 L–M), tooth extractions (p=0·033 L–M), dental bridges (p=0·018 L–M), and dentures (p=0·010 L–M, p=0·042 L–H) (Figure 4, Supplementary Table 4-2-1).
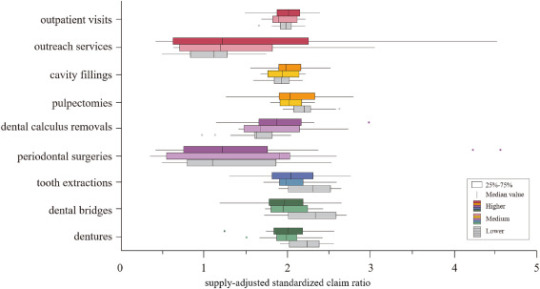
Figure 4Comparison of supply-adjusted standardized claim ratios of dental services among the three groups based on the regional average income
Show full caption
The dots indicate the following: red for access to dental services, yellow for caries treatments, purple for periodontal treatments, blue for tooth extraction treatments, and green for prosthetic treatments. The 47 prefectures were divided into three groups by tertile (higher: 16, medium: 15, and lower:16) according to regional average income. Each difference of the supply-adjusted standardized claim ratios based on the nine indicators among the three groups of regional average income was explored using rank statistics (Mann-Whitney test) without adjustment for multiple comparisons.
The proportion of university or college enrollments was positively associated with outreach services (p=0·002 L–H, p=0·004 M–H) and dental calculus removals (p=0·001 L–H, p=0·024 M–H), but was negatively associated with pulpectomies (p=0·018 L–H), tooth extractions (p=0·011 L–M, p=0·004 L–H), dental bridges (pFigure 5, Supplementary Table 4-3-1).
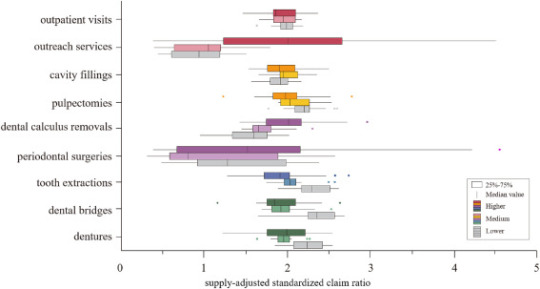
Figure 5Comparison of supply-adjusted standardized claim ratios of dental services among the three groups based on the proportion of university or college enrollment
Show full caption
The dots indicate the following: red for access to dental services, yellow for caries treatments, purple for periodontal treatments, blue for tooth extraction treatments, and green for prosthetic treatments. The 47 prefectures were divided into three groups by tertile (higher: 16, medium: 15, and lower:16) according to the proportions of university or college enrollment. Each difference of the supply-adjusted standardized claim ratios based on the nine indicators among the three groups of the proportion of university or college enrollment was explored using by rank statistics (Mann-Whitney test) without adjustment for multiple comparisons.
4. Discussion
Using the Fourth NDB Open Data, an ecological study was conducted to examine dental care utilization in Japan. Regional inequality in dental care utilization in Japan appears to be larger for outreach services and periodontal treatments and smaller for urgent and substantial dental care. When regional dental care supply was considered, regional income levels or educational levels appear to have an influence on dental care utilization.
The ratio of maximum to minimum of outpatient visits was 1·4, indicating a small regional inequality, while the ratio of maximum to minimum of SCRs of outreach services was 19·3, indicating considerable regional inequality. In Japan, outpatient dental visits decrease sharply after the age of 75 years [[34]Assessing the dental care needs of the dependent elderly and a short-term plan of the provision of home dental care in Japan (in Japanese).]. To meet the older population’s dental care needs, which have increased alongside a rapidly aging population, the government has taken measures to promote an increase in the provision of outreach services by giving dental care providers incentives in their medical fees [[35]Japanese Ministry of Health, Labour and Welfare
Revisions in the reimbursement of medical fees (dental care) for fiscal year 2016 (in Japanese).]. Future measures to promote outreach services should also consider the perspective of correcting the difference in supply between regions. Considerable inequalities in periodontal treatment were found nationwide; the ratio of maximum to minimum of SCRs of periodontal treatment were 3·1 for dental calculus removal and 17·6 for periodontal surgery. These values were higher than those of other dental treatments. Dental calculus removal, which is an initial preventive treatment against periodontal disease, is greatly influenced by geographical and socioeconomic factors [[36]
Murakami K
Aida J
Ohkubo T
Hashimoto H
Income-related inequalities in preventive and curative dental care use among working-age Japanese adults in urban areas: a cross-sectional study.]. Further, periodontal surgery is a conservative treatment for severe periodontal disease and is typically performed by periodontal disease specialists [[37]The Japanese Society of Periodontology
JSP clinical practice guideline for the periodontal treatment.]. A previous study reported regional inequalities in the number of periodontists compared to that of general dentists [[38]
Ishimaru M
Ono S
Matsui H
Yasunaga H
Koike S.
Geographic disparity in dental specialist using the national survey of physicians, dentists, and pharmacists in Japan (in Japanese).]. Periodontal surgery is often performed by periodontists and since there are regional differences in the number of periodontists, there may be regional differences depending on the supply of dental care []. Older individuals now retain more of their teeth than in the past, and the percentage of adults with periodontal disease has consequently been increasing. To respond to the expected increase in periodontal disease among older adults, it may be necessary to introduce incentives to promote the prevention and treatment of periodontal disease according to the actual situation of dental care in different regions. This can be done with reference to approaches taken in European countries, such as requiring health checkups and visits to the dental clinic at least once a year as a condition for prosthetic treatment coverage [[40]Who chooses prepaid dental care? A baseline report of a prospective observational study.], and by eliminating the uneven distribution of dentists involved in the treatment of periodontal disease.
The results show that outpatient visits, outreach services, cavity fillings, dental calculus removals, and periodontal surgeries were associated with the supply of dental care. In contrast, pulpectomies or tooth extractions to treat acute symptoms accompanying intense pain or inflammation and dental bridges or dentures to restore occlusal function were not associated with the supply of dental care. These results seem to suggest that dental care services for acute symptoms and occlusal recovery have been well established and are available across Japan.
The initial phase of dental caries treatment and periodontal treatment showed regional inequalities owing to differences in the number of dental clinics per region. Previous studies indicated that in areas with more (vs. less) medical facilities, visits for mild cases and recurrent visits are more common, as patients’ healthcare costs are lower and they have better access to services [[41]
Schulz M
Kunst AE
Brockmann H.
High educational attainment moderates the association between dental health-care supply and utilization in Europe.,[42]
Noguchi H, Shimizutani S, Masuda Y. Physician-induced demand for treatments for heart attack patients in Japan: evidence from the Tokai Acute Myocardial Study (TAMIS). ESRI Discussion paper series no. 147. June 2005: 1–25.
]. Additionally, in such areas, there is more physician-induced demand as a result of competition and information asymmetry. In areas with more dental clinics, there may potentially be excessive initial dental caries and periodontal treatments. In contrast, in areas with few dental clinics, dentists might spend most of their time providing first aid treatment or treating severe diseases; they might not have time to treat mild or moderate diseases.Concerning the associations between the indicators of dental care utilization with regional socioeconomic factors (i.e., average income per capita) and the proportion of university enrollments, in lower areas, initial or preventive treatments such as dental calculus removals were lower, and urgent or substantial treatments such as pulpectomies and tooth extractions were higher. These results are consistent with those of a previous study in which groups with higher levels of income had higher preventive dental care [[36]
Murakami K
Aida J
Ohkubo T
Hashimoto H
Income-related inequalities in preventive and curative dental care use among working-age Japanese adults in urban areas: a cross-sectional study.], groups with higher levels of education had higher preventive dental care, and groups with lower levels of education had more extractions [[21]
Ueno M
Ohara S
Inoue M
Tsugane S
Kawaguchi Y.
Association between education level and dentition status in Japanese adults: Japan public health center-based oral health study.]. In contrast, this study showed a greater use of dental bridges or dentures in lower-income areas as compared to higher-income areas. These results were inconsistent with a previous study [[20]
Matsuyama Y
Aida J
Takeuchi K
et al.
Inequalities of dental prosthesis use under universal healthcare insurance.]. Several reasons can be considered. First, this study only included prosthetic treatments covered by universal healthcare insurance and not those outside of it such as ceramic bridges, metal dentures, and dental implants. Therefore, the prosthetic treatments not covered by universal healthcare insurance for typical high-income patients may have been underestimated. Second, this study was based on the data of those who received dental care, while the previous study was based on a questionnaire survey of older adult residents in the community [[20]
Matsuyama Y
Aida J
Takeuchi K
et al.
Inequalities of dental prosthesis use under universal healthcare insurance.]. The previous study showed that 30% of older adults with 19 or fewer teeth did not use dental bridges or dentures, indicating an unmet need for dental care among those who did not visit dental clinics. Finally, this was an ecological study, whereas the previous study was performed on an individual basis. Prosthetic treatments were significantly more often provided in areas with lower income levels. This suggests that the need for occlusal restorative treatment may be higher in low-income areas [[43]
Tashiro A
Aida J
Shobugawa Y
et al.
Association between income inequality and dental status in Japanese older adults:Analysis of data from JAGES2013.] and that, under Japan’s universal healthcare system, occlusal restorative treatment is provided even in low-income areas.
These findings suggest that access to preventive dental care may be limited in the lower income or educational areas, and thus there may be fewer dentist visits for early-stage treatments such as dental calculus removal. In these areas, dental diseases may have already reached an advanced stage by the time the patient visits a dental clinic. As a result, tooth preservation becomes more difficult or even impossible, requiring subsequent occlusal rehabilitation. The tendency to visit a dental clinic after an advanced illness was observed in areas with lower average income levels or lower educational levels after adjusting for the number of dental clinics in each region.
This study has several limitations. First, as this is an ecological study, the results might not be suitable for extrapolation to an individual level owing to the risk of ecological fallacy. Second, since the NDB data were a collection of requests for reimbursement of medical fees paid for medical services provided through universal healthcare insurance, the data do not include treatments such as dental implants, ceramic bridges, or orthodontic treatments, as these are excluded from the insurance coverage. Thus, dental prosthetic treatment was likely to have been underestimated in urban areas where medical treatments not covered by insurance are performed more often. Third, the differences in oral health (e.g., number of remaining teeth) and the relative incidences of oral diseases in the regions were not considered. The number of remaining teeth in members of a community may be affected by the frequency of prosthetic treatments, and the percentage of edentulous people may affect the practice of periodontal disease treatment. Fourth, the validation of the data published by the NDB is ongoing [[44]Current status and issues of the national database.]. In recent years, research focusing on validation in medical and pharmacy claims has been conducted on data published using the NDB [[45]
Sato I
Yagata H
Ohashi Y.
The accuracy of Japanese claims data in identifying breast cancer cases.,[46]
Iwagami M
Aoki K
Akazawa M
et al.
Task force report on the validation of diagnosis codes and other outcome definitions in the Japanese receipt data.]. Thus, the validity of the published dental claims data needs to be verified in the future.
Despite these limitations, this study has a notable strength: It is the first national-level study to clarify regional inequality in dental care utilization including caries treatments, periodontal treatments, extractions, and prosthodontic treatments in Japan using NDB Open Data, which comprises comprehensive health insurance claims for nearly the entire population. Additionally, the associations between inequalities in dental care utilization with regional dental care supply and socioeconomic factors were examined. This study is a first important step in demonstrating regional inequalities in dental care utilization in Japan; thus, such inequalities can be appropriately addressed.
Declaration of Competing Interest
Takahiro Mori’s appointment as an associate professor at the University of Tsukuba was sponsored by JMDC Inc. in the financial year 2018 (i.e., April 2018–March 2019), by SMS CO., LTD. in the financial year 2019 (i.e., April 2019–March 2020), and by FAST DOCTOR CO., LTD in the financial year 2020 (i.e., April 2020–March 2021). JMDC Inc., SMS CO., LTD, and FAST DOCTOR CO., LTD did not play any role in the conception, designing, conducting, or reporting of this study.
Sakata Nobuo’s appointment as an associate professor at the University of Tsukuba was sponsored by JMDC Inc. in the financial year 2020 (i.e., April 2020–present). JMDC Inc. did not play any role in the conception, design, conduct, or reporting of this study.
The other authors declare that they have no competing interests.
source https://livehealthynews.com/regional-inequality-in-dental-care-utilization-in-japan-an-ecological-study-using-the-national-database-of-health-insurance-claims/
0 notes
Last Seen Blogs

nikolasverano
Nikolas Verano

pattou
You're my start, since forever

forsakenflora
heavens light.

onexan
one xan

avidaemlaudas
A vida em Laudas