#PhasePosts
Photo


The Neodymium-Iron-Boron Ternary System
Phase Poll #10 wrapped up yesterday with the final result as 42.5% Fe, 30% Nd, and 27.5% B. This ternary system is most well known for neodymium-iron-boron magnets, so we’re going to spend a little bit of time discussing those before we narrow in on the chosen composition.
Nd-Fe-B magnets are permanent magnets with the composition of Nd2Fe14B, considered to be an intermetallic, and a tetragonal crystal structure. (Permanent magnets are those materials which are magnetized and create their own magnetic field, such as refrigerator magnets.) These neodymium magnets are the most widely used rare earth magnets and have numerous applications, including in computers, speakers, door locks, electric generators, among countless others. These magnets are typically produced either through powder metallurgy and sintering, or through melt spinning.
The chosen composition results in another stoichiometric, intermetallic phase, NdB4. Its space group is P4/bmb, meaning it crystalizes with a tetragonal crystal structure as well. On their own, there is little interest in neodymium boron compounds in the literature.
Sources/Further Reading: ( 1 ) ( 2 - image 2 ) ( 3 - image 3 ) ( 4 - images 4 and 5 )
More phase diagrams: ( image 1 ) ( 500K ) ( 1000K ) ( 1500K ) ( 2000K )
30 notes
·
View notes
Text
OH SHIT I HAVE POLLS
#phaseposting#homestuck#karkalicious#fergie#fergalicious#honestly just making this for the fuck of it. i got polls bro i gotta do smth abt it#also did you know? if you want to edit a post w a poll you cant. you have to delete and remake it. so everyone keep an eye on them typos
541 notes
·
View notes
Text
really liked how much spiderverse leans into cringe. being a teen is akward and weird and you say dumb things and you cant talk about your feelings right and your relationship with your parents is fucked up. cringe is the battering ram it uses to open you up
0 notes
Photo


The Iron-Nickel-Chromium Ternary System
Despite the labeling of the phase diagram from Phase Poll #8, the Fe-Ni-Cr diagram isn’t strictly a diagram of stainless steel compositions. True, stainless steels are iron based alloys containing both nickel and chromium in varying amounts, but if we move to the nickel side of the phase diagram, for example, we start moving toward nickel-based superalloys, not steels, which by definition are predominantly iron. Which isn’t even taking into account the numerous other elements present in steels and the other alloys touched upon by this system, including manganese, molybdenum, titanium, aluminum, etc.
Alloys within this space include the following (all compositions are approximate averages of the many alloys within each category):
Austenitic stainless steels usually have around 18% Cr and 10% Ni, sometimes with some Mo or Ti. Ferritic stainless steels and martensitic stainless steels usually have around 16% Cr, but they don’t always even contain nickel. Duplex stainless steels have around 25% Cr and lower Ni at around 5%, in addition to some Mo. Precipitation hardening steels again have around 16% Cr, but can vary widely in their Ni content, from 5-25%. Moving away from steels, Ni-based superalloys such as Inconels can have 15-30% Cr and 5-10% Fe, with the balance as nickel. High chromium alloys, however, aren’t common. While chromium is added for it’s corrosion resistance, Cr is has a BCC crystal structure, which, while strong, isn’t as ductile as the FCC structure favored by Ni*.
That means the composition chosen by the poll, 42% Cr, 36% Fe, and 22% Ni, isn’t really going to be found in any commercial alloys. However, we can discuss the microstructure at that composition, which just barely stays in the Cr + γFeNi region of the phase diagram at that temperature. γFeNi, or the gamma phase, is a disordered solid solution FCC structure that forms the matrix of most Fe-Ni superalloys, though you typically need slightly more Ni than we have to stabilize the phase. The Cr phase here is also sometimes labeled as α’, and it is a Cr-rich BCC phase (where α would be the Fe-rich BCC phase).
Sources/Further reading: ( 1 ) ( 2 - image 2 ) ( 3 ) ( 4 )
Image sources: ( image 3 ) ( image 4 )
More phase diagrams: ( image 1 ) ( Cr-Fe-Ni, 500K ) ( Cr-Fe-Ni, 1000K ) ( Cr-Fe-Ni, 1073K ) ( Cr-Fe-Ni, 1473K ) ( Cr-Fe-Ni, 1500K ) ( Cr-Fe-Ni, 2000K ) ( Cr-Fe-Ni, liquidus projection ) ( Cr-Fe ) ( Cr-Ni ) ( Fe-Ni )
* A note on the BCC vs FCC structure comparison. Astute readers will note that Fe also has a BCC structure at room temperature, lending strength but not ductility. However, at high temperatures, Fe transitions to the FCC structure, and this FCC structure can be maintained in the final product if the alloy is cooled fast enough. Take a look at the Fe-Ni phase diagram as compared to the Cr-Fe phase diagram linked above. Ni, as an FCC metal itself, helps stabilize Fe in the FCC structure at high temperatures. Cr, on the other hand, does not. So a high Cr alloy would lend itself to a BCC structure, with low ductility, which is why they are not prevalent.
Additional reading.
#Materials Science#Science#Phase diagrams#Phases#Iron#Nickel#Chromium#Stainless Steel#Superalloys#Alloys#MyMSEPost#PhasePosts
23 notes
·
View notes
Photo


The Magnesium-Zinc Binary System
Phase Poll #5 has concluded - and nobody pointed out the glaring error I made! The phase diagram is for the magnesium (Mg)-zinc system, even though I typed out manganese (Mn) for some reason. So, I’m just going to pretend that you all would have voted as much for magnesium as you did for manganese! The final result was the composition above (41 mol% Zinc; 59 mol% Mg), with no specific votes for temperature.
The numerous intermetallics formed in this binary system are not well studied, but we’ll discuss what is known! Along that compositional line, we encounter the following phases as we decrease in temperature: liquid, C14 Laves (MgZn2), Mg2Zn3, Mg12Zn13, Mg51Zn20 and an HCP solid solution of the two elements. Of the above listed intermetallics, the crystal structures of MgZn2 and Mg51Zn20 are known (space groups numbers 164 and 71, respectively). Data about other phases, such as entropy and enthalpy of formation has been calculated, however I couldn’t find any structural information.
If we approach the alloy space from the perspective of magnesium with zinc added, magnesium is a common material used for its light weight and its biodegradability in the form of metallic implants. (Magnesium can be dissolved after implantation, eliminating a need for a second surgery to remove an implant.) As zinc is also biocompatible, the combination of these two elements in medical technology is an area of interest. The addition of zinc to magnesium, generally speaking, increases strength but induces brittleness. Alloys near the middle of the phase diagram also form significant intermetallics, adding to this effect.
Sources/Further Reading: ( 1 ) ( 2 - image 2 ) ( 3 ) ( 4 )
More phase diagrams: ( image 1 ) ( in atomic/weight percent )
20 notes
·
View notes
Photo
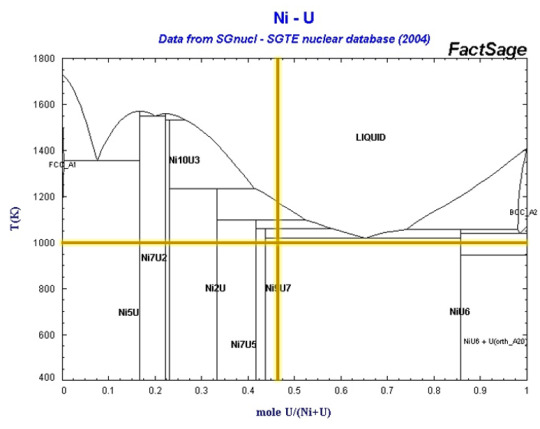
Intermediate Compounds and the Nickel-Uranium Binary System
Phase Poll #11 concluded yesterday with a fairly even split between nickel (53%) and uranium (47%). We also got one vote for a temperature of 1000K, thanks to @grimmtaupe. The Ni-U diagram is really only considered in the space of nuclear alloys, and isn’t very popular even then, so we’re going to spend some time on this post talking about intermediate compounds.
I’ve already briefly discussed congruently melting compounds vs. incongruently melting compounds, after the conclusion of phase poll #7. These definitions focus on phase transitions, while defining intermediate compounds starts to delve into the realm of solid solubility. Uranium and nickel have very low solid solubility below ~600°C (or ~873K). This can be seen from the numerous vertical lines on the phase diagram, each of which represents a specific intermediate compound, defined as simply phases with compositions that fall between two neighboring phases. Intermediate compounds almost always have a different crystal structure than the neighboring phases as well.
Solid solutions, on the other hand, can be continuous (like in the Ni-Cu phase diagram), primary/terminal (the fcc Ni phase and the bcc U phase at either side of the Ni-U phase diagram), or intermediate (like the hcp phase in the Ag-Al phase diagram). The primarily vertical lines on a phase diagram can thus give a visual indication of the solid-solubility of two elements across their compositional space.
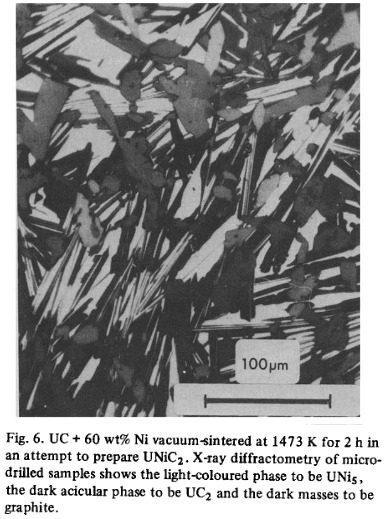
Back to the chosen composition, our alloy would be primarily Ni9U7. Not much is known about this compound, but the thing about phase diagrams is that they’re difficult to create, even if computational tools have accelerated the process in modern times. Some research (ref. 3 below) into nickel-uranium alloys suggests that the phase is actually U10Ni13, and crystalizes in a monoclinic crystal structure. If we consider the temperature as well, we can see from our previous definitions that Ni9U7 is an incongruently melting compound. For the nickel uranium system in general, small additions of nickel have been shown to promote sintering of uranium carbides.
Sources/Further reading: ( Ni-U: 1/image 2 ) ( Ni-U: 2 ) ( Ni-U: 3 ) ( Phase diagrams: 1 ) ( Phase diagrams: 2 ) ( Phase diagrams: 3 )
More phase diagrams: ( image 1 ) ( weight and atomic percent nickel, 1 ) ( weight and atomic percent nickel, 2 ) ( weight and atomic percent uranium )
#Materials Science#Science#Nickel#Uranium#Phase diagrams#Phases#Compounds#MyMSEPost#PhasePosts#Solubility
13 notes
·
View notes
Photo

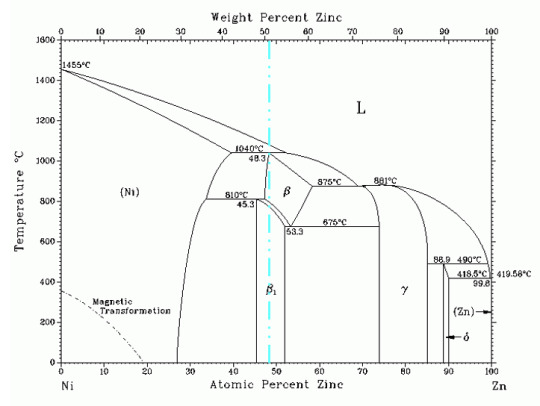

The Nickel-Zinc Binary System
Phase Poll #13 concluded yesterday with a pretty even split between the two elements. Nickel got slightly more votes with 51.5%, and zinc slightly less with 48.5%. Before we move into the properties and applications of nickel-zinc alloys, let’s talk a little about what we’ve already learned about phase diagrams.
From the left and right sides, we can see that zinc is fairly soluble in nickel, but that nickel is not soluble in zinc. We can also tell, without knowing anything about the periodic table, that zinc and nickel are close to each other, given that the atomic and weight percents are fairly similar. Despite their proximity on the periodic table though, we can see from the phase diagram they have vastly different melting temperatures, with zinc melting at over 1000°C less than nickel.
The primary application of this binary system is in corrosion-resistant coatings. While pure zinc coatings were once more common, small amounts of nickel help to increase the corrosion resistance. These coatings usually contain around 85% zinc or 15% nickel, resulting in the γ phase shown in the above diagram. Not only does this phase provide better corrosion resistance, but it is more ductile as well, allowing for easier coating. However, nickel remains much more expensive than zinc, limiting applications of such coatings.
The middle of the phase diagram is less well studied, and alloys with equal parts nickel and zinc are uncommon. It is known that the β1 phase crystalizes with a CuAu type structure.
Sources/Further reading: ( 1 - image 1 ) ( 2 - image 2 ) ( 3 - images 3 and 4 ) ( 4 ) ( 5 )
More phase diagrams: ( mole fraction ) ( mole fraction and mass fraction )
19 notes
·
View notes
Photo


The Titanium-Chromium Binary System
Phase Poll #9 concluded yesterday with a fairly even split between titanium (55%) and chromium (45%) and a single vote for temperature at 1400°C (thanks @bow-ties-and-daydreams!). Practical applications of this binary system mainly occur on the left side of our phase diagram, as the properties of Ti are typically considered improved with small additions of Cr (increased strength and hardness, as well as corrosion resistance). Both elements have a bcc structure at higher temperatures, and although Ti has a different low temperature phase, in the form of hcp, Cr retains its bcc structure (stronger, but more brittle than fcc) and thus is rarely used as the main component of structural alloys.
Directly below our chosen temperature of 1400°C, the Ti-Cr system forms a continuous solid solution, though this is only maintained between 1350°C-1400°C for values of ~50-70wt.% Cr. At our composition, this solid solution would be a pretty even mixture of both elements.
At slightly lower temperatures, solid-solution decomposition leads to precipitation of the TiCr2 intermetallic phase that can be maintained down to room temperature (not shown in the above diagram), forming a two-phase material with beta titanium as the second phase. The structure of this intermetallic is a C15 Laves phase, with Ti as the minority component, as is typically for alloys of Ti with other transition metals. The microstructures resulting on cooling often contain twinning, notably within the Laves phase.
Titanium has long since been considered a prime material choice, but the aluminum and vanadium alloys used in the past have come under scrutiny more recently, with concerns of long-term health effects from the alloying elements. As such, Ti-Cr alloys are under consideration for biomedical applications, including in the dentistry field, as the search for the best biocompatible alloys continues.
Sources/Further Reading: ( 1 - image 1 ) ( 2 - image 2 ) ( 3 - image 3 ) ( 4 - image 4 )
More phase diagrams: ( mole percent ) ( atomic and weight percent )
17 notes
·
View notes
Photo


The Aluminum-Magnesium-Silicon Ternary System
The winner of Phase Poll #4 was magnesium by a clear margin (41%), while the other two elements were decently split (25% Al, 33% Si). As a result, that puts us squarely in the Mg2Si phase on the phase diagram above. Before we spend time discussing this phase diagram, though, I want to talk about ternary phase diagrams in general, and how binary phase diagrams can be seen in liquidus projections.
To start with, the Al-Si binary system is a eutectic system, with the eutectic point at a little over 10% (mol%, here) Si. This can be seen pretty clearly in ternary phase diagrams by looking at the Al-Si side of the plot. Above, we can see the line that branches from just over 10% Si - and we can see it again if we look at other ternary systems, like the Al-Cu-Si system and the Al-Si-Zn system. An example projection of a binary system with two eutectics, projected onto a ternary system, is shown below:

In this way, we can still gain some understanding about what a binary system would look like, even if we only have the liquidus projection of a ternary system containing that binary.
But, onto Al-Mg-Si in particular. The Al-Si alloy classification is a broad one, leading to alloys with low density, high corrosion resistance, and good castability, but these alloys are not easily heat-treatable, which is where the Mg comes in. With the addition of Mg, alloys in this ternary system are thus well used, offering strength in addition to being light weight. They are often used in the automotive and aerospace industries, with the addition of other elements (Fe, Cu, etc.) as desired, and are typically produced through casting. One common alloy used for additive manufacturing is known as Al-Si10-Mg.
The voted for phase, Mg2Si (ignoring the Al content), is an inorganic compound that functions as a narrow bandgap semiconductor and has applications in thermoelectrics. In Al-Mg-Si alloys, the phase acts as a precipitation hardening mechanism, brittle but strong. In addition, it is sometimes used as feedstock material for the creation of aluminum alloys.
Sources/Further Reading: ( 1 - image 1 ) ( 2 - image 2 ) ( 3 - image 3 ) ( 4 - image 4 ) ( ternary phase diagrams ) ( Mg2Si )
More phase diagrams: ( ternary diagram ) ( 500K ternary ) ( 700K ternary ) ( 1000K ternary ) ( 1500K ternary ) ( computed vertical sections, Al-Mg-Si )
#Materials Science#Science#Phase diagrams#Phases#Aluminum#Magnesium#Silicon#Magnesium silicide#Thermoelectric#MyMSEPost#PhasePosts
12 notes
·
View notes
Photo

The Silver-Calcium Binary System
Phase Poll #7 concluded last week - apologies for being a little late with this post! You guys were almost equally split this time between silver (at 51% of the votes) and calcium (at 49%), which puts us squarely in the middle of the phase diagram, pretty near to the equiatomic intermetallic AgCa.
Unfortunately, when it comes to the Ag-Ca system, there’s not much to say. Not to worry though, I wanted to use this opportunity to talk a little more about the components of phase diagrams! Invariant points have already been covered by this blog, but I’m going to touch on them again to give the definition as points on phase diagrams with no degrees of freedom - they only occur at specific compositions, temperatures, and pressures, etc. In the above diagram, there are several eutectic points, and a couple peritectic points.
Congruent melting, meanwhile, is a phase transition wherein the composition of the liquid is the same as the composition of the solid. In incongruent melting, contrarily, a phase melts to a composition of liquid different than that of the solid. The former case is common in binary systems, with intermediary phases and two-phase regions wherein solids precipitate from the liquid before full melting occurs.
Returning to the silver-calcium system specifically, there aren’t many applications that make use of binary mixtures of the two elements. Silver-calcium batteries, despite the name, are still primarily lead-acid batteries with small amounts of calcium and silver added (as in, even less than 1%). Historically, silver-calcium alloys have been prepared as an intermediary step in the creation of silver catalysts. Another interesting feature of note in this phase diagram is the high temperature calcium phase. While calcium is fcc at room temperature, it has a phase transition above 450°C.
Sources/Further reading: ( 1 ) ( 2 ) ( 3 ) ( 4 ) ( congruent melting ) ( understanding phase diagrams ) ( phase diagram definitions )
More phase diagrams: ( image 1 ) ( mole fraction and mass fraction )
#Materials Science#Science#Phase diagrams#Phases#Silver#Calcium#Phase transitions#Invariant points#PhasePosts#MyMSEPost
9 notes
·
View notes
Photo


The Bismuth-Indium-Tin Ternary System
Phase poll #2 concluded yesterday, with bismuth being the fan favorite! The final composition of the poll was ~46% Bi, 30% In, and 24% Sn, which will be discussed at the end of the post. Our phase diagram this time was a ternary phase diagram, with the composition in weight percent of each element. A few more examples of the ternary system diagram can be found in the sources and the more phase diagram links below.
As this is the first ternary phase diagram I’ve posted, first, a little background information. As each of the three axes are composition only, ternary phase diagrams have two main modes of being displayed: isothermal plots, where the temperature (and pressure) are constant, or liquidus surface projections, which often, but not always, include isothermal lines. The heaviest element is often, though not always, placed at the bottom left, with the lightest element placed at the top peak.
The primary applications of this alloy system take advantage of the low melting points achievable. There are two eutectic points - compositions in which the melting temperature is lower then the melting temperature of the individual components - on the phase diagram, one with a melting temperature of ~59°C and the other with a melting temperature of ~76°C. Field’s metal, also known as Field’s alloy, has a composition close to the lower-melting point eutectic. It, and similar alloys, have been investigated as lead-free solders, as well as applications including phase change materials, rapid prototyping, and uses as a liquid metal.
The (Bi), (In), and (Sn) phases above have the crystal structures of their primary components: rhombedral for bismuth, and body-centered tetragonal for indium and β-tin. The phases on the left edge of the phase diagram are primarily bismuth-indium intermetallics. The two named phases are β and γ. The poll-selected γ phase has the chemical formula of In1-xSnx, and can be a component of the lower melting point eutectic.
Sources/Further Reading: ( 1 - images 1 and 4 ) ( 2 ) ( 3 ) ( 4 ) ( ternary systems )
Image sources: ( image 2 ) ( image 3 )
More phase diagrams: ( isothermal diagram at 500K/1bar ) ( isothermal diagram at 300K/1bar ) ( liquidus projection in mole fraction )
Bonus! Here’s a helpful link for ternary plots in general. It’s not a phase diagram, but you can use it to get an idea of how to read the plots and find specific compositions.
16 notes
·
View notes
Photo


The MgO-Al2O3-SiO2 Ternary System
Phase post #12 finished up two weeks ago, but I’m only just getting to the post now. This time we had a ternary diagram of mineral compositions, with alumina, or corundum, as the clear favorite with ~48% of the vote. The magnesium composition got ~27%, and the silicon composition ~24%. Though iron and calcium oxides are more prevalent than magnesium, the three compositions chosen make up over 80% of the earth’s crust, with SiO2 being the most common composition by far.
Silicon dioxide, or silica, is most common in the form of quartz, but the phase diagram above is the liquidus phase diagram, showing the high temperature phases of each composition. At these high temperatures, silica’s crystal structure changes, forming the phases cristobalite and tridymite. Aluminum (III) oxide, or alumina, on the other hand, doesn’t exhibit the same kind of polymorphism, though it does have several metastable phases. Thus, corundum, the most common form of the mineral, maintains its structure at high temperatures. Magnesium oxide, or magnesia, likewise maintains its room temperature structure in the form of its most common mineral, periclase.
The voted for composition lands us in the spinel region on the phase diagram. Spinel is both the name of a specific mineral (MgAl2O4) and a class of minerals. All spinels, including the magnesium/aluminum mineral, have a cubic crystal structure, as pictured above. Spinel, the mineral, is relatively hard and can be found in a variety of colors, depending on impurities. Synthetic spinel can look like glass and is used in applications for its compressive strength as well as a refractory ceramic. It is typically produced through sintering.
Sources/Further reading: ( 1 ) ( 2 - images 2 and 3 ) ( 3 - image 4 ) ( 4 )
More phase diagrams: ( image 1 ) ( colored diagram ) ( solidus assemblages ) ( mole fraction liquidus ) ( 1800°C ) ( 1300°C ) ( 1600°C )
#Materials Science#Science#Minerals#Phases#Crystal structure#Spinel#Alumina#Silica#Magnesium oxide#PhasePosts#MyMSEPost
7 notes
·
View notes
Photo


The Silver-Aluminum Binary System
Phase poll #1 was on the silver-aluminum alloy system, and ended with 45% aluminum/55% silver. Since the phase diagram posted was in mole fraction, that’s the compositional measurement we’re going with. In addition, there were several temperatures suggested in the notes, with the average being just under 700K, so stay tuned until the end for a few comments about the resulting structure at that composition and temperature.
Silver and aluminum are not often alloyed, primarily due to silver’s cost, but there have been niche applications for the alloy system, both historically and in modern times. Both elements, in their pure forms, have fcc crystal structures, noted by the fcc phases on either side of the phase diagram, and are fairly similar in atomic radius, allowing for the formation of substitutional solid solutions with a single crystal structure at certain compositions. The addition of silver into aluminum increases the hardness of the resulting material and, historically, when aluminum was also considered an expensive element, some silver parts, such as utensils, were alloyed with aluminum for this reason.
Since this is the first phase diagram post, we’re going to step away from the Ag-Al system for a brief moment and discuss the phase diagram in general. Binary phase diagrams, such as the one above, are typically temperature-composition diagrams, with the resulting equilibrium states being considered only for a single pressure. Phase diagrams can be arranged in a number of ways, with no set rules on the ordering of elements or the compositional metric chosen. For example, this source examines both mass fraction and mole fraction Al as the x-axis, showing the way the visual appearance of the diagram changes. In addition, this source has the phase diagram in atomic percent silver; instead of having aluminum content increase along the x-axis it decreases, flipping the appearance of the diagram from those above.
The silver-aluminum system is a fairly complicated system, with multiple invariant points, including, it was mentioned, a eutectic composition at around 840K and just over 60% Al. The chosen composition is a mixture of the stable hcp γ phase (with both elements in solid solution) and the fcc-Al phase (with Ag in solid solution). [To determine the exact fraction of each phase, the lever rule would need to be applied.] The hcp phase is harder and with better tribological properties than pure silver, so alloys near this composition have been investigated as replacements for the pure-silver electrical contacts used today, which rely on silver’s conductivity but suffer from silver’s relatively weak mechanical properties (see source 2). In addition to solid solutions, intermetallics of the composition Ag2Al and Ag3Al can also be formed at this composition under the right conditions.
Sources/Further Reading: ( 1 - image 1 ) ( 2 - image 2 ) ( 3 - image 3 ) ( 4 )
More phase diagrams: ( mass vs mole fraction ) ( flipped diagram ) ( additional source ) [sources 2 and 3 above contain phase diagrams as well]
18 notes
·
View notes
Photo


The Chromium-Zirconium Binary System (and Laves Phases)
Phase poll #3 concluded yesterday, examining the binary Cr-Zr phase diagram. The final vote was decently evenly split, with 57% voting for chromium and 43% for zirconium. With the four temperatures mentioned in replies or tags averaged, that puts us in the marked spot above on the phase diagram, in a composition that is partially the C15 Laves phase and partially liquid. Instead of focusing on the Cr-Zr system, which doesn’t see a lot of use on its own, this post is going to be a little different and discuss Laves phases in general, before focusing on that specific composition.
Laves phases are the specific crystal structures formed by certain intermetallic compounds of the type AB2. They were named for Fritz Laves, German mineralogist who published his findings about these structures in the 1930s, and there are general Laves forms: the cubic MgCu2 and the hexagonal MgZn2 and MgNi2 structure types. (Grouping these phases under the name Laves phases was suggested at the end of the 1930s, by another German scientist Gustav E.R. Schulze. Geometry and crystal structure are the only similarities between different Laves phases; there were over 1400 known phases (mostly of the first two varieties), in the late 1990s and many more have been discovered since.
All Laves phases are tetrahedrally close-packed structures and are considered homeotect structures. As intermetallics, Laves phases are typical brittle but strong, and can be considered beneficial or detrimental depending on the application. They can serve as precipitation strengtheners in alloys, and can have high melting temperatures and maintain their strength at high temperatures. The designations C14, C15, and C36, the most common and simple Laves structures, come from early crystallography, in which crystal structures were grouped according to type and then numbered in roughly historical order of discovery or analysis.
C15 in the Cr-Zr system is known as α-CrZr2 and is polymorphic with the C14 and C36 structures that exist at higher temperatures. Applications of pure binary Cr-Zr alloys or intermetallics are rare, but one example is in chromium clad zirconium rods, in which the Cr serves as protection against corrosion, and diffuses into the Zr alloy substrate. More commonly, the two elements are also alloyed with copper to form ternary systems.
Sources/Further Reading: ( Cr-Zr thermodynamics ) ( Cr clad Zr - image 4 ) ( Laves phases - image 3 ) ( Laves phases ) ( Crystal structure types )
Image sources: ( image 1 ) ( image 2 )
More phase diagrams: ( mole fraction and mass fraction ) ( weight percent and atomic percent )
#Materials Science#Science#Phases#Phase diagrams#Laves phases#Chromium#Zirconium#Intermetallics#PhasePosts
9 notes
·
View notes
Photo


The Gold-Silver-Copper Ternary System
Phase Poll #6 concluded over a week ago, but I’ve been busy so you’re getting the write up post now! As stated in that post, I’ve already written up a post on colored gold alloys, so I won’t focus too much on the phase diagram in general, instead talking about the composition chosen - and you guys sure didn’t make it easy on me! The final result had copper as the clear favorite, coming in at 61%, with silver at 27% and gold at 12%, which puts us outside the realm of commercially manufactured jewelry.
Gold jewelry is often categorized by the karat system, in which the percentage of gold in a piece determines it's number (whereas the number of karats is the fraction of gold out of 24 parts). The highest purity gold is 24 karats (24/24), and the lowest the scale goes is 8 karats (8/24 or 33.3% gold), which is still far above our composition. (Some places only go as low as 9K or 10K, so 8K jewelry may be difficult to find in your region of the world.) So, there isn't any gold jewelry that contains so much copper and silver - it's not really gold anymore at that point. On the silver side, the case is much the same; sterling silver is an alloy of 92.5% silver and often 7.5% copper, but rare is the occasion where more than 50% copper is mixed with silver.
Looking at phases instead of resulting colors, the composition chosen falls into the immiscibility field of the ternary diagram (image 2 or source 1). High gold alloys form a solid solution of all three elements, but copper and silver are immiscible. Depending on the processing, therefore, these elements can be maintained as solid solutions if cooled quickly, or will result in a two-phase alloy at equilibrium, one phase of which is copper rich while the other is silver rich.
Mixing copper with gold can increase the hardness, and the same happens when mixing copper and silver together. However, copper and silver are both more reactive than gold, which is why this corner of the phase diagram isn't much used for jewelry - it corrodes too easily, compared to the alloys that contain more gold. This is also why adding gold or silver to copper (instead of copper to gold or silver) isn't nearly as common, given the cost of gold and silver offsets any advantageous property difference.
Still, stepping away from gold alloys and silver alloys, there are a few historic copper alloys that come close to our composition, so let's take a look at those and their uses. First, a few Japanese alloys, Shibuichi and Shakudō. Shibuichi is an alloy of copper and silver, literally meaning 'one-fourth', and is thus one part silver to three parts copper. Shakudō is an alloy of copper and gold, typically ranging from 90-96% copper. Both were used for decorative purposes, taking advantage of the color of the patina that could be formed on such alloys.
In another part of the world, pre-Columbian cultures in South and Central America often created religious objects of an alloy of gold and copper that the Spanish Conquistadors named tumbaga. Artifacts from this era vary widely in composition, with some having as much as 97% gold and others up to 97% copper. Because of the natural compositions of gold and copper ores, silver is often present as well. The third image above is a tumbaga artifact of mostly copper, and around 20% gold and 2% silver. Again, because of corrosion of copper (and silver), these artifacts are difficult to find in good condition - however, counter to that, metallurgists of the era used a technique called now called depletion gilding to create a layer of pure gold on the surfaces of these objects, protecting them from corrosion, at least for a time.
In modern times, alloys in this range are still not widely used. Copper and gold alloys have been investigated for nanotechnology systems, but, to my knowledge, this corner of the ternary system is often avoided.
Sources/Further reading: ( 1 ) ( 2 - image 2 ) ( 3 - image 3 ) ( 4 - image 4 ) ( 5 ) ( 6 ) ( 7 ) ( 8 )
More phase diagrams: ( image 1 ) ( wt% with T lines ) ( mole fraction, liquidus projection ) ( mole fraction, 800°C ) ( Ag - Au ) ( Ag - Cu ) ( Au - Cu )
#Materials Science#Science#Phase diagrams#Phases#Copper#Silver#Gold#Alloys#Jewelry#Science history#PhasePosts#MyMSEPost
12 notes
·
View notes
Text
you know sometimes im a little disappointed that there's only so many "this would happen on seinfeld" posts out there and i can't make my own since i havent watched the show but. i just realized. i can watch the show. just imagine how many seinfeld-like situations there are in seinfeld. untapped potential
134 notes
·
View notes
Last Seen Blogs