#Juniper publisher journals
Text
A Spin Coating of Thymol Blue Indicator on F-SnO2 Glass to fabricate a Novel Sensor Electrode in Potentiometric Acid-Base Titration
Authored by: Nasser M Abu Ghalwa
Abstract
This study deals with the investigation for preparation of conductive glass / thymol blue TB sensor electrode by spin coating of the thymol blue (TB) indicator on conductive glass formed from F-SnO2, and it’s using as indicator electrode in potentiometric acid-base titration in aqueous solution at 298K. The change of the open circuit potential with pH (E-pH) curve is linear with slope of 0.052V/dec at 298K. The standard potential of the above electrode E0, was determined with respect to the SCE as reference electrode. The recovery percentage for potentiometric acid-base titration using G/TB as indicator electrode was calculated.
Keywords: Potentiometry; Thymol blue; Sensor; Conducting glass; Titration; Indicator electrode
Introduction
Chemical sensors are devices that convert the concentration of target compounds into an analytical signal. The term analytical implies the concept of measurability. Then a chemical sensor converts the information about the presence of target compounds into a measurable quantity [1]. Chemical sensors play a big role in checking the environment we live in, contributing information on industrial production processes, quality management of food stuffs and beverages, detection and analysis of some ions and many other applications [2]. Transparent conducting oxides possess a unique combination of optical transparency and metallic conductivity in a single material. Their properties are widely exploited in a host of energy, optical, and electrical applications [3-5]. SnO2 is a wide band-gap semiconductor with a band gap of 3.6eV and was the first transparent conducting oxides to receive significant commercialization. It exhibits good transparency and can be easily n-type doped. Degenerate carrier densities can be achieved by doping with fluorine [6,7]. Potentiometric titrations are the basic chemistry laboratory technique for the quantitative analysis of substances with unknown concentrations using standard solutions of known concentration. The substance with unknown concentration and the standard solution are termed analyte and titrant respectively [8]. This method widely used in different fields such as the food industry, scientific research, and chemical, clinical and pharmaceutical laboratories. Titrimetric procedures based on a detection of the endpoint, i.e., the point at which volumetric titration is completed, are successfully employed over a wide range of concentrations and are popular because of their simplicity, speed, accuracy and good reproducibility [9]. Recently, many studies developed some types of electrodes in potentiometric acid base titration [10-13]. Thymol blue (thymolsulphonephthalein) is used as a pH indicator. A solution of thymol blue exhibits three form (red color), Neutral form (yellow color) and basic form (blue color) show Figure 1 [14].hone radiation can lead to adverse effects [10-16]. Thus, the public concern is that increasing the frequency of the radiation will also increase the effects of the radiation [14-16].
The aim of this study for preparing a spin coating of thymol blue indicator TB on conducting glass formed from F-SnO2 to prepare a new modified electrode sensor (glass / indicator electrode), for used in potentiometric acid base titration.
Experimental
Chemicals
The chemicals used in potentiometric titrations and preparation the electrode was tetraethyl orthosilicate (TEOS), Thymol blue (TB), hydrochloric acid, ammonia, Acetic acid, phosphoric acid, sodium hydroxide, sulfuric acid, citric acid and disodium phosphate. The chemicals are of analytical pure grade (Merck) Where the F-SnO2 glass from (Sigma Aldrich).
Synthesis of Materials
Preparation of Hydrolyzed TEOS
A mixture of 2. ml of absolute ethanol, 0.86ml of 0.1M of HCl were added to 2.5ml of TEOS under stirring. The obtained solution was kept under stirring at room temperature until a homogeneous clear solution was obtained. The solution was aged at least for 24 hours before used in the coating process. The hydrolyzed TEOS solution was used as a host matrix for the indicators.
Preparation of Indicators
Indicators solution (1×10⁻²M) thymol blue indicator (TB) were prepared using absolute ethanol as solvent.
Stock solution of indicators
The sample solution was prepared by mixing 1ml of blank hydrolyzed TEOS solution and 1ml for each indicator.
Preparation of Silica-immobilized Thin Films
Substrate Cleaning
Glasses were activated by concentrated H2SO4 for 24 hours, then washed with distilled water and ethanol. The surface was finally rubbed with cleaning paper.
Preparation of glass/TB electrodes using Spin coating method
All thin films layers prepared in this work were made by spinning three drops of the solutions onto a clean glass slide. The coating process was performed using the spin coater machine at 900rpm spinning speed for 1 min. period time. To obtain multilayers of thin films a subsequent spin coating method was performed after gradually drying of the previous layer at room temperature for 24 hours, then dried at 80oC for another 48 hours. And repeat the spin coating two or three time. Where the conducting substrate is usually conducting glass, consisting of glass coated with a thin layer of F-doped SnO2.
Sensor design of potentiometric cell
The potential of the indicator electrode relative to that of the reference electrode was measured on a digital multimeter model YDM 302C (China). Potentials were measured to ±5mv. The potential of Thymol blue, sensor indicators electrodes was measured vs. a saturated calomel electrode (SCE). The error in the measurement of the potential due to liquid- junction potentials in these electrolytes is estimated to be about 0.001V.
The solution in a beaker is stirred by means of a magnetic stirrer. The electrodes (indicator and reference) were dipped slowly into aqueous solution (acid or reductant). After the steady state potential was attained, the titration of the acid was carried out by addition of 1ml of the base to the acidic solution, waiting until the steady potential is established and then measured. The potential variation depends on the type of the base, the progress of neutralization process and on the initial concentration of the acid to be titrated. The results were reproducible to satisfactory value of ±5 mV for potential measurements. The process of addition of the titrant was repeated until the equivalence point was reached.
The E-pH relation of Thymol blue electrode:
The E-pH relation of Thymol blue electrode
According to Figure 2 the change of the open circuit potential (E) of the G/ TB indicator electrode with pH . The E-pH plot of the G/TB indicator electrode fits straight line with slope of 53.11mV at 298K. This value is close to the magnitude of the term 2.303RT/F at the corresponding temperature (59.1mV at 298 K). This value is close to the magnitude of the term 2.303RT/F (where: R gas constant, T absolute temperature and F Faraday constant) at the corresponding temperature (59.1mV at 288K). From Figure 2 the E0 value of the sensor electrode, i.e., the potential at [H+] = 1, is computed as 279.1mV relative to the saturated calomel electrode and can determination by:
This equation is applicable for the reversible behavior of working electrode. From the developed Nernst equation, we indicate that working electrodes can be used as pH-indicator. At high or low pH, the electrode indicates pH less than true value as pH glass electrode, it may be due to damage in electrode or existence of alkali metal ions in solution too.
The response time of the sensor
In general, the response time was defined as the time of sensor’s output reach to 90% of the equilibration after the measurement was started, especially to electrochemical sensors [15-17]. Figures 3a-3e show the response time of the G/TB sensor at different concentration of phosphoric acid, acetic acid, Hydrochloric acid, ammonia and NaOH respectively. Response time, in the range of (100-450) seconds was achieved, which rendered the sensor highly practical.
Effect of temperature on the response characteristics:
The importance of temperature measurement when performing pH measurements has already been mentioned in reference to slope correction. Temperature also has an effect of both pH buffers and solutions, as the hydrogen ion activity will increase with increasing pH [18].
The Thymol blue sensor response was evaluated at different temperatures, Figure 4. At lower temperatures, like 288K, the slope of the sensor was about 33.54mV/decade and the sensor would be used for pH measurements in the range from (2-11). However, when the temperature of the test solutions was adjusted to 298K, the slope significantly increased to 53.11mV/decade. By raising the temperature to 313K and 323 K the slope increased to 54.11mV/ decade and 59.75mV/decade respectively. Figure 4 shows the square of the correlation coefficient (r2) for pH measurements using the solid-state sensor, at different temperatures, as compared to pH values obtained by a conventional pH electrode (Hanna Instruments HI 1131 pH combination electrode) was found to change as the temperature increases where as r2 values for measurements at 283K, 298K, 308K, and 318K were 0.9655, 0.9386, 0.9482, 0.9876, respectively. This indicates that better results could be obtained at 298K due to easy and settable to use without heating.
The relation between conventional glass PH electrode and G/ TB indicator electrode
All potential values were converted with respect to the standard hydrogen electrode (SHE). During experiments, pH was also monitored with a commercial glass electrode that was calibrated daily using commercial standard buffer solutions (2-9) [19]. Figure 5 represents the correlation between the conventional glass PH electrode and G/Thymol blue indicator electrode, it can be easily recognized that excellent correlation between the results obtained by the solid-state pH sensor and the conventional glass pH electrode could be achieved. The slope of this relation was 0.947 and the r2 was 0.947. This indicate that G/TB indicator electrode potential values are closed to the values of conventional glass pH electrode.
Potentiometric of weak acids against NaOH
Figures 6a & 6b represent the potentiometric titration of 0.1M NaOH with different concentrations of acetic acids and phosphoric acid. The variation of G/TB electrode potential at 298K with the different volumes of standard 0.1M NaOH followed typical potentiometric titration curves. These curves show slight decrease in potential (to more negative values) with the addition of the titrant. Where Figure 6c show the potentiometric titration between the volume of 0.1M standard HCl against ammonia. The variation of the TB electrode potential at 298K with the different volumes of standard HCl followed typical potentiometric titration curves. These curves show slight increase in potential (to more positive values) with the addition of the titrant.
Location of endpoints
Figure 7a represent ΔE/ΔV against V plot for the potentiometric titrations of CH3COOH and H3PO4 with 0.1 M standard NaOH. From the plots the values of end points were determined. The obtained results and calculated values of (R%) are listed in Tables 1 & 2 for acetic acid and phosphoric acid respectively. The values of pKa for different concentration of acetic acid and phosphoric acid were calculated using the method of half neutralization as shown in Table 3. There are two jumps in the titration of phosphoric acid with NaOH using G/TB sensor. i.e two end points appear by using this electrode. The obtained values of pKa for the investigated bases are close to the previously reported values. Where Figure 7b represent ΔE/ΔV against V for the potentiometric titrations of ammonia and 0.1M standard HCl respectively. From the plots the values of end points are determined.
Finally, the values of pKb for different concentration of ammonia can be determined using the method of half neutralization. They are listed in Table 3 for the tested bases. The obtained values of pKb for the investigated bases are close to the previously reported values.
Conclusion
This study investigated the preparation of the modified electrodes of type glass/ thymol blue G/TB and their use as sensor indicator electrodes in the potentiometric acid-base titrations in aqueous solution at 298K. E-pH curve is linear with slope of 0.053.1V/decade for the G/BTB electrode at 298K. This value is close to the theoretical value 2.303RT/F (0.059V at 298K) and the recovery percentage for potentiometric acid-base titration using G/TB as indicator electrode was calculated.
i. On other hand the standard potential of the tested electrode, E0, is computed as 279mV with respect to SCE as reference electrode. Acetic acid, phosphoric acid, hydrochloric acid and ammonia were successfully potentiometric titration with NaOH as titrant in aqueous medium at 298K. Finally, this study is applied in different temperatures like 283K, 298K, 308K, and 318K were the correlation coefficient (r2) 0.9655, 0.9383, 0.9482, 0.9876, respectively.
To Know More About Juniper Online Journal Material Science Please click on:
https://juniperpublishers.com/jojms/index.php
For more Open Access Journals in Juniper Publishers please click on:
https://juniperpublishers.com/index.php
#Juniper Publishers#Material Science#Materials Theory#Structural Materials#Juniper publisher reviews#Juniper publisher journals
0 notes
Text
Manufacturing and Evaluation of High-Quality Composites using Out-of-Autoclave Prepregs
Abstract
Carbon fiber-reinforced thermoset polymers have become popular in a wide variety of applications such as primary aerospace structures, sporting goods and wind energy systems. Autoclave processing has been the preferred method for fabricating high performance composites. However, the need for low-cost, high-performance composites prompted researchers and industries to develop new techniques such as vacuum aided resin transfer molding (VARTM) and vacuum-bag-only cure out-of-autoclave (OOA). Manufacturing parts with less than 1% void content, on the other hand, remains a difficulty. In the present study, the OOA technique was used to create high-quality (less than 0.25 percent void content) carbon/epoxy composites. The phases in the processing that result in good quality are described. Physical, mechanical, and fatigue properties of the manufactured composites were evaluated.
Keywords: Fiber-reinforced; Polymers; Carbon; Composites; Vacuum
Introduction
In spite of numerous application possibilities, the usage of composites has been limited because of high costs. While the material costs sum to 8-10% of the total costs, manufacturing and processing costs contribute to the majority of the overall costs of the composites [1]. Cost savings of up to 75% have been achieved by using low-cost composite manufacturing techniques and by making integral parts [2]. A reduction in man-hours by 70-85% was also reported when implementing automated composite tape layers [3]. Hence, several studies have been devoted over the past few decades in developing non-autoclave manufacturing techniques that can significantly reduce the manufacturing costs of composites [4-10]. Bond et al. [11] presented a comparative summary of the physical, mechanical, and thermal performance of composites manufactured using different non-autoclave processes developed in the past few decades. In addition to huge capital and tool cost-savings, non-autoclave composite manufacturing processes offer several advantages such as scalability to large parts, and flexibility to manufacture hybrid, complex-shaped parts [5]. The out-of-autoclave (OOA) process is a vacuum-bag-only cure process that uses engineered prepregs that can be cured in regular ovens instead of an autoclave. Centea et al. [12] conducted a literature review on the processing of vacuum- bag-only prepreg and their effect on composite quality. They also presented the development and defining properties of vacuum bag only prepreg. The cost and environmental performance are also discussed in their study. The OOA process not only results in less energy consumption but the lower capital and tooling costs, fewer coefficient of thermal expansion issues, and the scalability to larger and integral parts made it a competitive alternative to the autoclave process. Developing low-cost advanced composites will allow to fully utilize the advantages of composites and to advance the usage of composites in several applications. And the improved performance of the composites is directly related to the fiber, resin, and especially void content. While void content less than 2% is typically desirable in aerospace composites, OOA has to produce composites with less than 1% to truly deliver advanced composite products that are comparable to autoclave composites.
Park et al. [13] utilized vacuum-bag-only to manufacture carbon/epoxy composites and investigated curing techniques for producing high-performance composites with low void content. They stated that improving the resin flow may allow for producing parts with minimal void content (1.3%). The composite laminates generated by their recommended technique showed a slight decrease in compressive strength compared to autoclave curing.
The compressive strength decreased by 6.5% for [0/90]₄ stacking sequence and 7.6% for [0/452/90]s stacking sequence. The inplane shear strength increased by 3% compared to laminates obtained by autoclave curing. In the present study, high-quality composites with a void content of less than 0.25% have been consistently manufactured employing the OOA manufacturing process. The manufacturing process utilized in accomplishing the high-quality composites is presented. Physical, mechanical, and fatigue tests have been conducted to evaluate the performance of the manufactured composites. Low-velocity impact tests were performed on the manufactured composite panels. Residual compressive strength of the impacted panels was evaluated. The effect of impact on the fatigue life of the composites was studied.
Materials
MTM45-1/CF2412 carbon prepregs obtained from Cytec Engineered Materials Inc., NJ, USA have been used for the present study. These prepregs contain 6K 5HS AS4C carbon fabric impregnated with MTM 45-1, a variable cure temperature, highperformance toughened epoxy resin.
Manufacturing
Flat composite panels have been manufactured using the OOA manufacturing process. The schematic of the bagging procedure employed for the OOA process is shown in Figure 1. The manufacturing procedure includes laying up the prepregs that were cut to the required dimensions and orientations onto an aluminum mold free from surface defects and already coated with Frekote release agent. Hand pressure and rollers were used to press the prepregs over the mold starting from one side of the prepreg and moving progressively towards the rest of the surface. This process is repeated for all the prepregs to remove entrapped air bubbles as well as folds or wrinkles. Thin glass strings, FEP release film, breather, and vacuum outlets were placed and sealed with a vacuum bag. A vacuum line was connected to the vacuum pump and checked for any leaks. A two-stage vacuum pump with a capacity of 5 L s-1and an ultimate vacuum of 0.013 Pa has been used to manufacture these panels. The set-up was maintained under vacuum for 12 hours. The lay-up is heated to 180oF and held for 4.5 hours. The temperature is then increased to 250oF and held for 4.5 hrs. The part is then cooled down to room temperature, demolded, and post-cured at 350oF for 2 hrs.
Characterization
Fiber volume fraction testing using sulphuric acid digestion method
Fiber volume fraction tests were conducted on the manufactured OOA composite panels using sulphuric acid digestion method. Four specimens each weighing from 0.50 to 2 gm. were cut from the panel. The edges of the specimens were polished thoroughly to facilitate accurate density measurements. The samples were dried in an oven for 1 hour at 120°C to remove any surface moisture, weighed, and tested for density. Table 1 shows the density, fiber volume fraction, and void content of the composite samples. The samples had an average fiber volume fraction of 53.99 %, and void content of 0.21 %. According to published studies, the amount of voids in a material has a direct impact on its mechanical properties [13-15]. For interlaminar shear strength, flexural strength, and flexural modulus, Ghiorse et al. reported reductions of 9.7%, 10.3%, and 5.3 percent per percent void, respectively [14]. Sergio et al. discovered that increasing void content had a significant negative impact on the fatigue life of composite constructions [15]. As a result, lowering the void percentage from 1% to around 0.25 percent should improve mechanical qualities.
Tensile Tests
Static tensile tests were performed on the OOA composites to evaluate the ultimate tensile strength required for fatigue testing. Samples of 2.286 mm (0.09 in.) thickness (6 layers) with 25.4 mm (1 in.) and 12.7 mm (0.5 in.) width either slipped or failed in the grips. Hence the thickness of the samples was decreased to 0.064 in (4 layers). While samples with 25.4 mm (1 in.) width failed in the grips without slipping, 12.7 mm (0.5 in.) wide samples failed in the middle. The test results obtained for 12.7 mm (0.5 in.) width and 1.626 mm (0.064 in.) thickness were reported below. Composites coupons were cut from the panels were manufactured using 4 layers of MTM45-1/CF2412 OOA prepregs. Tests were conducted on the coupons using Instron 4204 testing machine in accordance with ASTM D 3039. Samples were tested at a crosshead speed of 12.7 mm/min. (0.05 in./min). The ultimate tensile strength, modulus, and failure strain are tabulated in Table 2. The samples had an average tensile modulus, strength, and strain to failure of 824.79 MPa, 65.20 GPa, and 1.27% respectively. Hence the post-impact fatigue tension tests were performed at three stress levels – 50% Sult = 413.68 MPa, 65% Sult = 53.78 MPa and 75% Sult = 62.05 MPa (Sult -ultimate strength). When the samples fail at these levels during the fatigue tests, the stress level values were further dropped down.
Flexure Tests
Static flexure tests were performed on the OOA composites to evaluate the bending properties. Samples of 0.09 in thickness (6 layers) with 12.7 mm (0.5 in.) width manufactured from 6 layers of MTM45-1/CF2412 prepregs were used as test specimens. Tests were conducted on an Instron testing machine according to ASTM D790-03. A span to depth ratio of 40:1 was used to avoid failure by shear. Six specimens were tested at a crosshead speed of 6.096 mm/ min. (0.24 in./min.) The ultimate flexural strength, modulus, and strain to failure values are tabulated in Table 3.
Low-Velocity Impact Tests
Low-velocity impact tests have been performed on the composite panels manufactured using Out-of-Autoclave (OOA) process. A Dynatup Instron Model 9250 Impact Testing Machine with impulse control and a data system was used to carry out the low-velocity impact tests. Three different energy levels of 10J, 20J, and 25J were considered. The hemi-spherical impactor had a mass of 6.88 Kg and a diameter of 12.7 mm (0.5 in). The energytime history, load vs. displacement, and velocity-time history plots are shown in Figures 2 & 4 respectively. The impactor penetrated the samples at 30J of energy.
Compression-After-Impact (CAI) Tests
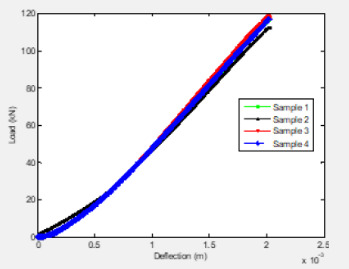
CAI tests have been conducted on MTM45-1/CF2412 composites manufactured using the OOA process. The tests were performed according to ASTM D7137. Four specimens of size 152.4 mm (6 in.) x 152.4 mm (6 in.) were first subjected to low-velocity impact tests and then machined to 152.4 mm (6 in.) x 101.6 mm (4 in.) for the CAI tests. Laminate construction consists of 12 fabric plies with a stacking sequence of [(+45/-45)/(0/90)]3S. Impact energy per unit thickness of 6672 J/m, an industry standard for evaluating thick, quasi-isotropic laminates was selected. Just clearly visible impact damage (VID) has been observed at 32J. The CAI test fixture is edge-loaded between the flat platens. Loads were applied at a cross-head speed of 1.27 mm/min. (0.05 in./ min). Compression load vs. deflection curves are shown in Figure 5. The ultimate compression-after-impact strength values of the specimens are tabulated in Table 4. The front view of the tested samples is shown in Figure 6.
Tension Fatigue Tests
Fatigue tests have been conducted on unimpacted OOA composites in an MTS 810 closed-loop servo-hydraulic testing system. Tests were performed on 12.7 mm (0.5 in.) wide x 254 mm (10 in.) long x 1.6256 mm (0.064 in.) thick MTM45-1/CF2412 samples. Fatigue behavior of the coupons at sinusoidal tension – tension loadings of 80%, 85%, 86%, 88%, and 90% of the ultimate strength (827.37 MPa) or ultimate tensile load of 15.57 kN (3500 lb) have been observed. A frequency of 2Hz and a load ratio of R = 0.1 (R = σmin/ σmax) have been used. Failure of samples in the grips was not observed with an increase in grip pressure to 5.75 MPa. The fatigue life of the coupons at different loadings is presented in Table 5. Figure 7 shows the S-N curve of an unimpacted sample under tension–tension (T-T) loading. Since the gap between the fatigue life at 88% and 90% stress levels is huge, more fatigue tests will be conducted at 89% of the ultimate load and other stress levels as needed. Figure 8 shows the failed specimens. Both fiber fracture and delaminations throughout the length of the specimen were observed. Post-impact compression fatigue tests are in progress.
Post-Impact Compression Fatigue Tests
CAI fatigue tests have being conducted on MTM45-1/CF2412 composites manufactured using the OOA process. The laminate construction consists of 8 fabric plies with a stacking sequence of [(+45/-45)/(0/90)]2S. Samples had a thickness of 3.35 mm (0.132 in). The 152.4 mm (6 in.) x 101.6 mm (4 in.) panels were subjected to the 15J of impact energy according to ASTM D7136. The CAI test fixture is edge-loaded between the flat platens as shown in Figure 9. Fatigue behavior of the coupons in sinusoidal compression–compression loadings of 60%, 65%, 70%, 75%, 80%, and 90% of the ultimate strength (224 MPa) or ultimate compressive load of 76.02 kN (17,090 lb) has been used. Initially, panels of 12 fabric plies have been constructed. The ultimate compressive failure load of the specimens was 115.65 kN (26,000 lb). Due to the load cell limits of the available test machines, panels with lower thickness have been chosen. A frequency of 2Hz and a load ratio of R = 10 (R = σmin/ σmax) have been used. The fatigue life of the composites at different load percentiles is given in Table 6. The fatigue curves are shown in Figures 10 & 11. The samples did not fail at 60% of loading even after 700,000 cycles and the tests were stopped.
Conclusion
A low-cost OOA vacuum-bag-only cure prepreg technology was successfully used to produce high-quality carbon fiber composites with void content less than 0.25 percent. The processing stages that lead to high-quality parts are shown. The fabricated panels were put through tensile, flexure, impact, compression-after-impact, and tensile fatigue tests. The effects of post-impact compression fatigue were studied. The results reveal that the OOA method is capable of producing parts with quality and performance comparable to those produced by the autoclave process at a fraction of the cost.
For more Open Access Journals in Juniper Publishers please click on: https://juniperpublishers.com/
For more articles in Academic Journal of Polymer Science please click on: https://juniperpublishers.com/ajop/index.php
#polymer#rubber#juniper publishers in USA#copolymer#juniper publisher journals#juniper open access journals
0 notes
Text
A Novel Methodology for Correction of Cosmetic Problems via Secondary Eyebrow Transplantation - Juniper Publishers

A Novel Methodology for Correction of Cosmetic Problems via Secondary Eyebrow Transplantation - Juniper Publishers
Authored by Yi Jung Lin
Abstract
Eyebrows create a very imperative and noticeable feature of the face. With increasing information, eyebrow transplant has become a prevalent technique. Though it is a small area still requires a lot of precision, knowledge and aesthetic skill regarding anatomy, designing of brows, extraction and implantation technique. In this paper, we performed many cases of eyebrow reconstuction including revision by our own implanter. The cases analyzed in this paper were corrected only by transplantation of occipical donor hair without laser hair removal nor tattoos. This article gives a comprehensive view regarding how to correct previously unsatisfactory eyebrow transplant with special emphasis on several points as hair follicle density, eyebrow shape, entire or partially reconstruction, which has become the most skillful technique.
Keywords: Eyebrow Transplantation; Implanter; Hair Follicle Density; Hypothyroidism
Introduction
Eyebrows are the most communicative feature and form a masterline of the face. It is the orientation fact concerning which all other perspectives and outlines of the face are established. Repairing eyebrows have become a reworthing procedure of hair transplant because of the increasing information and exceptional results. However, eyebrow transplant requires a high degree of skill and experience, not to mention the reconstruction transplant under the condition of previously unsatisfactory eyebrow transplant. With the extensive experience of the author in the field of follicular unit extraction (FUE) and follicular unit transplant (FUT)/strip, especially in aesthetic facial hair restoration, it is feasible to perform high-quality surgical techniques creating satisfactory results and a happy outcomes to patients after previously eyebrow transplant under comprehensive communication.
Procedure evaluation before the transplant
Cosmetic is the most common signs of eyebrow transplant such as inherited absence or insufficient coverage, of a normal appearing eyebrow requiring darker colour or an uneven eyebrow with lack of lateral third or medial portion. The other uncommon indications are trichotillomania, scar due to trauma, burn or tumours, stable alopecia areata, madarosis due to hypothyroidism, leprosy, etc. [1]. Although a correct candidate is one who has accurate expectations, understands limits in density achieved, has a pronounced defect than purely cosmetic purposes and stable or treated disease, the patient still expects a near-perfect surgical result. Even well awaring the difficulties of the reconstruction of eyebrow transplant, after seeing the patients undergoing previous surgery, showing an extremely depressed and anxious state, the authors had to try to deal with the cosmetic problem secondary to previous eyebrow transplant.
Methods
The outline of the eyebrows comes from the arrangement and display of each hair follicle. The qulity and survival rate of the follicles implanted decide the appearance of the eyebrow. FUT/ strip with long hair has long been used using single or small hair grafts for brow transplant [2,3]. Persuing grafts of high quality, Graft quality index (GQI) of grade 1, can present the shape of the eyebrow more accurately. We prefer FUT with long hair to control the qulity of grafts, especially a grade 1 of GQI [4], and only a high surviral rate of hair follicle could show a beautiful outline of eyebrows. We use DIMIS-T 100A of high solution of digital Microscope and Samsung LED monitor for follicle dividing. Despite preparing graft using a dissecting microscope gives the dividing a little slower, however, it is worth the effort and much more perfect.
Case Analysis
Entire reconstruction
The patient received eyebrow transplantation by body hair (leg hair) one year before visiting the clinic. Occasionally, the implanted body hair was too thin and too sparse to connect the original eyebrow hair to present an intact curve. This time, we used the occipital donor hair to make an entire reconstruction. And the result gets more complete than the body hair (Figures 1 & 2).
Partially modified
The patient received eyebrow tattoo before eyebrow transplantion resulting in eyebrow hair lost and fibrosis under eyebrow area noted afterwards. She requested eyebrow implantation and liked it to go unnoticed. After the first implantation, partial eyebrow tail didn’t grow well. We checked the direction and quality of the eyebrow head and made a consecutive curve of the eyebrow. The result of integral contour presented after secondary remodification (Figures 3 & 4).
Shape adjustment
Some patients intend to change their eyebrow shape after transplantation. The stretching points of the eyebrow contour are mostly affected by the spots of brow’s peak. If the peaks’ position beyond the lateral canthus, the patient will appear angry and old look. Trying to enhance both brow heads and closer to the middle nose, it will lower down the arch of the eyebrow’s contour. After adjustment and strengthening the heads of the eyebrows, it would make the face appearing kinder, gentler, and more pleasant (Figures 5 & 6).
Density problem
The contour and shape of the eyebrow are built by several hundred hairs. To implant several hundred hairs onto this limited area is really an arduous and skillful technique. However, the patients often desire the evenly displayed eyebrow hairs without any interspace for the better homogeneous presentation. We used single hair and small 2- hair grafts interspersing in the original hairs, making it look more pleasing and homogeneous (Figures 7 & 8).
Curl direction
Generally, most common problems are related to direction and curl, colour and texture mismatch or lack of regrowth [5]. Despite of the shape design and point location, the curl direction is an important factor to make up the image of the eyebrow. Reverse or crooked direction would damage the smooth curve of the eyebrow. To remedy the interference of the bad curl, we implant more and thicker hairs inside and beside them to ease off the visual effects of the undesired curl directions as much as possible (Figures 9 & 10).
Shaft diameter
Compatible hair qualities are necessary in eyebrow revision, even though it is unreasonable in some case. Selection of shaft diameter is related to the eyebrow even face image before surgery. Thus, selecting compatible shaft diameter is important factor in eyebrow revision. It is more important to check the eyebrow shaft of previous implant by trichoscopy before eyebrow transplant, it could find a better reference for revision [6] (Figures 11 & 12).
Low survival rate
FUE is popular in recent years. Howeveer, unskilled physicians may have undesirable consequences. The patient received FUE eyebrow transplant one year before coming to our clinic. Unfortunately, the implanted follicles from FUE presented extremely low survival rate. And owing to the short shaft of follicle is difficult to orient the hair flow, the hairs growed in odd directions. Because of poor survival rate and different hair flow, it will not present a smooth curve of the eyebrow at all. The affected area is too large for the patient to distinguish between old and new hairs. So, the author has to implant the eyebrows with very high density to facilitate the patient trimming (Figures 13 & 14).
Post-operativecare
The patients are instructed not to wash the face and doing make-up on the periorbital area from the next post-operative day until all crusts have fallen off, about ten days after. After ten days, the implanted hair will start to fall off and nearly all brow transplanted hair fall due to anagen effluvium [7] until two months. Hair regrowth begins at 3-5 months. In next 6-8 months, number increases with more density.
Conclusion
The revision of eyebrow restoration is even more challenging than the virgin eyebrow implantation. The details include low follicle density, peculiar hair curl directions, unnatural looks, unsatisfied shapes, hair qulity and so on after implantation. Inspite of the above, sometimes it still varies regarding the personalities of the patients. To keep careful and conservative communication with the anxious patients is a main determinant before making decision. Overall, with the use of highest standards of techniques and with increasing experience, we provide excellent and beautiful results with patient’s accurate anticipations.
To Know More About JOJ Dermatology & Cosmetics Please click on:
https://juniperpublishers.com/jojdc/index.php
For more Open Access Journals in Juniper Publishers please click on:
https://juniperpublishers.com/index.php
#Juniper publishers#Open access Journals#Peer review journal#Juniper publisher reviews#Juniper publisher journals
0 notes
Text
Enteritis: Still a Problem in Dairy Calves

Abstract
The neonatal phase of calves is a phase that needs extra care due to newborns’ vulnerability. Enteritis - an inflammation of the intestinal mucosa, resulting mainly in diarrhea - stands out among the conditions that affect animals in this period. Enteritis are responsible for huge losses in cattle breeding, especially in the early stages of rearing. Besides the losses caused by mortality, there are also expenses with veterinarians, treatments and decreased performance of the animal throughout its productive life. The present study aimed to perform a review of diarrhea in newborn calves.
Keywords: Neonatal diarrhea; Infectious agents; Dairy cattle
Abbrevations: ETEC: E. coli enterotoxigenic; EHEC: E. coli enterohemorragic; BVDV: Bovine Viral Diarrhea Virus
Introduction
The neonatal period in cattle - that goes from birth to 28 days of age - is especially important from a health point of view, since approximately 75% of losses in young calves occur in this phase [1], and the first week of life is considered the most critical phase, with 50% of losses. Therefore, maintaining the health of calves is highly related to the hygiene of the place where they live, as they are extremely sensitive to environmental pathogens [2]. Lorenz [3] report that there are several measures to maintain calf health from birth to weaning, including the provision of good quality colostrum in adequate quantity in the first hours after birth and the need to emphasize the prevention of diseases of the gastrointestinal tract and respiratory system. Among the main conditions that cause loss in the early stages of calves development are pneumonia, malformations, central nervous system diseases, and enteritis [4]. Enteritis is clinically mainly manifested by diarrhea and stands out due to its high mortality rate [2,3,5,6], since it is commonly difficult to recover because it is almost always accompanied by malnutrition [7].
Diarrhea is a complex multifactorial disease involving animal, environmental, nutritional, and infectious agents and it is a major cause of mortality, morbidity, and economic loss in cattle worldwide [8], because the treatment of affected calves is slow and impacts on growth, weight gain to weaning and loss of genetic potential of recovered animals [9]. Due its clinical and economic importance and due the preventive measures are often neglected, it is necessary an approach on this subject, to broaden the knowledge and to promote a better conduct regarding the prevention, diagnosis and treatment of the affected animals. Therefore, the present study aimed to review diarrhea in newborn calves.
Diarrhea in Newborn Ruminants
Newborn calf diarrhea is a disease of great impact on the economic viability of cattle herds worldwide [10] (Table 1). The economic impact caused by this condition is significant, although many new intervention strategies, such as vaccine development drug development and herd management, have been developed and implemented to minimize it [2]. In this sense, the veterinarian needs to assess the status of immunoglobulins in calves, feeding, shelter, environmental disinfection, hygiene and sanitary management, to prevent neonatal deaths caused by the disease [11]. The processes involved in the pathophysiology of diarrhea are related to intestinal secretion/ hypersecretion, nutrient bad absorption and digestion, osmolarity, abnormal intestinal motility, increased hydrostatic pressure, and gastrointestinal inflammation [12-21], which may occur singly or, more commonly, by the combination of two or more factors of these mechanisms [22,23].
Secretory diarrheas occur due to abnormal stimuli to the intestinal mucosa crypts that may be caused by the action of enterotoxins and/ or the action of inflammation mediators such as prostaglandins, causing an imbalance in physiological processes, like secretion and intestinal resorption, with consequent diarrhea [24]. Diarrhea is typically profuse without blood or effort, and signs in affected calves include depression, weakness, and sometimes shock and death secondary to hypovolemia and mild acidemia [25]. The difference in osmolarity with increased concentration of solutes within the intestinal lumen, promotes greater absorption of water by the lumen, thus resulting in dehydration of the animal. Osmotic particles include poorly digested disaccharides and increased levels of D-lactate from bacterial fermentation of unabsorbed nutrients entering the colon. Reduced intestinal transit time can lead to poor digestion and malabsorption due to inadequate time for digestion and absorption of ingested food, impaired fluid resorption has a major impact on fluid balance [23].
When a calf has diarrhea, there is a huge loss of fluids and electrolytes from its body. Thus, the consequent dehydration and the appearance of metabolic acidosis are the main causes of death of these animals [26]. This happens partly because the evaluation of the animal is generally based only on clinical examination, and a more detailed approach to assessing the degree of electrolyte disturbance and acidosis through blood gas analysis is lacking or not [27]. Although this condition being common in rural properties, treatment is usually inadequate and / or insufficient, because the administration of antibiotics and anti-inflammatory drugs do not correct the hydroelectrolytic disorders and acid-base [28]. Therefore, in order for the recovering of the animal, these parameters must be measured and corrected quickly, enabling the return to homeostasis. The high frequency and persistence of calf neonatal diarrhea has attracted the interest of many researchers. The multifactorial etiology (bacteria, viruses and protozoa) influenced by nutritional and environmental factors, as well as difficulties in the precise diagnosis of the agent and the failure of treatment has required the adoption of prophylactic measures, such as cow hygiene, management and vaccination [8].
Diarrhea Infectious Agents
Diarrhea is a condition of complex multifactorial etiology, influenced by infectious, nutritional and environmental factors, as well as improper management practices. Causes include toxins, bacteria, protozoa, viruses, and management / environmental factors such as overfeeding, low temperature, poor hygiene, colostrum deprivation, and individual susceptibility of the animal [8]. Numerous infectious agents have been implicated in diarrhea of calves, such as Escherichia coli, Salmonella spp., Cryptosporidium spp., Rotavirus and coronavirus. Coinfection is commonly seen in diarrheal calves, although a single primary pathogen may be the cause in some cases. The non-infectious causes of origin are related to improper management and poor hygiene of the environment in which the animals are placed. The incidence of the disease may vary according to the geographical location of the farms, farm management practices and herd size [2]. Rotaviruses, coronaviruses and cryptosporides, the most commonly recognized enteric pathogens of calves, all produce intestinal villi atrophy, intestinal bacterial overgrowth, malabsorption, and osmotic diarrhea [25].
In general, infections caused by viruses and protozoans tend to damage the intestinal mucosa promoting alteration in intestinal absorption due to damage to intestinal cells, compromising the normal absorption of nutrients, fluids and electrolytes, without alteration in intestinal secretion [22]. Rotaviruses are the most common cause of diarrhea in newborn calves and are often involved in co-infections with other agents [11,23,25]. Clinical signs usually appear 1 to 3 days after infection lasting 5 to 9 days [23]. High environmental contamination, herds with high numbers of animals and management that favors the transmission of the agent, associated with an inexpressive immunization rate, provide favorable conditions for the spread of rotavirus in dairy herds in Brazil, justifying the prevalence and difficulty to control the infection and the spread of the virus [28]. The incidence of many etiological agents varies with the calf’s age (Table 2) and this is useful for establishing the probability of a particular agent being involved and it is generally impossible to establish a definitive field diagnosis [11].
Diarrhea may result from hypersecretion or decreased absorption. Enteropathogenic strains of E. coli are occasionally causing diarrhea in calves [29]. Enterotoxigenic E. coli, Salmonella spp, Campylobacter spp. and rotavirus cause diarrhea by secreting enterotoxins that stimulate increased intestinal secretions, while protozoa and enteric viruses cause epithelial destruction of the absorptive cell villi. Enterotoxigenic E. coli produces profuse watery diarrhea, mainly in calves older than 4 days of age and occasionally in older calves. The F5 antigen may produce a mild clinical syndrome characterized by diarrhea, dehydration and weakness in calves from 1 to 4 days of age with rapid course and may progress from healthy to decubitus and death from 6 to 12 hours [11]. Salmonella spp. is an important causative agent of diarrhea and septicemia in dairy calves and the depression caused in the animal is probably due in part to endotoxemia, not just dehydration and acidosis. Campylobacter jejuni and Campylobacter fecalis are believed to be of minor importance in calves and lambs [11].
Cryptosporidium is cited as the main agent of diarrhea in calves, not only as an opportunistic agent, but also as a primary agent. Preventive measures should be taken related to the management of cows at the time of giving birth, avoiding the agglomeration of animals and environmental contamination to reduce economic losses, and to avoid the risks to public health arising from infection [24]. The recognition of enteropathogens guides the adoption of effective prevention and control measures, besides alerting to public health reflexes, due to the zoonotic potential of several of these enteric pathogens [29,30].
Treatment
Physical examination of the diarrheal calf comprises the first step in establishing the therapeutic approach, requiring the determination of the presence of any intercurrent disease. Treatment of simple cases depends on the estimative of dehydration (Table 3), severity of acidosis, likelihood of concomitant infection, presence or absence of hypothermia and hypoglycemia [11]. The most common causes of death are dehydration and acidosis. Blood gas analysis will accurately determine the degree of metabolic acidosis [29] (Table 4). Therefore, the immediate goal in treating depressed calves is to restore them to physiological systemic status. The estimated severity of dehydration can be combined with estimates of diarrhea loss and maintenance of essential functions to manage total daily fluid requirement [11,29].
Abbreviations: pCO2, carbon dioxide pressure; pO2, oxygen pressure; HCO3-, plasma bicarbonate concentration; TCO2, total carbon dioxide in plasma; BE, base excess in the blood; StB, standard bicarbonate blood concentration; SatO2, blood oxygen saturation. Fonte: Lisbôa et al. [31]. Replacement may be administered intravenously or orally, reminding that for the latter one should be increased by 60 to 80% for partial fluid absorption [11,29]. If performed early in the disease, oral replacement can be highly effective and inexpensive. In animals with severely impaired intestinal motility, the intravenous way may be more effective in correcting hydroelectrolytic imbalances than oral administration [23]. Success of therapy is monitored based on clinical signs of calf and restoration of urination [11]. Another point to consider in chronically diarrheal calf is the need for nutritional support. When a samll quantity of milk or solid food is ingested, energyrich oral electrolytes may be used to maintain the body condition of the animal. Stop giving milk can reduce the severity of diarrhea and depression in severe diarrhea, because malabsorption exacerbates diarrhea by the osmotic effect of unabsorbed milk nutrients and also promotes bacterial proliferation and possibly poor fermentation generating organic acids. However, stop giving milk reduces weight gain [11].
Antibiotic use is frequent in the treatment of diarrhea, although few agents respond to antimicrobials, viral and parasitic agents are not directly sensitive to antibiotics. Their indiscriminate use promotes the selection of resistant strains and complicates future therapeutic efforts. However, they can attenuate clinical disease, decrease the release of pathogens to the environment and animal mortality [11,29]. Some treatment protocols include the use of anti-inflammatory drugs to help reduce the secretory effects of some agents [11]. The use of non-steroidal anti-inflammatory drugs (NSAIDs) should be restricted in dehydrated animals and administered only when the patient is sufficiently hydrated [23]. The use of probiotics, oligosaccharides and intestinal protectors is also cited, and the use of gastrointestinal motility modifiers is contraindicated, as the reduction in motility will lead to the accumulation of bacteria and pathogenic toxins [29].
Prevention
The principles of prevention are based on ensuring adequate colostral intake, specific help and nonspecific immunity, reduction of the possibility of introduction / dissemination of infectious agents [11]. Colostrum is important in preventing morbidity and mortality of diarrheal calves. Colostral antibody is responsible for the low incidence of rotavirus infections in calves under 4 days of age. Vaccination of pregnant cows is important to increase colostral immunity. Colostrum privation, lack of maternal instinct, and early separation of cow and calf are major causes of failure to transfer immunity in dairy calves [11]. Prophylactic measures include separating calves from each other with enough space to prevent contact and infection through contaminated feces and urine. All feeding facilities and equipment (buckets and bottles) must be maintained with strict hygiene conditions. There is not much difference between the patterns of disease development and the prevention of calf diarrhea according to each etiological agent. Knowledge of the causal pathogen (s) is important to accurately avaliate the current status of the affected property and to develop new interventions [2].
To Know More About Journal of Dairy & Veterinary sciences
Please click on: https://juniperpublishers.com/jdvs/index.php
For more Open Access Journals in Juniper Publishers
please click on: https://juniperpublishers.com/index.php
#wildlife management#wild life rehabilitation#wildlife diseases#dairy microbiology#Juniper Publishers#open access journals
0 notes
Text
Obesity in Obstetrics

Mini review
The people in industrialized countries have experienced a dramatic increase in obesity in recent times. Prevalence of obesity has doubled in the last 25 years. In the United States, 17-th on the list of most obese places in the world - average BMI 28.8 Kg/m2, more than 60% of reproductive-age women are overweight and 35% are obese, representing a 70% increase in pre-pregnancy obesity. In Romania, 75th on the list- average BMI is 22.2 Kg/m2, the lowest average BMI in the European Union (9.4% obesity in 2016). [1] One of three Romanians is overweight, and one of four is obese. There are over 3.5 million obese in Romania. The highest obesity rate is recorded in Moldova, where the percentage is 23.8%. Only 10% of them see a doctor. Only one percent are included in a national obesity education program [2].
Not all ethnic groups are at equal risk. Of particular concern is the rapid increase in adolescent overweight and obesity. Concordantly, pregnancy obesity rates are also increasing. Obesity is associated with increased morbidity and 6- to 12-fold increase in mortality. Obesity is highly complex in terms of etiology and prevalence. Genetic predisposition, race, socioeconomic status, built environment (e.g., the presence of sidewalks or community design), accessibility of healthy and affordable foods, sleep habits, and geographic region all play a role. Lifestyle changes, which include consuming foods and beverages with a high glycemic index, increased food portion sizes, decreased structured physical activity, and increased screen-based sedentary behavior, have influenced the prevalence of obesity.
Antenatal Monitoring
An evaluation of dietary intake and exercise habits can provide insight into women at risk. All pregnant women without contraindications should participate in regular exercise. During prenatal visits women should be questioned and advised about their diet and exercise habits. Where available, nutritional counselling can be a helpful adjunct for women not meeting the weight gain recommendations.
The sonographer’s ability to evaluate fetal structures is largely dependent on maternal size. Approximately 15% of normally visible structures will be sub optimally seen in women with a BMI above the 90th percentile. In women with a BMI above the 97.5th percentile, only 63% of structures are well visualized. Obstetric care providers should take BMI into consideration when arranging for fetal anatomic assessment in the second trimester. Anatomic assessment at 20 to 22 weeks may be a better choice for the obese pregnant patient.
Use all available technical tools improving image quality in obesity: lower transducer emission frequencies; harmonic imaging; compound imaging; speckle reduction filters. Consider approaching the fetus through the four major abdominal areas with least subcutaneous fat: periumbilical area, suprapubic area, right and left iliac fossae. Consider using the transvaginal approach for the assessment of the central nervous system (CNS) in fetuses in vertex presentation.
Gently inform the patient and her partner that obesity will reduce the diagnostic accuracy of the scan. Consider including the BMI value among the demographic data in the report to document the presence or absence of maternal obesity. Report other cofactors of limited acoustic window, such as previous cesarean section (for the scar), twinning and myomata.
Pregnancy Complications
The risk of spontaneous abortion is increased in obese women. Lashen et al. identified an odds ratio for spontaneous abortion of 1.2 (95% CI 1.01 to 1.46) for obese women (BMI > 30 kg/m2). The authors also identified an increased risk of recurrent early miscarriages (more than 3 successive miscarriages < 12 weeks’ gestation) in the obese population, odds ratio 3.5 (95% CI 1.03to 12.01).[8] Similar risks have been identified in obese women undergoing in vitro fertilization treatment [3].
Pre-gestational diabetes is more prevalent in obese women. Therefore, testing during early in pregnancy for women with risk factors is recommended. Obese women are also at increased risk of developing gestational diabetes (GDM). Not surprisingly, obese women are also at increased risk of having a macrosomic child. Physical activity is inexpensive and can significantly reduce the risk of gestational diabetes. More relevant to the obese population, they also reported a 34% reduction in the development of gestational diabetes in women who did not participate in vigorous exercise but who did participate in brisk walking compared with those who participated in easy pace walking. Women with GDM have a 30% chance of developing type 2 diabetes later in life [4].
Intrapartum Complications and Management
Macrosomia and shoulder dystocia
The use of antenatal ultrasound to detect fetal macrosomia is associated with such obstetric interventions as labor induction and cesarean section. The rate of cesarean section is affected. Higher cesarean section is more frequent when ultrasound examination indicates a macrosomic fetus.
Fetal monitoring
The obese abdominal wall may make monitoring more difficult than in other cases, and of course, the positive predictive value of antenatal testing (e.g. cardiotocography, nonstress testing, biophysical profile assessment) is limited. There is no evidence to support the routine use of internal fetal monitoring in this population, but it may be more effective in some women. Monitoring contractions and ensuring adequate labor in obese women poses a special challenge. Obese women require more oxytocin in labor. Consider allowing longer first stage of labor before performing a cesarean for labor arrest. Although most obstetric care providers rely on manual palpation and/or external tocometry, the use of an intrauterine pressure catheter may be advantageous in some cases.
Cesarean section
The risk of cesarean section is increased in the obese parturient. The increase in cesarean section rate may be partly due to the fact that overweight and obese nulliparous women have a slower progression of the first stage of labor. When faced with lack of descent in the second stage of labor, some practitioners may opt for cesarean section rather than operative vaginal delivery because of concerns about fetal macrosomia and shoulder dystocia. This may explain the low rate of operative vaginal delivery in some series [5]. Obese women undergoing caesarean section experience more complications, including blood loss > 1000 mL, increased operative time, increased postoperative wound infection and endometritis, and need for vertical skin incision. The obese diabetic women who undergo cesarean section have an odds ratio for postoperative wound infection of 9.3 (95% CI 4.5 to 19.2), and those who require a vertical skin incision have a 12% rate of wound complication serious enough to require opening the incision [6].
For morbidly obese patients, two standard 50-cm-width operating tables secured together may be necessary. Specially constructed wider operating tables would be ideal. Weighing scales suited for obese patients are necessary not only to measure weight and evaluate weight gain during pregnancy, but also for calculating medication dosages. A wider delivery bed that is easy to move around and that may be used at all stages of delivery, including cesarean section, without the need to move the patient into another bed is most useful. Nursing care of obese patients requires ergonomic adaptation and knowledge about the special risks involved in caring for these patients. More trained nurses are necessary to care for morbidly obese patients.
The decision-to-delivery interval may be longer when an emergent or urgent cesarean section is required in obese parturient. Causes for this delay may include patient transport and bed transfer, the time to establish adequate anesthesia, and the operative time from incision to delivery. The 30-minute rule of emergency cesarean section is an arbitrary threshold rather than an evidence-based standard.
Vaginal birth after cesarean section
In the absence of contraindications, women who have had their first child by cesarean section are asked to consider vaginal birth in subsequent pregnancies. The success of vaginal birth after cesarean section is commonly quoted at 80% [7]. Obese women are less likely than their lean peers to be successful in delivering vaginally after previous cesarean section (VBAC). In women with a BMI > 29 kg/m2 the success rate is 54% to 68% [8]. The success rate is further reduced in even heavier women. Chauhan et al. found a 13% VBAC success rate in women >300 lbs (136 kg) [9].
Thromboembolism
The risk of thromboembolism is high in obese parturients. Edwards et al. reported 683 obese women (BMI > 29 kg/m2) who were matched to 660 normal weight women (BMI 19.8 to 26.0 kg/m2). The incidence of thromboembolism was 2.5% in the obese women, and only 0.6% in the controls.[29] BMI >30 plus one additional risk factor qualify for seven days of postpartum Clexane; BMI >30 plus two additional risk factors require Clexane antenatally and for 6 weeks postpartum; BMI>40 should be regarded as already having two risk factors. Clexane dosage should be calculated by weight:
Early mobilization and T.E.D. anti-embolism stockings are clinically proven to reduce the incidence of deep vein thrombosis by up to 50% and to promote increased blood flow velocity in the legs 138% of baseline by compression of the deep venous system.
Perinatal outcomes
Maternal obesity is also an established risk factor for stillbirth. The reported risk of stillbirth is 2-5 times higher in obese compared with normal-weight women. The risk of stillbirth associated with obesity increases with gestational age. Infant mortality rates increase from 2.4/1000 among normal weight women (BMI 18.5-24.9) to 5.8/1000 among women with grade 3 obesity (BMI ≥ 40.0). Maternal overweight and obesity are associated with increased risks of infant mortality due to increased mortality risk in term births and an increased prevalence of preterm births. Maternal obesity may increase the risk for intellectual disability or cognitive deficits in offspring from 1.3- to 3.6-fold. Maternal prepregnancy obesity and high gestational weight gain of > 18 kg was associated with a 3-fold increase in offspring IQ deficit (mean of 6.5 points lower) [10]. The majority of studies that have examined a link between high maternal BMI and childhood diagnosis of autism spectrum disorders have found a significant positive association. This risk may be further augmented by intrauterine growth restriction (IUGR), preterm birth, high gestational weight gain, gestational or pre-gestational diabetes, and preeclampsia [11].
Conclusion
A national information campaign is required to exploit women’s interest in having as healthy a pregnancy as possible by giving them the information they need to become fit and have a normal BMI before they consider pregnancy. Periodic health check-ups and other appointments for gynecologic care prior to pregnancy offer ideal opportunities to raise the issue of weight loss before conception. Women should be encouraged to enter pregnancy with a BMI < 30 kg/m2, and ideally < 25 kg/m2. Although obesity is not an indication for the transfer of routine obstetric care, consultation with or referral to physicians with expertise in obesity may be appropriate if the obstetrician cannot safely and effectively care for the patient because of the lack of the specialized training, experience or institutional resources.
To Know More About Nutrition and Food Science International Journal
Please click on: https://juniperpublishers.com/nfsij/index.php
For more Open Access Journals in Juniper Publishers
please click on: https://juniperpublishers.com/index.php
1 note
·
View note
Text
Omega-3 Polyunsaturated Fatty Acids, Metabolic Syndrome and Diabetes Mellitus

Authored by Victoria Serhiyenko
Abstract
Omega-3 polyunsaturated fatty acids (ω-3 PUFAs) are increasingly being used to prevent cardiovascular diseases (CVD), and cardiac societies recommend the intake of 1g/day of the two ω-3 PUFAs eicosapentaenoic and docosahexaenoic acid for primary and secondary prevention of CVD. Clinical trials clearly suggest beneficial effects of ω-PUFAs consumption on lipid metabolism profile, their anti-inflammatory actions; on endothelial activation, which are likely to improve vascular function; antithrombotic and antiatherosclerotic properties. Experimental studies demonstrate direct antiarrhythmic effects, which have been challenging to document in humans. By targeting arterial stiffness and endothelial dysfunction administration of ω-3 PUFAs may prevent atherosclerosis and CVD development. A synergistic interplay showed by ω-3 PUFAs prescription suggest the potential to beneficially impact on fundamental steps involved in the development of preclinical atherosclerosis. We reviewed available evidence of the benefits of ω-PUFAs administration, especially to patients with CVD, metabolic syndrome and type 2 diabetes mellitus, including their effects on potential molecular pathways, effects on glucose and lipids metabolism parameters, thrombocyte aggregation parameters and haemostasis, endothelial function, antioxidant/anti-inflammation and antiarrhythmic properties.
Keywords: Omega-3 polyunsaturated fatty acids; Coronary heart disease, atherosclerosis; Diabetes mellitus; Glucose, lipids; Inflammation; Platelets; Haemostasis; Endothelium; Heart rate variability; Arrhythmias; Arterial stiffness
Abbrevations: ω-3 and ω-6 PUFAs: Ω-3 and ω-6 Polyunsaturated Fatty Acids; MetS: Metabolic Syndrome; T2DM: Type 2 Diabetes Mellitus; CVD: Cardiovascular Diseases; DLP: Dyslipoproteinemia; OS: Oxidative Stress
Go to
Introduction
Numerous studies report salutary effects of ω-3 polyunsaturated fatty acids (ω-PUFAs), i.e. eicosapentaenoic (EPA) and docosahexaenoic acid (DHA) on cardiovascular diseases (CVD) risk factors. These effects include lowering of serum triglyceride (TG) by reducing of hepatic TG production; lowering of blood pressure (BP) by improving of endothelial cell functution; decreasing of platelet aggregation by reducing of prothrombotic prostanoids; decreasing inflammation via reduction in 4-series leukotrienes (LT) production; protection from arrhythmias by modulation of electrophysiological properties of cardiac myocytes. Systematic meta analysis suggests that high doses of ω-3 PUFAs (~3g/day) produce a small, but significant decrease in systolic blood pressure (SBP) in older and hypertensive subjects [1,2]. The aim of this study was to review the latest evidence about the ω-PUFAs, metabolic syndrome (MetS) and type 2 diabetes mellitus (T2DM).
Go to
Discussion
Ω-3 and ω-6 PUFAs are essential fatty acids, as they cannot be synthesized de novo in humans. There are limited data available regarding the exact amount of dietary ω-3 PUFAs consumed by the general population. It is reported that the total daily intake of dietary ω-3 PUFAs in the US is approximately 1.6g. Of this α-linolenic acid (α-LLA) accounts for approximately 1.4g/q.d, and only 0.1–0.2g/q.d. comes from EPA and DHA. The conversion rate from α-LLA to EPA and DHA is variable (0.2-15%). Therefore, in general, the total amount of EPA and DHA available to the body from current dietary patterns is well below the recommended amounts. EPA and DHA didn’t show a significant negative effect on glucose metabolism [3].
Several experimental studies have shown that long-chain ω-PUFAs inhibit the absorption of cholesterol in the intestine and its synthesis in the liver, lead to increased clearance of lipoproteins in the blood, prevent the development of insulin resistance (IR) in experimental diabetes, increase the level of glucose transporter 4 in skeletal muscles, have a positive effect on age related decrease of blood flow in the brain and improve glucose utilization under stress; there isn’t any influence on the development of hypertension (HT) and MetS. Ω-3 PUFAs decrease level of BP, dose-dependent prevent the development of T2DM, IR, contribute to positive changes of blood coagulation parameters; enhance endothelial cell migration and inhibits the proliferation of smooth muscle cells [4]. A meta-analysis of 18 studies found a significant effect of fish oil to lower TG concentrations and increase high-density lipoprotein cholesterol (HDL-C) in the blood; while there were no statistically significant changes in preprandial glucose, glycated hemoglobin A1c, total cholesterol, low density-lipoprotein cholesterol levels. Ω-3 PUFAs may affect the IR and glucose homeostasis by inhibition of IR in the muscle tissue >adipose tissue >>liver, inhibition of insulin secretion, which defer the development of T2DM; and on the state of lipid metabolism (in particular, reduce the concentration of TG, very low density-lipoprotein cholesterol (VLDL-C), increase of HDL-C, improve lipid profile by mixed hyperlipidaemia (HLP), slightly decrease BP, improve endothelial function, have an positive impact on the antioxidant status and inflammatory reactions [5]. Ω-3 PUFAs decrease VLDL assembly and secretion, resulting in diminished TG production, through a decreased sterol receptor element binding protein-1c activity [6,5].
The highly concentrated pharmaceutical preparation Omacor™ (Pronova Biocare, Lysaker, Norway), known as Lovaza™ (Glaxo Smith Kline, St Petersberg, FL, US) in North America is approved by the FDA as an adjunct to diet to reduce very high TG levels (≥500 mg•dL-1) in adults. Each 1-g capsule of ω-3-acid ethyl esters contains ethyl esters of EPA (0.465 g) and DHA (0.375g). Patients take a q.d. dose of 4-g or two 2-g doses (two capsules b.i.d.) [7]. Clinical trials have shown that administration of 4 g•day-1 of Lovaza™ results in a decrease in TG levels of 30-50%; does not affect the efficacy of statins [8,5]. In patients with combined HLP, co-administration of Lovaza™ with statins was a safe and effective means of lowering serum TG, despite the persistent high TG levels when the patients received statins alone [9,5].
The anti-inflammatory actions of marine ω-3 PUFAs are [10]: reduced leucocyte chemotaxis (via decreased production of some chemoattractants (e.g. leukotriene B4 down-regulated expression of receptors for chemoatttactants); reduced adhesion molecule expression and decreased leucocyte-endothelium interaction (via down-regulated expression of adhesion molecule genes [via the nuclear factor kappa B (NF-kB) (i.e. peroxisome proliferator-activated receptor-ɣ (PPAR-ɣ) etc.); decreased production of eicosanoids from arachidonic acid (AA) (via lowered membrane content of AA; inhibition of AA metabolism); decreased production of AA containing endocannabinoids (via lowered membrane content of AA); increased production of ‘weak’ eicosanoids from EPA (via increased membrane content of EPA); increased production of anti-inflammatory EPA and DHA containing endocannabinoids (via increased membrane content of EPA and DHA); increased production of pro-resolution resolvins and protectins (via increased membrane content of EPA and DHA); decreased production of inflammatory cytokines (via down-regulated expression of inflammatory cytokine genes (via NF-kB, i.e. PPAR-ɣ etc.); decreased T cell reactivity (via disruption of membrane rafts (via increased content of EPA and DHA in specific membrane regions).
Ω-3 PUFAs may decrease the risk of atherothrombosis by affecting platelet aggregation and haemostasis. The antithrombotic properties of EPA and DHA have been attributed to the incorporation into platelet phospholipids at the expense of the ω-6 PUFAs, such as AA. An important set of pathways clearly influenced by changes in the ω-3/ω-6 ratio are those for synthesis of eicosanoids. These include the cyclooxygenase (COX), lipoxygenase and cytochrome P450 epoxygenase pathways, for which EPA and DHA compete with AA as a substrate, inhibiting the production of the proaggregatory thromboxane A2 (TXA2) originating from AA. Indeed, the production of TXA2 from platelets stimulated by a variety of agonists decreased by between 60% and 80% after fatty acid supplementation both in vitro and in vivo [11,5]. The mechanism by which ω-3 PUFAs influence endothelial function is mediated by their incorporation into biological membrane phospholipids; this allows modulation of membrane composition and fluidity. The reason lies in the fact that endothelial cell membrane houses caveolae and lipid rafts where several receptors and signaling molecules crucial for cell function are concentrated [12]. Caveolae-associated receptormediated cellular signal transduction includes important pathways such as the, the nitric oxide (NO)/cyclic guanosine monophosphate signaling pathway, the nicotinamide adenine dinucleotide phosphate oxidase and tumor necrosis factor-α/ NF-kB induced COX-2 and prostaglandin E2 activation pathway. By modulating the composition of caveolae, as described for other classes of lipids ω-3 PUFAs may exert their beneficial effects, which include increased NO production and reduced production of proinflammatory mediators [13,12]. In addition to increasing NO production, ω-3 PUFAs decrease oxidative stress.
The incorporation of ω-3 PUFAs in synaptic membranes could potentially influence the autonomic control of the heart. Both nervous tissue and heart tissue have a high content of ω-3 PUFAs (especially DHA) and this may be consistent with the finding that this marine ω-3 PUFAs may modulate cardiac autonomic function as assessed by heart rate variability (HRV) [14]. Thus, ω-3 PUFAs may modulate HRV both at the level of the autonomic nervous system and the heart. Most of the data support that ω-3 PUFAs beneficially modulates cardiac autonomic control thereby possibly reducing the risk of arrhythmias. Accumulating evidence from in vivo and in vitro experiments has demonstrated that ω-3 PUFAs exert antiarrhythmic effects through modulation of myocyte electrophysiology. Ω-3 PUFAs reduce the activity of membrane Na+ channels in cardiomyocytes, thus increasing the threshold for membrane potential depolarization. EPA and DHA also modulate the activity of L-type Ca2+ channels, leading to a reduction in free cytosolic Ca2+ ion, which stabilizes myocyte electrical excitability to prevent fatal arrhythmia. EPA blocks the Na+/Ca2+ channel; however, a single amino-acid point mutation in this channel attenuated the inhibitory effect of EPA. These findings suggested that the cardioprotective effect of ω-3 PUFAs is mediated by direct interaction with membrane ion channels [15].
Ω-3 PUFAs intake has shown to reduce BP especially in HT by interacting with several mechanisms of BP regulation: reduction of stroke volume and heart rate; improvement of left ventricular (LV) diastolic filling; reduction of peripheral vascular resistances; improvement of endothelial-dependent and endothelial-independent vasodilation (stimulation of NO production; reduction of the asymmetric di-methyl-arginine; reduction of endothelin-1; relaxation of vascular smooth muscle cells; metabolic effects on perivascular adipocytes; endothelial regeneration. Mechanisms of HT-related organ damage protection: anti-inflammatory, antioxidant, and antithrombotic effects; reduction of arterial stiffness; experimental effects on LV hypertrophy and abnormal gene expression; effects on atherosclerotic plaque progression and stability [7]. Ω-3 PUFAs offer a scientifically supported means of reducing arterial stiffness and this may account for some of the purported cardioprotective effects of ω-3 PUFAs [16,17].
Go to
Conclusion
The antiarrhythmic effects of ω-3 PUFAs, which occur by blocking various ion channels, are encouraging. So, cardiovascular benefits of ω-3 PUFAs [7,18] are: antidysrhythmic effects (reduced sudden death; possible prevention of atrial fibrillation; possible protection against pathologic ventricular arrhythmias; improvement in HRV; antiatherogenic effects (reduction in non- HDL-C levels; reduction in TG and VLDL-C levels; reduction in chylomicrons; reduction in VLDL and chylomicron remnants; increase in HDL-C levels; plaque stabilization; antithrombotic effects (decreased platelet aggregation; improved blood rheologic flow); anti-inflammatory and endothelial protective effects (reduced endothelial adhesion molecules and decreased leukocyte adhesion receptor expression; reduction in proinflammatory eicosanoids and LT’s; vasodilation); decreased SBP and diastolic BP. Thus, further research to understand the mechanism of action and confirm the beneficially effect of ω-3 PUFAs on BP profile, artery stiffness and HRV parameters in patiens with MetS, T2DM is needed.
To Know More About Current Research in Diabetes & Obesity Journal Please click on:
https://juniperpublishers.com/crdoj/index.php
To Know More About Open Access Journals Please click on: https://juniperpublishers.com/index.php
0 notes
Text
Expect the Unexpected with Erector Spinae Plane Block in Spine Surgery - Plan for the Worst and Hope for the Best: An Anesthesiologist Perspective-Juniper Publishers

Abstract
Spine surgery is associated with multiple postoperative complications, ranging from simple nausea and vomiting to devastating complications leading to postoperative morbidity or mortality. The postoperative neurological impairment, especially in the neurologically intact patient, is a dreadful event that makes it difficult for the surgeon to perform technically challenging or high-risk spine surgeries. Preoperative or intraoperative factors that can influence the postoperative neurological status include nature and the severity of the pathology, comorbid conditions of the patient, preexisting neurological symptoms, multiple levels involved, complex surgery or instrumentation, surgical blood loss, neurological monitoring, hemodynamic parameters, polypharmacy, and total duration of the surgery.
In addition to several known contributing factors (fixation failure, epidural hematoma, spinal cord edema, and ischemia-reperfusion injury), the role of the erector spinae plane block (ESPB) has recently been cited as a potential cause of postoperative transient paralysis after spine surgery. ESPB is considered a simple and safe regional anesthesia technique that may have an advantage in success rate and analgesic efficacy when used as an adjunct to general anesthesia in spine surgeries. Despite varied patterns of the drug spread, ESPB has been showing promising results due to consistent involvement of dorsal rami that supply all pain generators of the spine surgeries.
The potential role of ESPB in causing postoperative transient neurological complications is a diagnosis of exclusion that requires thorough clinical assessment and step-by-step evaluation using imaging modalities. Before administering ESPB in spine surgery, essential knowledge includes anatomical and technical considerations, drug distribution patterns, safe and effective volumes/types of local anesthetics, and possible associated complications. This review article describes the possible roles of all factors that lead to postoperative neurological impairment and suggests some tips and tricks for using ESPB in spine surgeries to prevent or manage such serious complications appropriately.
Keywords: Transient paraplegia; Erector spinae plane block; ESP block complications; ESP block in spine surgery; Paraplegia due to RA
Keywords: RA: Regional anesthesia; GA: General anesthesia; ESPB: Erector spinae plane block; ERAS: Enhanced recovery after surgery; LA: Local anesthetics; CT: Computed tomography; MRI: Magnetic resonance imaging; ESM: Erector spinae muscles; TP: Transverse process; SMPB: Sacral multifidus plane block; RLB: Retrolaminar block
Introduction
The occurrence of perioperative complications may be inevitable, but their prevention and management are always a shared responsibility of all team members involved. Thorough evaluation of such complications will help develop strategies to prevent and manage the same in the future. A systematic and stepwise approach is warranted before categorizing it as a surgical or anesthetic complication. Several interventions have been introduced in the surgical and anesthetic techniques to improve patient safety and satisfaction. Application of regional anesthesia (RA) alone or as an adjunct to general anesthesia (GA) is one such advance that helps reduce many polypharmacy-related side effects or complications. If a particular complication-reduction modality is inherently causing complications, it requires a comprehensive understanding of the situation and its contributing factors.
An erector spinae plane block (ESPB), a safe and simple RA technique, has shown promising results as an adjunct to multimodal analgesia in various orthopedic, general, thoracic, abdominal, obstetrics, and spine surgeries. In addition to its superior postoperative analgesic profile in spine surgeries at various levels, ESPB reduces hospitalization costs and the possible side effects of extensive anesthetic use. Since opioids have been linked to tumor recurrence [1,2], ESPB also reduces the risk of spine tumor recurrences by significantly reducing its consumption. ESPB meets all criteria suitable for enhanced recovery after surgery (ERAS) protocol [3] by facilitating early discharge and mobilization of patients. Being a novel RA technique, not many complications have been reported so far except for some anecdotal reports of bilateral quadriceps weakness, transient apathy or aphasia, minor neurological complications due to inadvertent intravascular injection of local anesthetics (LA) [4].
Recently, it has been described as a potential cause of transient paralysis after spine surgeries [5]. Therefore, it is essential to understand the differential diagnoses of postoperative neurological impairment, follow the step-by-step approach to rule them out one by one, determine the possible role of ESPB in their development, and learn the tricks for safely administering ESPB during spine surgery. This review article elaborates the essential background knowledge required before and after the administration of ESPB in spine surgeries.
Discussion
Postoperative neurological impairment after spine surgery in a neurologically intact patient is always daunting for the operating surgeon and the patient. Several common theories on neurological deterioration after decompressive spine surgeries include vascular compromise, hypotension, ischemia, direct trauma, or stretching of the neural elements. The major contributing factors of acute paralysis following spine surgery include fixation failure, epidural hematoma, spinal cord edema, and ischemia‑reperfusion injury [6].
Contributory factors
Neurons in the spinal cord are susceptible to ischemia and hypoxia. The mechanisms of spinal cord ischemia are multi-factorial and multi-channel. The pathogenesis of spinal cord lesions after spine surgeries is usually mechanical (pressure) damage via extensive hematoma or edema, resulting in pressure on the spinal cord leading to ischemic damage [7]. An altered cerebrospinal fluid flow dynamic may also cause cord compression [8]. In either case, the ultimate pathogenic cause is a secondary cellular injury due to the disruption of ionic homeostasis, development of free radicals, lipid oxidation, and degeneration of the cytoskeleton [7]. White cord syndrome, an imaging feature of spinal cord ischemia [9], is diagnosed as high intramedullary signal changes on sagittal T2 weighted MRI scans and is often seen in surgeries on the cervical spine.
The spinal infarct is one of the leading causes of paraplegia or quadriplegia in patients with preexisting vascular pathologies (thrombosis) or embolic events during surgery [10]. The anterior spinal cord has a higher risk of ischemia due to fewer anterior spinal artery feeding vessels [10] than the highly vascular posterior spinal cord due to anastomotic pial vessels. The sparing of the posterior column leads to unchanged intraoperative somatosensory evoked potentials [11]. The ischemia-reperfusion injury occurs upon restoring the blood flow to previously ischemic tissues and organs. Increased inflammatory cytokines such as TNF α and IL 1β may be considered vital indicators for evaluating decompression-associated spinal cord ischemia-reperfusion injury [12,13]. Its reported incidence is 2-5.7% following cervical and 14.5% following posterior thoracic decompression surgeries [14, 15].
Transient paralysis is one such complication that manifests itself as a temporary (up to 72 hours) loss of sensations, movements, anal reflexes, and sphincter function below the affected spinal segments [16]. It can occur after vertebroplasty, laminectomy, or thoracic decompressive procedures [17,18]. The longer duration of symptoms, multiple compression sites, and the high degree of preoperative stenosis are considered poor prognostic factors [18].
Who is the culprit?
The exact cause of the postsurgical neurological impairment is a diagnosis of exclusion requiring thorough clinical evaluation and imaging guidance to rule out each contributing factor (Table 1) in a step-by-step manner. Postoperative radiographic studies like computed tomography (CT) scan and magnetic resonance imaging (MRI) can help detect changes suggestive of misplaced implants, hematomas, edema, compressive lesions, white cord syndrome, or direct trauma to the spinal cord. Symptoms due to spinal cord edema typically occur at 48-72 hours post-surgery and may be relieved by anti-edema measures like fluid restriction [19].
The occurrence and severity of ischemia-reperfusion injury correlate with tissue ischemia time, the extent of ischemic tissue, and the oxygen requirement of the affected tissue [20]. The presence of deep tendon and superficial reflexes may rule out the possibility of hysterical paraplegia [18]. After excluding all contributing factors that may cause postoperative neurological impairment, the possible role of ESPB and LA can be considered and further evaluated. It requires an understanding of the anatomical and technical aspects, mechanism of drug spread, factors favoring neuraxial spread, and measures to avoid such incidents in the future [21].
Role of ESPB
ESPB involves depositing the local anesthetic solution between the erector spinae muscles (ESM) and the transverse process (TP) under ultrasound guidance. The ESM consists of three muscles: iliocostalis, longissimus, and spinalis. They arise from and insert into various bony components of the vertebral column [22] and form a paraspinal column that extends from the sacrum to the base of the skull. It gradually tapers upwards in the paravertebral groove on either side of the spinous processes. The retinaculum (thoracolumbar fascia in the lumbar region) that envelops this muscular column also facilitates the LA spread to several thoracic and lumbosacral levels [23]. The diverse multilayered fascial arrangement deep to the ESM may cause the inconsistent LA spread, resulting in multisegmented sensory block mainly involving dorsal rami with sometimes ventral rami.
This Para neuraxial block, when given bilaterally in spine surgery, can be advantageous in success rate and analgesic efficacy [24]. The absence of risks such as hypotension, vascular spread, or pneumothorax makes ESPB relatively safer than epidural anesthesia or paravertebral block. Bilateral ESPB offers effective perioperative analgesia without influencing the hemodynamic parameters. It significantly reduces the perioperative opioid requirements in spine surgeries at various levels (cervical, thoracic, and lumbar, and sacral) [25-32]. Its outcome depends on the volume and concentration of LA used, drug spread, and the anesthesiologist’s experience in selecting and locating the correct level of the TP.
The exact mechanism of action of the ESP block and pattern of the drug spread is still unclear. It has been suggested to anesthetize the spinal nerves by passing through the costotransverse foramen of Cruveilhier, accompanying the dorsal ramus and artery to the paravertebral space [33]. The deposited drug can spread in any direction, such as craniocaudal, anterior-posterior, and lateral-medial planes to reach the paravertebral space, neural foramina, epidural space, or sympathetic chain [34-38]. Fluoroscopic, CT, and MR imaging in living subjects have similarly confirmed the injectate tracking to the paravertebral area, intervertebral foramina, and epidural space following lumbar ESPB [39-42]. There is also a possibility of LA diffusion through the microscopic gaps in the mostly acellular architecture of interlinked collagen fibers of the fascia covering the erector spinae muscle [43].
ESPB at various spine levels
The anatomical differences at the various spine levels can cause varied drug spread and ultimately affect the outcomes of ESPB. Cervical ESPB is technically challenging due to the difficulty in identifying the tips of the cervical transverse processes due to their shorter length. It is mainly given at the C6 or C7 vertebral level. The probe needs to be kept anterolaterally rather than posteriorly to see the cervical TPs [44]. It may not be safe due to its proximity to the neuraxis (shorter transverse processes) and the possibility of bilateral phrenic nerve involvement [45-48].
Thoracic ESPB at the upper vertebral levels (T2 orT3) can be preferred in cervical spine surgery by inserting the needle from caudal-to-cranial direction to achieve the desired LA spread and avoid technical difficulties and complications associated with cervical ESPB. Thoracic ESPB can provide multilevel analgesia even with the small volumes of LA due to rigid boundaries of the thoracic paravertebral spaces that facilitate drug spread at several levels involving ventral and dorsal rami. Lower thoracic level ESPB is mainly performed for lumbar spine surgeries by inserting the needle from cranial-to-caudal direction to achieve the desired LA spread and avoid technical difficulties associated with lumbar ESPB [49,50].
The lumbar ESPB can also be technically challenging due to the increased thickness of the ESMs with their tendinous attachment to the TPs [51, 52] and increased corresponding depth of the intermuscular plane in the lumbar region. The psoas muscle is also closely adherent to the vertebral bodies and the anterior surface of the TPs. The anterior drug spread to include ventral rami may be compromised due to the lack of clear boundaries of lumbar paravertebral spaces [53]. There is a communication through the fat-filled plane between the ESM and TP with the fat-filled psoas compartment containing lumbar nerve roots and plexuses. The spread of LA to the epidural space is possible through this communication [54]. The compressed lamina and the ligaments of the lumbar spine favor LA spread more into the epidural space [55, 56]. Thus, the lumbar ESPB may result in either lumbar plexus block or epidural anesthesia. The resultant weakness in the quadriceps or lower extremity muscles depends on the LA concentration and volume used in ESPB.
Sacral ESPB is mainly described for gender reassignment surgery or perineal surgery [57-61]. Its application for lower lumbar or sacral spine surgery is yet to be determined. The sacral multifidus plane block (SMPB), one of the variants of the paraspinal block, involves the deposition of LA in the plane under the multifidus muscle and bony area between the median and intermediate crests of the sacrum. The possible mechanism of action of SMPB includes blocking the dorsal rami and medial cluneal nerves directly by LA deposition and ventral rami by anterior LA spread through dorsal and ventral sacral foramina. The SMPB may also block the pudendal nerve (S2–S4), lumbosacral plexus, and sciatic nerve via the anterior and cranial LA spread [61, 62].
The role of LA
The possible role of the LA used in ESPB in causing postoperative neurological compromise depends on its inadvertent spread into either the epidural or subarachnoid space. It can be determined based on the occurrence and recovery pattern of the neurological symptoms. Distal-to-proximal and motor-before-sensory recovery patterns are the hallmarks of the differential blockade of the LA [23]. Inadvertent spread of LA into the subarachnoid space can lead to severe hypotension and bradycardia, resulting in unstable intraoperative hemodynamics. The consequences of the epidural spread depend on the density of LA around the spinal nerves, which could be compromised in a subsequent surgical dissection affecting the potentiality of the epidural space.
The concentration of LA, which determines the mass of the drug, also affects the efficacy of any block. The deliberate use of LA in low concentrations can result in a preferred motor-sparing analgesic effect of such high-volume blocks [63, 64]. Bupivacaine and ropivacaine are the most commonly used LAs for bilateral ESPB. Both LA agents consistently display preferential blockade of C-fibres (slow pain) > A-delta fibers (fast pain) > A-beta fibers (touch/pressure) in both preclinical and clinical studies [64-66]. With the increasing concentration, these agents may result in loss of proprioception and loss of motor function. Lipid solubility and higher pKa of LA facilitate intraneural diffusion and ion channel blockade. Ropivacaine exhibits a relative motor-sparing effect due to its lower lipid solubility than bupivacaine [67]. Twenty milliliters of 0.375% ropivacaine is recommended for each side of the bilateral ESPB in adults [68, 69].
Technical aspects of ESPB
Unexpected outcomes like a neurological compromise can be correlated with possible technical errors while administrating ESPB. The first technical aspect is identifying the correct landmark under ultrasound depending on the surgical extent and the desired level of the block. It may further depend on the sonoanatomy quality and the experience of the anesthetist. Sometimes misidentifying the lamina as the tip of the TP can lead to the retrolaminar block (RLB), another variant of the paraspinal block. In RLB, the needle insertion is slightly medial, targeting the lamina of the vertebra instead of the tip of the TP. It works via diffusion of LA into the paravertebral space through the soft tissue gaps between adjacent vertebrae [70]. Both RLB and ESPB were consistently associated with the posterior spread of injectate to the back muscles and fascial layers [37].
Fluoroscopic-guided ESPB can lead to RLB due to the inability to see the tip of TP clearly like under ultrasound, resulting in deposition of the LA solution over the lamina. The proximity of the RLB to the neuraxis can lead to a high probability of epidural spread, which carries the risk of motor weakness. The second important aspect is the ergonomics associated with bilateral ESPB. Administering the bilateral ESPB by standing on only one side of the patient may result in deviation from the ideal needle trajectory on one side compared to the other. Therefore, technical considerations should focus on stabilizing the needle by one person, injecting LA by another person, and performing such bilateral blocks while standing on either side.
The third important aspect includes technical modifications such as keeping an ultrasound probe in a transverse view to help differentiate intramuscular drug spread from the effective linear drug spread between ESM and TP [71]. The fourth aspect is finding alternatives that involve dorsal rami consistently without causing drug spread to other unwanted areas. The thoracolumbar interfacial plane block is one such alternative that targets only the dorsal rami of the spinal nerve. Thus, it can provide more focused dermatomal coverage of the back required for thoracic and lumbar spine surgeries [72, 73]. However, its efficacy in spine surgeries is yet to be determined. We have suggested some tips and tricks for using ESPB in spine surgeries (Table 2), keeping all technical aspects in mind.
Conclusion
Postoperative neurological impairment following spine surgery is a serious concern for the operating surgeon and the patient. The role of ESPB in causing such complications is the diagnosis of exclusion made after a thorough evaluation of clinical symptoms and radiological studies. For that, understanding of various mechanisms involved in ESPB leading to neurological impairment is essential. It should encourage the anesthetists to take extreme precautions while administering this novel block, considering the anatomical differences at various spine levels. Surgeons should anticipate and explain the possibility of neurological deterioration while explaining the risks and benefits of the proposed surgical intervention. Intraoperatively, real-time neurophysiological monitoring is recommended as a useful tool to avoid further neurological deterioration, especially in extensive and multilevel surgeries or in high-risk and neurologically compromised patients.
After identifying or diagnosing such complications, intensive care and regular checking of spinal function are of great importance, along with simultaneous radiological workups to rule out various causative factors. Once paralysis occurs, early diagnosis and early intervention are essential in restoring spinal function. Despite the rare possibility of such complications, ESPB is still a promising option for ensuring effective perioperative analgesia in spine surgeries. It helps reduce postoperative morbidity by keeping the hemodynamic parameters stable and significantly reducing intraoperative blood loss. It can also avoid postoperative complications that lead to delay in mobility and discharge by significantly reducing the need for opioids and polypharmacy. However, further studies are needed to determine the safe concentration and volume of the LA solution used in ESPB, the exact surgery-specific vertebral level to cover desired surgical innervations, and the accurate LA deposition site to prevent spread to undesired areas.
To Know More About Journal of Head Neck & Spine Surgery Please click on:
https://juniperpublishers.com/jhnss/index.php
For more Open Access Journals in Juniper Publishers please click on:
https://juniperpublishers.com/index.php
0 notes
Text
Exosomal Consignment in Renal Allograft Injury

Abstract
Exosomes are small mobile endocytic vesicles (30-120nm), shredded by every cell to conduct trafficking of cell generated cargo. They are found in almost all body fluids (blood, csf, saliva, urine). These include proteins, lipids, DNA, mi(cro)RNAs etc. In multicellular organisms, they are packaged into numerous vesicles mainly in exosomes to conduct their transport for various cellular activities which can be exploited clinically. Presently the survival of renal allograft is monitored by mostly invasive methods (tissue biopsy, Creatinine, GFR) where curving the injury is quite difficult. Hence potency of molecular markers like proteins and then circulating miRNAs came to picture for early detection of renal injury (Acute Kidney Injury-AKI and Chronic Kidney Disease-CKD). However, due to lack of specificity of circulating miRNAs lose their feasibility and the discovery of these exosomal cargos in cellular communication has become an efficient tool for treatment of various complicated clinical condition including renal allograft injury.
Keywords: micro RNAs,exosome, Renal Allograft Injury
Go to
Introduction
Exosomal world: a prologue
Exosomes are membrane bound mobile vehicles that are found in almost all circulating body fluids like- blood, CSF, saliva, urine, etc. These are responsible for transport of respective cellular cargo to extracellular target sites [1]. Recent studies with exosomes have revealed that exosomal cargo delivery has many important biological, physiological and pathological significance thus, can be an effective diagnostic tool for various diseases [2]. Exosomes are small circulating units of 30-120 nm in diameter, generating from late endosomal compartments of cells by its cell membrane invagination or budding or released as shedding vesicles. Cellular cargos include proteins, lipids, DNAs, mRNAs, miRNAs, etc [1]. The exosomal cell membrane mainly constitute a limiting lipid bilayer, transmembrane proteins and a hydrophilic core containing proteins, mRNAs and microRNAs (miRNAs).
Exsosomes were first discovered by Pan and Johnstone in 1983 [3] when they found that the release of transferrin receptors into extracellular space during sheep reticulocyte maturation was released inside a type of small vesicles. In 1989 Johnstone regarded these mammalian cargo delivering vesicles as exosomes [1-5]. Valadi et al. in 2007 first described about the composition of exosomes that apart from proteins and lipids these also contains DNAs and RNAs [6] which are recorded in ExoCarta database [7,8] . The exosomal cargo delivery requires stimulation of target cell which may be direct by receptor mediated interactions or may aid in transport from cell of origin to various bioactive molecules e.g. membrane receptors, proteins, lipids, mRNAs, miRNAs, etc [7]. When exosomes deliver its contents into the respective target sites the property and behavior of these cells changes to a great extent [8]. It is also understood from various studies done in last couple of years that miRNA composition of parent cell and exosomal components vary a lot [8] and of all the components, miRNAs have drawn the attention due to their regulatory role in gene expression as these are protected against RNAase-dependent degradation [1-8]. Thus exosomal cell-to-cell communication influence both physiological as well as pathological environment of the body. These play important roles in immune reactions, tumorigenesis and in neurodegenerative disorders [1]. e.g. in prostate cancer, ovarian cancers, lymphoma glioblastoma, etc [1].
Biogenesis
Exosomes are formed from late endosomal compartments of cells through endosomal sorting complex required for transport (ESCRT-that recognizes ubiquitylated proteins) to deliver the cargo to target cell or to fuse with lysosomes to degrade the undesired contents [1]. Earlier these exosomes were only considered to be “garbage bags” as their diversified capabilities were unknown then. But now these are the most emerging field of research. The way of formation and secretion of these vesicles from mutlivesicular bodies (MVBs) are of two types [9]:
Microvesicles, which are directly shed from cell membrane.
Exosomes, which are released by exocytosis when MVBs fuse with plasma membrane.
Exosomes can be identified by transmission microscopy as a cup-shaped morphology with negative staining [10-12]. These can be concentrated in 1.10-1.21 g/ml section of a sucrose density gradient [10-12]. Exosomes can be identified by various protein markers e.g. tetraspanin proteins- CD63, CD9, CD81, HSP70 and HSP90, etc [1, 8]. ExoQuick (a one-step precipitation procedure for exosome extraction), Immuno affinity capture, Immunobead (EpCAM), combination of EpCAM and ultracentrifugation, size exclusion chromatography and EpCAM and followed by Quantitative PCR, Microarray techniques for extraction and quantification of exosomes [1,8,13].
Exosomes formation and secretion requires enzymes and ATP. First the cell membrane is internalized to produce endosomes. Subsequently, many small vesicles are formed within endosomes by invagination of its cell membranes [8, 14]. Such endosomes are called MVBs. Finally, the MVBs fuse with endosomal cell membranes to release intraluminal vesicles into extracellular space which become exosomes [14].
The secretion or cell-to-cell communication of exosomes requires certain regulatory factors which were first identified by Ostrowski et al. who observed that Rab27a and Rab27b were associated with exosomal secretion [8]. It was also found that effectors of Rab27- SYTL4 and EXPH5 could also inhibit exosomal secretion in HeLa cells [15]. Also Yu et al. discovered that tumor repressor protein p53 and its downstream effector TSAP6 were required for influencing exosome secretion [16]. Another working group, Baietti et al. observed the importance of syndecan-syntenin which directly interact with ALIX protein via Leu-Tyr-Pro-X(n)-Leu motif in secrection of exosomes by endosomal budding [17]. Koumangoye et al. found that disruption of lipid rafts in exosomal membranes could inhibit its internalization in breast cell carcinoma cell line [18]. Trafficking of exosomes to target sites occurs in following mechanisms:
The transmembrane proteins of exosomes directly interact with signaling receptors of target cell membranes [19].
The exosomal fusion with plasma membrane of recipient cells to deliver the cargo into their cytosol [20].
The exosomes internalization into recipient cells have two fates[21].
in one, some exosomes are engulfed by the cell and may merge with the cell’s endosome and undergo transcytosis
in other case, engulfed exosomes fuse with endosomes and mature into lysosomes for degradation.
As per ExoCarta database records, of all the components proteins and miRNAs have been exploited for various research to correlate some application with different diseased state that could render some remedy. Due to the regulatory role of miRNAs in gene expression these are used as recent area of research as diagnostic tool [8,22]. Goldie et al. demonstrated that among small RNAs, the percentage of miRNAs is higher in exosomes than in parent cells [23]. Studies done with exosomalmiRNAs shows there are specific sorting mechanisms for miRNAs into exosomes. These are:
The neural sphingomyelinase 2 (nSMase-2)-dependent pathway by Kosaka et al. [24].
The miRNA motif and sumoylated heterogeneous nuclear ribonucleoproteins (hnRNPs)-dependent pathway by Villarroya- Beltri et al. [25].
The 3’ end of the miRNA sequence-dependent pathway by Koppers-Lalic et al. [26].
The miRNA induced silencing complex (miRISC)-related pathway and human AGO2 protein [27].
In short there are specific sequence in miRNAs as well as enzymes and proteins that guide them for their sorting into exosomes [8]. Exosomes are shed by cells during both normal as well as pathological conditions. Thus several studies have been made with exosomes in diseased states.
A brief sketch on therapeutic exosomal cargos:
Exosomal miRNA: miRNAs are the recent findings in the field of clinical research which are thought to be crucial in depicting human health and diseases. These biomarkers can also be an indicator for rejection onset of transplanted allograft. miRNAs are a class of small 18-25 nucleotide (nt) long endogenous, noncoding RNAs which play an important role in regulating gene expression [28,29]. A single miRNA has the ability to regulate expression (mostly silencing) of hundreds of mRNAs and have been known to play important role in many cellular functions that include induction of post-translational repression, mRNA degradation/silencing and transcriptional inhibition, cell development, differentiation, proliferation and functional regulation of immune response among others [28-31].
The mystery behind the functional maturation of miRNAs has been solved by research in last couple of years. Similar to mRNAs, miRNAs are also initially transcribed in the nucleus [32]. miRNAs are at first transcribed in nucleus as primary transcript by RNA polymerase II called pri-miRNA [32-35]. This pri-miRNA has a hairpin stem-loop structure (~80nt length) that contains the mature miRNAs [36]. The pri-miRNA processing include recognition of the stem loop followed by its cleavage by DROSHA (a class 2 ribonuclease III) and DGCR8 (a miRNA-processing multiprotein complex) to release pre-miRNA [32-35]. Pre-miRNA is then recognized by Exportin-5 which allows its exports to cytosol for further maturation into 19-25 nucleotide strands by RNA endonuclease III called Dicer [32- 35, 37]. Cleavage of this pre-miRNA by Dicer result in double stranded (ds) RNA molecule of which one of the single strand with more unstable 5’ base pairing is selected and transferred to an Argonaute (AGO) protein and the other strand is degraded [35,38,39]. The selected strand induces silencing of mRNAs through RNA Induced Silencing Complex(RISC) thus affecting various cellular functions like cell differentiation, proliferation as well as development and functional regulation of immune system [32-35,40]. In normal tissues, RISC remain as a low molecular weight entity with reduced regulatory activity while under stressed or replicating conditions these become high molecular weight units with intensified regulatory activity when bound to mRNA [36]. Thus mRNA silencing by miRNAs results in lower protein levels in the body [36,41].
ExosomalProteins: Proteins are the building blocks of life in all living organisms. These are amino acid chains linked by peptide bonds. They are exquisite necessity in every cellular events, may it be the formation of new cells or cell repair. Thus, can be an important biomarker in depicting biological changes. Emerging research have exploited this idea and conducted various proteomic studies. A more burning concept is ofexosomal proteins. The work done and data obtained shows that besides miRNAs another important exosomal load isexosomal proteins. TrairakPisitkun et al had worked on urinary biomarkers and found that urinary exosomal proteins can also be an efficient protein biomarker in reporting renal tubulopathies and other renal disorders [42]. Exosomes normally found in urine accounts for around 3% of the total urinary protein contents and isolation of these exosomes can result in very large enrichment of urinary proteins derived from renal tubular epithelial cells [42]. The exosomal packaging occurs when the apical membrane proteins undergo endocytosis and packaged into MVBs. These MVBs undergo encapsulation of cytosolic proteins into small vesicles. Finally outer membrane of MVBs fuse with apical plasma membrane releasing exosomes containing both membrane and cytosolic proteins [42]. The proteomics study with LC-MS/MS coupled with upstream one dimensional SDS-PAGE separation experiments had disclosed a number of proteins associated with exosome biogenesis like class E vacuolar protein sorting (VPS), ALIX, Aquaporin 1, Aquaporin 2, ESCRT, etc [43]. A total of 295 proteins of urinary exosomeswere found to be associated with renal diseases and hypertension. These have been enlisted in Urinary Exosome Protein Database [42]. In another experiment where polypeptides were considered reflect that β2- microglobulin could be an indicator of damage of renal proximal tubule cells [42,44]. The techniques used to evaluate exosomal protein change is carried out by two dimensional difference in gel electrophoresis and change proteins are identified by mass spectroscopy and validated by Western Blotting [45]. Zhou et al worked with Fetuin-A, a protein of liver as an important exosomal protein that can indicate occurrence of AKI(Acute Kidney Injury) [45].
Go to
Early Molecular Biomarkers for Renal allograft status
Years of research with renal allograft injury for either Acute Kidney Injury (AKI) or Chronic Kidney Disease (CKD) suggest that instead of invasive detection of allograft status there are scopes for early and non-invasive detection of injury through molecular markers. The studies made at the molecular level have disclosed the fact that acute and chronic rejections to a transplanted graft at preliminary stage can be ascertained by alteration in levels as well as expressions of various molecular markers involved in signaling of graft injury. These can be measured from blood/urine samples of patients. In acute rejection the early pathological change is defined by Ischemia-Reperfusion Injury (IRI) where altered expression of various miRNAs [46] is observed 3-7 days post-injury [47]. At later stage when rejection is in progress changes in levels of miR-210,-10a and -10b as well as some proteins (like perforin, granzyme A andB mRNA, FAS Ligand, FOXP3, etc) are observed [48]. Chronic rejection in early graft injury is generally associated with Interstitial Fibrosis and Tubular Atrophy (IF/TA). Pathophysiology of IF/ TA is the deposition of Extracellular matrix (ECM) proteins and Epithelial-Mesenchymal Transition (EMT) which can be stimulated by Transforming Growth Factor beta (TGF-β)/Smad signaling cascades. Ample of literature suggest that TGF-β/ Smad signaling can cause up-regulation and down-regulation of various miRNAs (miR-21,-192 & miR-29 and -200 families under IF/TA conditions) [49,50]. Even though these biomarkers have provided fruitful information but they lack specificity and their cellular source is unknown since they circulate. So to get a much clearer picture of a particular injured cell research at molecular level have unrevealed the next generation biomarker –exosomalmiRNAs for early, specific and non-invasive detection. Moreover their cellular source is also defined so they can deliver exact status of a particular cell [1,8].
Go to
Urinary Exosomal proteins and miRNAs in renal allograft injury as Next Gen Molecular Biomarkers
Studies done with renal diseases is pretty less and still a burning area of research that reveals the fact that urinary exosomal proteins as well as miRNAs can be a potential therapeutic tool for kidney and associated diseases [1,8].
The urinary exosomal proteins can be easily attainable by noninvasive means for diagnosis of ESRD as well as Urinary Tract Infection (UTI) [1]. In 2006 Zhou et al. reported that urinary exosomal protein- fetuin A was found to be increased in AKI (Acute Kidney Injury) patients in ICU than AKI patients in normal care [1,41,45]. In 2008, same group discovered that activating transcription factor-3 (ATF-3) was found in exosomes isolated from AKI patients than CKD patients or control [41,45,51]. Thus suggesting urinary exosomal proteins could be a diagnostic tool. Moreover, a reduced level of urinary exosomal aquaporin-1 has been observed in ischemia-reperfusion injury in rats [7]. ExosomalmiRNAs demonstrate potential diagnostic biomarker for renal fibrosis [8]. MiR-29c and CD2APmRNA [52,53] were observed in urinary exosomes of renal fibrosis patients. The findings by Stefano Gatti1 et al. showed that bone marrow derived Mesenchymal Stem Cells (MSC) Microvesicles (MV) when administered immediately after IR injury can prevent AKI and CKD in rats [8,54] through their paracrine actions. Tara K Sigdel et al have described that in AKI patients with perturbation exosomal proteins like CLCA1, PROS1, KIAA0753 were observed. In addition to that exosomal ApoM is more than soluble ApoM [55]. M.W. Welker group found that in patients with chronic Hepatitis C serum soluble exosomal CD 81, a surface protein marker is elevated [56]..
Go to
Future Prospective and limitations
Lots of work have been done with circulating miRNAs but due to their less specificity with the exact status of injured tissues and accuracy in determining role of a miRNA and its cellular source, still more feasible molecular markers have been searched and scientists have found that the circulating vehicles of cells-circulating exosomes that carry respective cellular cargo to the target sites to conduct cell-to-cell communication can be an option. These can be more proficient in delivering the most specific information on the status of any cell, may it is normal or injured cells. The molecular composition of exosomes that has been found till date is being recorded in the ExoCarta database. By exploiting these data in different pathological diseases scientists have done lots of research with carcinomas. In renal diseases also these exosomal miRNAs are being used to find out a means for noninvasive early detection of graft rejection. The conclusion drawn from these studies that proteins like fetuin-A and activating transcription factor-3 (ATF-3) can be used as marker in acute kidney disease and miR-29c and CD2AP mRNA are identified from urinary exosomes in renal fibrosis patients.
Thus, the various convergent studies made in the field of transplantation have led to the discovery of potential therapeutic targets- non-invasive urinary exosomal miRNAs and proteins which can be used to investigate and confirm the injury of transplanted allograft at an early stage. Though the data obtained define exosomes as an appropriate marker when compared with mRNAs, still it has few limitations:
Diverse isolation procedures that can affect exosomal contents,
Exosomes containing large number of miRNAs that affect the signaling of the cell together but not itself alone and
TDifficultly in measuring the exact quantity of a particular miRNAs in a exosome when miRNA is in low concentration.
Go to
Conclusion
The exosome cell-to-cell communication mechanisms’ experiments are still at its infant stage. There is the need for development of more sophisticated techniques to detect the exact amount of specific functional exosomal proteins and miRNAs and their proper signaling pathways. Thus more investigation are still required to exploit exosomes in clinical fields as therapeutic targets.
#cell science#molecular biology#Stem Cells#cell biology#Journal of Cell Science#open access journals#Juniper Publishers
0 notes
Text
Is US Patent Policy Strong Enough to Withstand the Winds of Change: A Study of the Need to Change United States Patent Policy

Author by Kent R Acheson
Abstract
The purpose of this case study was to learn how US patent policy requirements differ for the Software and Pharmaceutical Industries, specifically if United States Patent Policy adequately protects intellectual property rights [1] for two divergent industries while still encouraging research and development (R & D) investment sufficient to increase profits and innovation. Data for this study consisted of 38 witness testimonies delivered to US Congress between the years 2005 and 2010 by experts representing the two industries of interest: pharmaceutical and software. Key findings from the data analysis of these 38 testimonies revealed both within industry differences and between industry differences in patent law protection. Within industry differences showed variance based on size of the company and the degree to which they relied on their own R & D. Between industry differences reflected divergent ‘products’ with Pharmaceutical Industries needing long-term protection to recover R & D expenditures that include expenses for human trials research to proceed from patent application to market. Software industry, on the other hand, uses follow-on innovation of others to continue technological advancement by constantly improving upon existing software. The data show that these two industries use patent policy protection in different ways for different reasons. This information will enable Policymakers to develop another form of product protection in lieu of the current patent law to better meet the needs of these two industries rather than try to modify the existing law.
Introduction
Patent law was developed in parts, building on one another with a single purpose in mind of protecting all innovations in a society and this created the basis for patent laws imposed on the current and future generations. Bessen [2,3] stressed that patents may not be valuable in protecting innovation [4-6] but are used solely to diffuse new ideas in the public. Bessen and Maskin [7] had previously highlighted that little research and development (R&D) in the Software Industry is used to gain patent protections and the enforcement issue with patents is difficult, as many patents are issued for products that are not new. Levin [8] and others found much earlier that patents were rated weak at protecting the returns on innovation, far behind the protection gained through lead time and learning curve advantages.
Patent’s role in different industries
The purpose of this qualitative case study was to explore the different requirements for patent policy for the Software and Pharmaceutical Industries. All transcripts from testimonies from the spokespersons representing the two industries introduced to either House between the years 2005 to 2010 concerning the U.S. Patent Reform Bills were collected and analyzed to answer the research question in this case study. The findings could be useful in further adjusting patent policy to encourage innovation for diverse industries, or suggest the creation of another form of idea protection.
A similar problem may be in the type of intellectual property protection that a company chooses to obtain to avoid the constraints of getting a patent and extend the time frame for protection, such as copyright protection that extends protection from the 20 years for a patent to 120 years. Apple Inc. obtained a copyright protection for their popular iPhone [9], which recently lost in a suit against the Federal Government. The landmark decision helps to control copyright creep. Initially when buying an iPhone, Apple Inc. limited the service provider to AT&T and applications had to be bought from the Official Apple Store. Now, however, through a hack on the iPhone, users can choose a different service provider and load other, unofficial, applications not supported by Apple Inc., and hackers are not in violation of Copyright Law.
Policy Makers can use the findings of this study to explore new directions for the United States Patent Policy to optimize advancement of technology in the Software and Pharmaceutical Industries. Historically in the United States, there has been one patent policy. Scholars, academicians, and the United States Government still do not know the ideal amount of IPRs mainly because the objective has been to uphold one uniform policy. This study clarified if further changes were needed for patent policy through a Patent Reform Act, which enables Policy Makers to understand the needs of the Software Industry, or design another form of protection designed specifically for the Software Industry.
Crowe [10] and others stated that a case study design is most appropriate when little is known of a phenomenon in its natural context. A case study is “used to generate an in-depth, multifaceted understanding of a complex issue in its real-life context” (p. 1). The Pharmaceutical Industry has a profitable track record using the existing Patent Law to protect their R&D investments. The Software Industry is comparatively new and therefore their issues are only just now becoming obvious. Case law is outside the boundaries of this study.
The multiple dimensions of the phenomenon of the nature of protecting intellectual property rights in the Software Industry property and the Pharmaceutical Industry are worthy of study to allow all voices to be heard, including large corporations from both software and pharmaceutical companies, generic drug companies, and smaller software startups. After carefully examining all relevant transcripts, these diverse opinions can be given venue to state their needs.
Methodology and main results
The research question addressed in this study was: How do the patent policy requirements differ for the Software and Pharmaceutical Industries? From the Software and Pharmaceutical Industries’ objectives and needs for the United States Patent Policy to address, the questions spotlighted the sufficiency and effectiveness of the United States Patent Policy.
The focus of this study has two parts, they are:
1. What is the evidence United States Patent Policy adequately protects Intellectual Property Rights (IPRs) for both the Software and Pharmaceutical Industries?
2. How does the United States Patent System encourage companies to make R&D investment in the Software and the Pharmaceutical Industry?
The first research question dealt with the effectiveness of the United States Patent Policy in protecting IPRs in two industries: software and pharmaceutical. The second research question related to how companies invest in R&D with support of the United States Patent Policy. The study explored the ability of the United States Patent Policy to foster innovation with satisfactory IPR protection to encourage R&D spending focusing on two specific industries. The Software Industry experiences a sequential and complementary nature of innovations, building on previous discoveries; and may not use the patent policy in effect in the United States. If patent policy does not consider the different requirements within the Pharmaceutical Industry and is too lax then enough R&D spending will not be invested and technological advancements, including new medications, may come to the market slower or not at all.
The scope of the study is to understand how the Software and Pharmaceutical Industries use the patent system and how better to adjust the patent system to optimize technological advancement. As discussed in assumptions, because of the nature of the source of data and the possible bias that was not fully known, the assumptions may or may not have had a credible or dependable basis and may therefore have biased the findings. Qualitative designs such as the case study have inherent limitations that may threaten validity, they may lack rigor and they may not be generalizable. These limitations may be mitigated with transparency in data analysis and reporting. Crowe 5 and others explains on page 8 “seeking potential, alternative explanations, and being explicit about how interpretations and conclusions were reached, helped readers to judge the trustworthiness of the case study report.
Evidence from various sources highlight the United States Patent system does not work as intended and needs a solution to continue or increase innovative activity. The principal problem deals with innovative activity that is sequential in nature and innovative activity that involves much R&D investment to bring a product to market. Sequential inventions build on previous breakthroughs and do not require much R&D investment. Secrecy would hinder follow-on discoveries of sequential innovative products.
This study used a content analysis of witness [11] testimonies to Congress on the Software and Pharmaceutical Industries from the years 2005 to 2010, and the possibility to develop more than one patent policy to accommodate different sectors of the economy. The study concentrated on software and pharmaceutical companies, as these two industries are most at odds with each other, and have prevented the passage of the Patent Reform Act of 2005 through 2010. The Patent Reform Act of 2010 [12,13] is the result of non-passage of the 2009 Act, as was each successive year from 2005. The stance of the Software and Pharmaceutical Industries remained relatively unchanged in their requirements, but the patent reform acts changed to incorporate the majority opinion of industry. The most important recommendations of the Federal Trade Commission (FTC 11) and National Academies of Sciences (NAS) studies that were first introduced in 2005 by Senator [14] Lamar Smith were considered.
The purpose of this descriptive analysis was to examine the current United States Patent Policy and the proposed changes to United States Patent Policy, and answer the research question – How do the patent policy requirements differ for the Software and Pharmaceutical Industries? This study will help decide if the Software and Pharmaceutical Industries effectively use the U.S. Patent Policy through protecting Intellectual Property Rights (IPRs) and encouraged investment research and development (R&D). The qualitative case study was the most suitable approach to study the issues and answer the research questions because it explored real-life experiences of industries looking to patent Intellectual Property (IP).
Data and Sample Statistics
Data were collected and analysis began using the Content Analysis Guide developed for this study. The testimonies of the BSA representatives, other computer software witnesses, Computing Technology Industry Association, PhRMA representatives, other generic pharmaceutical representatives, and the Generic Pharmaceutical Association, Biotechnology Industry Association (BIO), Intellectual Property Owners Association (IPO) [15-18], and venture capital organizations were included in this study. The IPO was included because IPO members represent 30% of patent applications at the USPTO and include members from the Software and Pharmaceutical Industries, among others. The study included Venture capitalists because some members of BSA [19] and other smaller software companies began with venture capital dollars. Each data point was examined for inclusion of any reference to R&D, including duration and support for R&D, the need for patent protections [20,21], and future needs for patent policy.
The 38 documents submitted to the congressional hearings were analyzed. Documents relating to software and pharmaceutical companies reviewed were not ambiguous but very clear and straight forward following a consistent format, so that anyone conducting another study would reach the same conclusions. They all stated who authored the document, who the document represented, who presented opinion to Congress, their position on the patent reform act, and agreements and disagreements with specific points of the patent reform act. No ambiguity existed and no information required subjective judgments to interpret the information reported. The nature of the data supported the reliability of the findings.

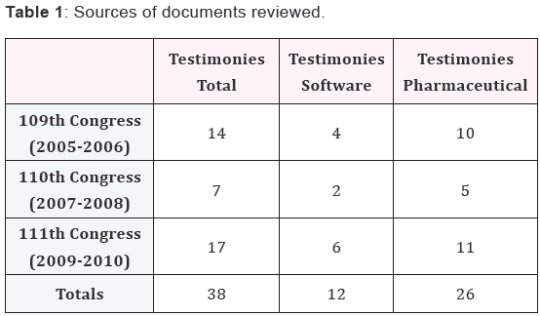

Cisco, Hewlett-Packard, and other big high-tech companies began pushing for reform legislation to limit the number of patent infringement lawsuits and therefore the amounts paid in damages. The United States Patent and Trademark Office’s (USPTO) proceedings’ transcript from the public hearings showed the patent policy needs for BSA’s principle member and founder Microsoft. The public hearing titled Use of the Patent System to Protect Software Related Inventions took place in 1994 at the San Jose Convention Center, California, and at the Crystal Forum in Arlington, Virginia. A brief summary of Microsoft’s speech follows. Microsoft (BSA) recommended that patent protection allow an accused infringer to identify readily the activity forbidden under the claim. The success of a particular claim in meeting these objectives may depend less on the form and more on claim substance and the supporting details.
BSA represents a large base of computer software and hardware companies in the United States. Phelps (2005) from Microsoft Corporation stated that BSA does not want the patent holder to have automatically injunctive relief. Injunctive relief occurs when the courts rule an infringement occurred and automatically issue a ruling to stop the infringer from continuing operations. From the congressional hearing in 2005 on harmonization and other matters, Phelps for BSA supports publication in 18 months. Phelps [39] expressed support for establishing a post grant opposition procedure and supported third-party opportunity to alert USPTO to questionable patents during review. Phelps also supported allowing third parties the opportunity to suggest relevant prior art to examiner during review, supported a limit on damages for willful infringement to include only egregious behavior, and supported limiting damages to only the contributing, patented piece of the invention and not the market value of the whole product, as it is now.
In a congressional hearing in 2005, Simon [40] from Intel , a BSA representative, stated the patent system is difficult to maneuver because of many pieces that comprise computers and software contain “potentially hundreds of patents [that] may be relevant to a particular computer or software technology” [40]. The primary way to challenge a patent under current law is through costly litigation. Intel suggests Congress create a balanced post grant opposition enabling third parties to challenge issued patents that includes a post grant opposition of 2 years from patent grant or 1 year from receiving notice of patent infringement. Simon also encouraged Congress to create a second window to make the post grant review meaningful. Simon suggested a limit on patent application continuations and for the court not to issue a continuation on any claim broader than the broadest claim previously published or issued. BSA suggested a stay on the lower court’s decision in interlocutory appeals before final determination by the Federal Circuit Court of Appeals. Micron Technology, Inc., a non-BSA member, suggested the same patent law reforms as BSA.
In a congressional hearing in 2006, Chandler [41] of Cisco (BSA) suggested a second window triggered by receipt of an infringement complaint. During the first window, the patent issues with thousands or millions of parts making the effectiveness of the patent examination questionable. Chandler (2006) encouraged Congress to make changes to remove venue shopping, and prevent suits from worldwide damages in United States Courts like the Microsoft and AT&T case. The only patent policy need described on the BSA website dated 1994 had no updates, which is understandable because United States Patent Policy has not changed significantly for more than 50 years and the proposed changes have not made it into law. The agreement with the Patent Reform Act was from the most influential voice for the Software Industry; nevertheless, there were disagreements within the Software Industry mainly arising from smaller companies and individual inventors. Software companies wanted patent reform by Congress but differences remained among large software companies and smaller organizations. An overhaul of the patent system and other measures to promote tech development efforts are top priorities of the Business Software Alliance, Cisco, Hewlett-Packard, and other big high-tech companies . BSA members began pushing for reform legislation to limit the number of patent infringement lawsuits, and therefore, the amounts paid in damages.
In an article in PC World dated March 9, 2008, patent reform leads a list of five legislative priorities expressed by BSA in 2008. The opinion article stated that BSA members want Congress to approve the Patent Reform Act but the legislation stalled in the United States Senate because of objections from inventors, pharmaceutical companies and some small tech (computer software) firms. In addition the article proclaimed, more than 170 California businesses and organizations oppose the Patent Reform Act in its current form. They mention that research to stay competitive is both expensive and risky, but strong protections from patent policy attract the necessary investments to commercialize a new product. This is especially the case for the hundreds of smaller, venture capital-backed firms in the state, of which many spun from California’s world-class research universities and private research institutes. According to GlaxoSmithKline, California Wireless and Mi5 Networks in paragraph eight on page one of Gross [42] (2008), the Patent Reform Act “would increase costs to obtain and maintain patents, undermine patent certainty, incentivize infringement, and weaken the enforceability of patent rights and intellectual property protections.”
Dr. Myhrovold [43-45] started Dynamical Systems, a software company, in 1984 that Microsoft bought in 1986. He worked with Microsoft from 1986 to 2000 (14 years). Myhrovold retired from Microsoft in 2000 to start another company, Intellectual Ventures, which files more than 300 patents a year making it the 25th largest inventing organization in America. Dr. Myhrovold stated “[Software is] a complex topic…and it’s all about company culture and how companies use patents” (Perspectives on Patents [46,47]. Continuing Dr. Myhrovold stated “…for most tech companies patents have never been important; they have never been a way to make money” (p. 76, para. 2), and “…patents are, at best, a distraction and most tech companies have made a deliberate decision to ignore the patent system” (p. 76, para. 5). Many other non-BSA members agreed with Myhrovold.
Defensive patenting by software companies explains if a company holds enough patents then this company can steal another product company’s ideas with impunity, but the problem enters when the other entity does not create a product to attack (Myhrovold, 2006, p. 77, para 3). These are the battle lines in the patent reform debate with universities, small inventors and pharmaceutical companies whose lifeblood is the patent system on one side, and companies who decide to infringe or at least do not care about infringing on the other side. Dr. Myhrovold is a witness from the vantage point of a Microsoft senior executive in the 1990s who discussed this role with other firms in the earlier rounds of patent reform debate.
Technology companies exaggerate the problem when over the last 20 years patents have remained in last place of lawsuits for the three forms of idea protection: trademark, copyright, and patents. A study of four high-tech companies that are active in the patent reform debate paid out $3.7 billion in patent lawsuit settlement from 1993 to 2005, but those same four companies earned $1.4 trillion in revenue over the same period making the sums for infringement only 0.26% of revenues on average. The company with the highest number of lawsuits experienced sums for infringement at only 0.51% of revenues. “Patent trolls” are companies that do not market a product but only the idea for a product. Companies that do not produce a product comprise only 2% of the patent infringement lawsuits. Software companies like to blame an innocuous group of patent troll companies when they themselves perform the same litigious practices blamed on trolls. Myhrovold stated the need to embrace the trend to make the alternate resolutions more like a court trial by creating a separate Patent Court, much like the Tax Court, Bankruptcy Court, or Divorce Court to try only specific cases.
Inter Digital is a technology and software company that disagrees with BSA’s proposed changes to patent law. Inter Digital’s Bernstein summarized the differences in the Software industry on page 220 last paragraph at the 2007 congressional hearings: “…the IT industry is absolutely not united in its support for mandatory apportionment, post grant opposition, expansive USPTO rulemaking authority, and interlocutory appeals fall outside the realm of patent ‘reform’.” Bernstein continues by expressing how such an action would degrade patent rights and increase litigation for smaller innovators. The weakening of legitimate patents would protect a few corporate giants and increase the number of lawsuits Bernstein (2007), [48,49].
An article by Mc Dougall [50] and Chabrow (2006), [51,52] in InformationWeek explains the problems as they perceive them with the Patent Reform Act from other software and computer companies. Hans Hxu, founder of online gift registry Felicite.com, says the industry’s large players want the appearance of IP openness but do not practice it. “IBM patents almost everything they do, and then they sit on it, which does not encourage innovation” (Microsoft Agenda, para. 3) says Hxu, a McKinsey consultant although other critics suggest the sellers’ moves cement their advantages when they face rising [53] competition from startups. In an August 2005 essay, Harvard Law School professor and tech entrepreneur James Moore argued the collaborative patent review proposed by IBM, Microsoft, and others would result in fewer patents issued because it would give examiners more ammunition to shoot down patent applications. “If fewer patents are issued, but existing patents are not revoked, IBM and Microsoft win because they already possess vast existing portfolios,” Moore writes (Microsoft Agenda, para. 4). Some Web 2.0 companies dismiss IBM’s argument that business-method patents protect obvious ideas. “Everything is obvious after someone has done it,” says a spokesperson for online movie renter Netflix (Microsoft Agenda, para. 5), which has patents on its queue-ordering system--and is suing Blockbuster for allegedly copying the system.
Small tech companies are taking matters into their own hands, forming patent cooperatives through which they share IPRs. Search company Wink shares in Creative Commons, a group that encourages sharing of copyrights and open source licenses, but there is a line between sharing and protecting intellectual property that creates competitive advantage, says Wink’s Chief Executive Officer (CEO) Michael [54,55] Tanne. “When companies have invested in the development of technologies, they really ought to be able to protect it,” Tanne says (Microsoft Agenda, para. 6). Resolving these issues will influence developing and commercializing tech innovations. Too many lengthy and expensive legal battles will persuade IT departments to stick with familiar technology, and this is something tech vendors should consider as they take one another to court.
The largest and best known pharmaceutical companies in the Pharmaceutical Industry represented by Pharmaceuticals Researchers and Manufacturers of America (PhRMA), Biotechnology Industry Organization (BIO), and the Professional Inventors Alliance disagree with the weakening of patent protection and the long, time frame proposed for patent reexamination. High R&D characterizes these industries and the Pharmaceutical Industry realizes a shortened patent protection because patent protection begins before FDA approval. This shortens patent protection to commercialize the product to the remaining years.
On September 17, 2007, The Professional Inventors Alliance expressed through a letter to President Bush the flaws in the Patent Reform Act of 2007. The Patent Reform Act of 2007 did not pass the United States Senate because of the opposition from PhRMA, small inventors, and small tech firms . The letter from the Professional Inventors Alliance expressed that if the Patent Reform Act of 2007 passed into law it would harm the United States’ innovative character because of the inability to enforce patents and would reduce the royalties associated with a patented technology. In 1980, PHRMA’s members invested $2 billion in R&D for new medicines; although, nearly 30 years later (in 2009), PHRMA’s members invested $50.3 billion in R&D out of the $65.2 billion industry-wide total. Pharmaceutical companies rely on government-granted patents to protect their substantial investments in researching and developing new drugs. It takes 10-15 years and costs $800 million on average to bring a new medicine to market. The Pharmaceutical Research and Manufacturers of America (PhRMA) represents the country’s leading pharmaceutical research and biotechnology companies.
Without patents to protect all the inventions necessary to develop a drug for a limited time, others could simply copy the drugs immediately, offering their versions at a reduced price because they did not incur the high costs to develop the drug. This would seriously affect the pharmaceutical companies’ ability to recoup their costs and reinvest in other research projects. PhRMA stated in 2010 that “a strong patent system is crucial to our economic [56,57] competitiveness, especially in these economically trying times” (PhRMA’s website, 2001, p. 1). The companies in favor and against the Patent Reform Act of 2010 divided into the companies that have favored and opposed the previous patent reform acts, that is, computer software favoring patent reform and pharmaceutical companies and biotechnology companies opposing patent reform. Those opposing and in favor of the patent reform acts through the six years in this study have not changed their needs but, instead, Congress changed trying to create a patent policy agreeable to most patent users.
The large pharmaceutical companies also known as the name brand pharmaceutical companies and the smaller, generic pharmaceutical companies were in general agreement on most issues. Both wanted strong patent protection and both sides were against the Patent Reform Bill [58] of 2005 and 2006 as stated in the congressional hearings on patent reform. The firstinventor- to-file patent system while harmonizing with the large United States trading partners also poses some difficulties and disagreements with United States patentees. The problems lay in the grace period of 1-year and the best mode requirement in the patent application. Harmonizing with other countries’ patent systems as currently written, such as Japan and Europe, would remove the United States grace period of 1 year to file a patent application and would remove the best mode requirement when filing a patent application. The best mode requirement is the descriptive part of the patent application the inventor has to include the inventor’s idea of how best to use or combine the chemicals for complete effectiveness.
The differences between the brand name and generic pharmaceutical companies lay in eliminating the best mode factor of the patent application and the inequitable conduct defense. Brand name pharmaceutical companies say the best mode provision of the patent law is subjective, and therefore should be removed. The generic pharmaceutical companies believe the best mode provision should remain because they cannot copy the patented medication without the recipe or the “best mode” of making the drug. By removing the inequitable conduct defense, brand name pharmaceutical companies will misuse the patent system to the harm of the public and generic pharmaceutical companies. Differences exist between the brand name pharmaceuticals and the generic pharmaceuticals. One example is the issue of patent quality: Best mode. Generic pharmaceuticals want to keep the “best mode” in the patent law language because it lowers cost of medications by allowing generic companies to copy name brand drugs more easily. Ely Lilly [59,60] and PhRMA want to remove the best mode language . The Generic Pharmaceutical Association also has qualms with weakening the inequitable conduct saying that weakening this provision gives brand-name pharmaceutical companies incentive to misrepresent their inventions.
The differences between the brand name and generic pharmaceutical companies lay in eliminating the best mode factor of the patent application and the inequitable conduct defense. Brand name pharmaceutical companies say the best mode provision of the patent law is subjective, and therefore should be removed. The generic pharmaceutical companies believe the best mode provision should remain because they cannot copy the patented medication without the recipe or the “best mode” of making the drug. By removing the inequitable conduct defense, brand name pharmaceutical companies will misuse the patent system to the harm of the public and generic pharmaceutical companies. Differences exist between the brand name pharmaceuticals and the generic pharmaceuticals. One example is the issue of patent quality: Best mode. Generic pharmaceuticals want to keep the “best mode” in the patent law language because it lowers cost of medications by allowing generic companies to copy name brand drugs more easily. Ely Lilly [59,60] and PhRMA want to remove the best mode language . The Generic Pharmaceutical Association also has qualms with weakening the inequitable conduct saying that weakening this provision gives brand-name pharmaceutical companies incentive to misrepresent their inventions.
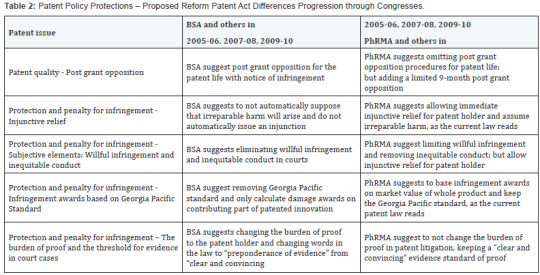
Together the Case Lawre presented the most comprehensive line of court-led patent reforms, which makes patent reform substantially different in 2010 than 2005. Patent lawyers and the law association, AIPLA [63,64], believe that legislation is not necessary and the court system will eventually find a solution for compromise for the different users of the patent system and will define patent law through successive Case Law. Larger, more market capitalized firms make more noise and are heard more clearly than smaller, less capitalized companies or individual inventors, including companies that specialize in innovation but do not concurrently produce a product, also known as patent trolls. More innovation comes from smaller firms and individual inventors than large entities. The larger software enterprises that often infringe on patents held by companies that do not produce a product (patent trolls) behave similarly to the patent trolls. IBM and Microsoft sit on patents without an accompanying product, when another company discovers something similar the patent surprises the unsuspecting company, and a licensing or royalty agreement can avoid costly litigation. IBM earned over a billion dollars in 2005 solely from license agreements and royalties. Licensing and royalty agreements are another possible direction that companies take to avoid patent infringement suits; however, their use threatens other companies to ransom licensing or royalty agreements but is cheaper and the outcome more certain than litigation.
The Pharmaceutical Industry appreciates the current patent policy and is leery of any changes that would disrupt the current manner in which they use the patent system to optimize patent protection; also the Pharmaceutical Industry like the Software Industry makes the best of the current patent policy . Although pharmaceutical firms have to wait until after drug trials and resulting FDA approval to market the medication, which includes the 20-year patent term and drug approval sometimes lasts as much as 10 years, they too have found ways to evade current patent law to extend the patent length. The Pharmaceutical Industry commonly increases the shortened patent length by adding a known chemical to the patent protected drug therapy, and adds another patent protection term of 20 years by increasing the number of patents on a drug. One specific drug therapy created by a name-brand pharmaceutical firm that a generic company was exploring to copy had patent protection by more than 200 patents spanning 40 years.
Discussion and Conclusions
The specific research questions that framed this qualitative case study were 1. What is the evidence United States Patent Policy adequately protects Intellectual Property Rights [65] (IPRs) for both the Software and Pharmaceutical Industries? 2. How does the United States Patent Policy encourage companies to make research and development (R&D) investment in both the Software Industry and in the Pharmaceutical Industry? Based on the differences on how patent policy should read, issues of effectiveness of the United States Patent Policy to both protect and encourage IPRs and R&D investment should be considered. Patent policy in the United States has remained unchanged for the last 55 years, and has been effective in protecting IPRs and encouraging R&D investment. Pharmaceutical firms have been around many years and have flourished in the current patent policy environment. Only with the creation of the personal computer have software companies entered the scene and have expressed concern for the patent policy changes to reduce the software company’s purposeful infringement. In a few words, the large software companies want to weaken patent protections and reduce their costs to defend against patent infringement lawsuits because big software companies do not care about patents or patent infringement.
Three important findings from this study are
1. The Pharmaceutical and Software Industries use patent policy differently
2. BSA explicitly states they want a strong patent policy, but, in effect, want to weaken the current patent policy, and
3. Differences exist within each industry. Congress has attempted to improve patent law 6 years without success because there is not agreement pleasing all industries, but the principle differences embodied the Software and Pharmaceutical Industries.
Firstly, pharmacy and software use patent policy differently: Pharmacy to protect R&D and Software for defensive purposes. Software Industry (BSA) does not use the patent policy as designed to protect R&D, but to defend against the threat of patent infringement lawsuits. The testimonies to Congress provided evidence to answer my research question of how the patent policy requirements differ between the Software and Pharmaceutical Industries. The testimonies to Congress were clear and straightforward. I did not have to infer the meaning or needs of the witnesses. They clearly stated their position and what they wanted in patent policy. Many people in the Pharmaceutical Industry and smaller software companies specifically stated that larger software and computer companies began calling for patent reform to limit the many patent infringement suits against them. Myhrovold shared his experience working for Microsoft in the late 90s stating that large software companies are not concerned with infringing on another’s patents and the only reason they care at all about patents is to defend against patent infringement lawsuits.
Secondly, the data from congressional testimonies clearly showed that the Software Industry (BSA) verbalized they want a strong patent policy but, instead, they want to weaken the rights of patent holders. This weakening is from: An unlimited post patent review period, placing the burden of proof for infringement on the patent holder (instead of the offender), and limiting the damage awards for infringement to only the infringing part of an innovation. The testimonies clearly stated their position and what they wanted. The previous list clearly communicated to Congress what the Software Industry (BSA) wanted in a patent policy, and refuted by other expert testimonies in the Software Industry.
All BSA representatives stated they wanted strong patent protection, and continued with the above reasons, which amount to weakening a patent holders’ legal rights to their Intellectual Property Rights (IPRs). Many testimonies contrary to BSA stated specifically the reasons BSA wants to limit a patent holders’ IPRs is to stave off patent infringement lawsuits. Myhrovold (2006) shared that patent policy did not enter into Microsoft’s and other BSA members’ culture. Patents are not how software companies protect innovation, but, rather, secrecy, and lead time or economies of scale are more effective to protect innovation in a short product lifecycle industry. Thirdly, the entire Software Industry is not united with BSA, and the entire Pharmaceutical Industry is not united with PhRMA. Differences exist between the two industries and differences exist within each industry, such as difference between larger companies and smaller companies in Software Industry and brand name pharmaceutical versus generic pharmaceutical. Each expert clearly stated what they wanted, why they wanted it, and differences within their respective industries. The witnesses to the congressional hearings succinctly stated that the BSA or PhRMA did not represent the entire industry, and the industry was not united in its desires for patent policy. Siwik [66] said in the exact words that the Pharmaceutical Industry is not united, and based on the non-BSA members’ testimonies with them vehemently disagreeing with BSA’s stance, anyone would reach the same conclusions that BSA is far from united too.
The evidence suggests the two industries use patent policy in different ways. For instance, The Software Industry does not use the patent system to protect intellectual property but rather use the patent system for defensive purposes not so much to protect innovation but to defend against infringement lawsuits. Pharmaceutical industry relies heavily on a patent protection to recover large R&D spending. The evidence was found in examples of how each industry effectively uses the patent system. Based on research of the patent system and the evidence of how each industry uses the patent system, the data would suggest agreement with many of the pharmaceutical, biotechnology, and other industries that use the patent system effectively to protect research and development dollars that the system does not need major change. Research shows the answer to the question of how the United States Patent System encourages R&D and promotes innovation; the patent system performs well according to its design. It protects ideas. The current patent policy is effective in protecting innovation and encouraging research and development spending.
For more Open Access Journals please visit our site: Juniper Publishers For more articles, please click on Journal of Organic Medicinal Chemistry
0 notes
Text
Liquid Chromatography-Mass Spectrometry Based Isotopic Abundance Ratio Analysis of the Consciousness Energy Healing Treated L-Cysteine
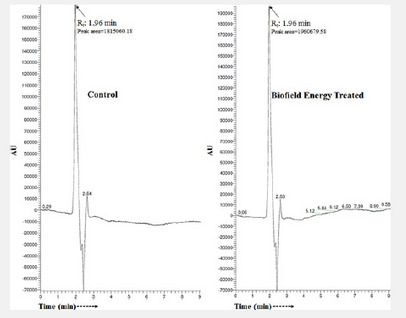
Authored by: Snehasis Jana
Abstract
L-cysteine is a semi-essential sulfur-containing amino acid found in nails, skin, hair, etc. in the body. This study was performed to investigate the impact of the Trivedi Effect® on the structural properties and the isotopic abundance ratio of L-cysteine using LC-MS analytical techniques. L-cysteine sample was divided into control and treated parts. The treated part only received the Trivedi Effect®-Consciousness Energy Healing Treatment remotely by a renowned Biofield Energy Healer, Dahryn Trivedi. The LC-MS spectra of both the control and treated samples at retention time (Rt) 1.96 minutes exhibited the mass of the molecular ion peak adduct with hydrogen ion at 122 along with low molecular fragmented mass peaks at m/z 105, 102, 87, 76, and 59 for C3H5O2S+, C3H2O2S•+, C3H5NO22+ or C3H5NS•+, C2H6NO2+, and C2H3O2+, respectively were also observed. The peak area of the treated sample (1960679.58) was significantly increased by 8.02% compared to the control sample (1815060.18). The isotopic abundance ratios of PM+1/PM (2H/1H or 13C/12C or 15N/14N or 17O/16O or 33S/32S) and PM+2/PM (34S/32S) in the treated L-cysteine was significantly increased by 41.86% and 32.39%, respectively compared with the control sample. Hence, the 13C, 2H, 15N, 17O, 33S, and 34S contributions from C3H8NO2S+ to m/z 123 and 124 in the treated L-cysteine were significantly increased compared to the control sample. The changes in peak area and isotopic abundance ratios might be the cause of changes in nuclei, possibly through the interference of neutrino particles via the Trivedi Effect®-Consciousness Energy Healing Treatment. The increased isotopic abundance ratio of the treated L-cysteine may increase the intra-atomic bond strength, increase its stability, and shelf-life. The novel Biofield Energy Treated L-cysteine might have increased the stability, solubility, bioavailability, and shelf-life compared to the control sample. The new form of treated L-cysteine would be a better and more stable precursor in the food, cosmetics, pharmaceuticals, personal-care products, additives to cigarettes (act as an expectorant), preventative or antidote for some of the negative effects of alcohol, acetaminophen overdose, clinically used ranging from baldness to psoriasis, excellent for the treatment of asthmatics by enabling them to stop theophylline and other medications, enhances the effect of topically applied silver, tin and zinc salts for preventing dental cavities. In the near future, this Biofield Energy Treated L-cysteine may play a better role in the treatment of diabetes, psychosis, cancer, and seizures.
Keywords: Biofield Energy; Consciousness Energy Healing Treatment; L-cysteine; The Trivedi Effect®; LC-MS
Introduction
Cysteine is a semi-essential sulfur-containing amino acid found in nails, skin, hair, etc. in the body. It contains a thiol group and available as a chiral molecule with dextrorotation (D) and levorotation (L) forms [1]. Cysteine is a non-essential amino acid but may be essential for new-borns, the elderly, and individuals with specific metabolic disease or malabsorption syndromes. The cysteine plenty available in egg, meat, milk, garlic, onions, red peppers, oats, broccoli, wheat germ, brussels sprout, sprouted lentils, etc. Industrially it is also prepared from animal feathers, hair, and even from chemical synthesis [1-3].
Due to its high reactivity of the sulfhydryl group of cysteine (nucleophilic in nature) has numerous biological functions, i.e., it acts, as a precursor to the antioxidant glutathione and iron-sulfur clusters, metal cofactors in enzymes, detoxification, metabolic functions, protein synthesis, collagen production, translation of messenger RNA molecules to produce polypeptides, etc. [1-6]. It is also a precursor in the food, cosmetics, pharmaceuticals, personal-care industries, additives to cigarettes (as an expectorant), preventative or antidote for some of the harmful effects of alcohol (i.e., liver damage and hangover), acetaminophen overdose, production of more wool from sheep, clinically used ranging from baldness to psoriasis, used for the treatment of asthma, enhances the effect of topically applied silver, tin and zinc salts for preventing dental cavities [1,6-9]. Many research work claiming that, in the near future, cysteine may play an important role in the treatment of diabetes, psychosis, cancer, and seizures [10]. The stability of L-cysteine is an issue in the neutral or slightly alkaline aqueous solutions, which is oxidized to cystine by air, and on decomposition, it emits very toxic fumes of sulphur oxides and nitrogen oxides [6].
The physicochemical properties of L-cysteine pay a very important role in the food, cosmetic, pharmaceutical, nutraceutical, and other industries. The Trivedi Effect®- Consciousness Energy Healing Treatment has the astonishing abilities to transform the characteristic properties of both living and non-living object(s) [11-15]. The Trivedi Effect® is a natural and only scientifically proven phenomenon in which an expert can harness this inherently intelligent energy from the “Universal Energy Field” and transmit it anywhere on the planet via the possible mediation of neutrinos [16]. An energy field generated around the body due to the continuous movement of the charged particles in the body known as “Biofield”. The object(s) received the “Energy Therapy” respond to a useful way is known as the Biofield Energy Healing Treatment. There are several Biofield based Energy Therapies that are used nowadays against various disease conditions [17-19]. Biofield Energy Healing therapy has been recognized worldwide as a Complementary and Alternative Medicine (CAM) health care approach by the National Center of Complementary and Integrative Health (NCCIH) with other therapies, medicines and practices such as Ayurvedic medicine, yoga, meditation, homeopathy, traditional Chinese herbs and medicines, naturopathy, chiropractic/osteopathic manipulation, Qi Gong, Tai Chi, aromatherapy, acupressure, acupuncture, healing touch, hypnotherapy, Reiki, cranial-sacral therapy, etc. [20]. These CAM therapies have been adopted by most of the U.S.A. population with several advantages [21]. Similarly, the Trivedi Effect®- Consciousness Energy Healing Treatment also been reported with significant impact on the properties of polymers, ceramics, metals, organic compounds, cancer cell line, microbes, improved skin health, bone health, improved agricultural crop yield, productivity, and quality, and altered the isotopic abundance ratio, improved bioavailability of pharmaceutical/ nutraceutical compounds [22- 37].
The analysis of the natural stable isotope has the importance of many applications to understand the isotope effects resulting from the alterations of the isotopic composition [38-40]. Gas chromatography–mass spectrometry (GC-MS) and liquid chromatography–mass spectrometry (LC-MS) analytical techniques are the widely used analytical techniques for the analysis of isotope ratio with sufficient precision [39]. The Trivedi Effect®-Consciousness Energy Healing Treatment could be an economical approach to alter the isotopic abundance of L-cysteine with improved physicochemical properties for the food, cosmetic, pharmaceutical/ nutraceutical, and other industries. Thus, this study was designed and evaluated the LC-MS based structural characterization and the isotopic abundance ratios in the Trivedi Effect® - Consciousness Energy Healing Treated L-cysteine compared to the control sample.
Materials and Methods
Chemicals and Reagents
The test sample L-cysteine (>98%, titration method) was purchased from Alfa Aesar, India. Other chemicals like methanol, acetonitrile, and ammonium acetate were purchased from Merck, India.
Consciousness Energy Healing Treatment Strategies
The test sample L-cysteine powder was divided into two parts. One part of the L-cysteine powder sample did not receive the Biofield Energy Treatment called the control sample. However, the other part of L-cysteine was received the Trivedi Effect®- Consciousness Energy Healing Treatment remotely under standard laboratory conditions for 3 minutes by the renowned Biofield Energy Healer, Dahryn Trivedi, USA, known as the Biofield Energy Treated L-cysteine. Further, the control sample was treated with a “sham” healer, who did not have any knowledge about the Biofield Energy Treatment. After that, both the Biofield Energy Treated and untreated L-cysteine samples were kept in sealed conditions and characterized using LC-MS analytical techniques.
Characterization
Liquid Chromatography-Mass Spectrometry (LC-MS) Analysis and Calculation of Isotopic Abundance Ratio
The liquid chromatography-mass spectrometric analysis of the L-cysteine was carried out with the help of LC-MS ThermoFisher Scientific, USA, equipped with an ion trap detector connected with a triple-stage quadrupole mass spectrometer. The column used here was a reversed phase Thermo Scientific Synchronis C18 (250mm × 4.6mm × 5micron), maintained at 25˚C. The diluent used for the sample preparation was methanol. The L-cysteine solution injection volume was 20μL and the analyte was eluted using acetonitrile (92%) + 0.1% ammonium acetate (8%) pumped at a constant flow rate of 0.8mL/min. Chromatographic separation was achieved using gradient condition and the total run time was 10 min. Peaks were monitored at 210 nm using the PDA detector. Mass spectrometric analysis was performed under ESI +ve ion mode. The total ion chromatogram, peak area% and mass spectrum of the individual peak which was appeared in LC along with the full scan were recorded.
The natural abundance of each isotope (C, H, N, O, and S) can be predicted from the comparison of the height of the isotope peak with respect to the base peak. The values of the natural isotopic abundance of the common elements are obtained from the literature [40-43]. The LC-MS based isotopic abundance ratios (PM+1/PM and PM+2/PM) for the control and Biofield Energy Treated L-cysteine (C3H8NO2S+) were calculated.
Percentage (%) change in isotopic abundance ratio = [(IARTreated–IARControl)/ IARControl)] × 100
Where IARTreated = isotopic abundance ratio in the treated sample and IARControl = isotopic abundance ratio in the control sample.
Results and Discussion
Liquid Chromatography-Mass Spectrometry (LC-MS)
The LC-SM of the L-cysteine showed a single major peak at retention time (Rt) of 1.96 minutes in both the chromatograms (Figure 1). The peak area of the Biofield Energy Treated sample (1960679.58) was significantly increased by 8.02% compared to the control sample (1815060.18). This indicated that the solubility of the Biofield Energy Treated L-cysteine might have increased compared to the control sample. The finding was supported by the published literature data [12].
The mass spectra of both the samples of the L-cysteine are shown in Figure 2. The mass spectra of both the samples at Rt of 1.96 minutes exhibited the presence of the molecular ion of L-cysteine (Figure 2) at m/z 122 (calcd for C3H8NO2S+, 122.03). Along with the molecular ion peak, low molecular fragmented mass peaks at m/z 105, 102, 87, 76, and 59 for C3H5O2S+, C3H2O2S•+, C3H5NO22+ or C3H5NS•+, C2H6NO2+, and C2H3O2+ were observed in case of both the samples (Figures 2 & 3). The experimental data were well supported by the published literature [44].
Isotopic Abundance Ratio Analysis
The L-cysteine samples showed the mass of a molecular ion at m/z 122 (calcd for C3H8NO2S+, 122.03) with 100% relative abundance in the spectra. The theoretical calculation of isotopic peak PM+1 for the protonated L-cysteine presented as below:
P (13C) = [(3 x 1.1%) × 100% (the actual size of the M+ peak)] / 100% = 3.3%
P (2H) = [(8 x 0.015%) × 100%] / 100%= 0.12%
P (15N) = [(1 x 0.4%) × 100%] / 100% = 0.4%
P (17O) = [(2 x 0.04%) × 100%] / 100% = 0.08%
P (33S) = [(1 x 0.08%) × 100%] / 100% = 0.08%
PM+1 i.e. 13C, 2H, 15N, 17O, and 33S contributions from C3H8NO2S+ to m/z 123 = 3.98%
Similarly, the theoretical calculation of PM+2 for L-cysteine was presented as below:
P (34S) = [(1 × 4.21%) × 100%] / 100% = 4.21%
PM+2, i.e. 34S contributions from C3H8NO2S+ to m/z 124 = 4.21%
The calculated isotopic abundance of PM+1 (3.98%) and PM+2 (4.21%) values was very close to the experimental values 4.3% and 4.6% (Table 1). From the above calculation, it has been found that 13C, 15N, and 34S have the major contribution to m/z 123 and 124.
The isotopic abundance ratio analysis PM, PM+1, and PM+2 for L-cysteine near m/z 122, 123, and 124, respectively of both the samples were obtained from the observed relative peak intensities of [M+], [(M+1)+], and [(M+2)+] peaks, respectively in the mass spectra (Table 1). The isotopic abundance ratio of PM+1/PM (2H/1H or 13C/12C or 15N/14N or 17O/16O or 33S/32S) and PM+2/PM (34S/32S) in Consciousness Energy Healing Treated L-cysteine was significantly increased by 41.86% and 32.39% compared to the control sample (Table 1). Thus, the 13C, 2H, 15N, 17O, 33S, and 34S contributions from C3H8NO2S+ to m/z 123 and 124 in the Biofield Energy Treated sample was significantly increased compared to the control sample.
The isotopic abundance ratios of PM+1/PM (2H/1H or 13C/12C or 15N/14N or 17O/16O or 33S/32S) and PM+2/PM (34S/32S) in the Biofield Energy Treated L-cysteine were significantly increased compared to the control sample. The changes in isotopic abundance could be due to the possible interference of neutrino particles via the Trivedi Effect®-Consciousness Energy Healing Treatment [16]. The altered isotopic composition in the molecular level of the treated L-cysteine might have altered the neutron to proton ratio in the nucleus. A neutrino is an elementary particle that interacts through the weak subatomic force and gravity. The neutrinos have the ability to interact with protons and neutrons in the nucleus, which indicated a close relationship between neutrino and the isotope formation [39,40]. The isotopic abundance ratios 2H/1H or 13C/12C or 15N/14N or 17O/16O or 33S/32S or 34S/32S would influence the atomic bond vibration of treated L-cysteine [45]. The increased isotopic abundance ratio of the treated L-cysteine may increase the intra-atomic bond strength, increase its stability, and shelf-life. The novel Biofield Energy Treated L-cysteine might have increased the stability, solubility, bioavailability, and shelf-life compared to the control sample. The novel Biofield Energy Treated L-cysteine would be more important to the food, cosmetic, pharmaceutical/ nutraceutical, and other industries compared to the control sample.
Conclusion
The Trivedi Effect®-Consciousness Energy Healing Treatment showed a significant impact on the chromatographic peak area and isotopic abundance ratio of L-cysteine. The LC-MS spectra of both the control and Biofield Energy Treated samples at Rt 1.96 minutes exhibited the mass of the molecular ion peak adduct with hydrogen ion at 122 along with low molecular fragmented mass peaks were also observed. The peak area of the Biofield Energy Treated sample was significantly increased by 8.02% compared to the control sample. The isotopic abundance ratios of PM+1/PM (2H/1H or 13C/12C or 15N/14N or 17O/16O or 33S/32S) and PM+2/PM (34S/32S) in the Biofield Energy Treated L-cysteine was significantly increased by 41.86% and 32.39%, respectively compared with the control sample. Hence, the 13C, 2H, 15N, 17O, 33S, and 34S contributions from C3H8NO2S+ to m/z 123 and 124 in the Biofield Energy Treated L-cysteine was significantly increased compared to the control sample. The changes in peak area and isotopic abundance ratios might be the cause of changes in nuclei possibly through the interference of neutrino particles via the Trivedi Effect®-Consciousness Energy Healing Treatment. The increased isotopic abundance ratio of the Biofield Energy Treated L-cysteine may increase the intra-atomic bond strength, increase its stability, and shelf-life. The novel Biofield Energy Treated L-cysteine might have increased the stability, solubility, bioavailability, and shelf-life compared to the control sample. The new form of Biofield Energy Treated L-cysteine would be a better and more stable precursor in the food, cosmetics, pharmaceuticals, personal-care products, additives to cigarettes (act as an expectorant), preventative or antidote for some of the negative effects of alcohol, acetaminophen overdose, clinically used ranging from baldness to psoriasis, excellent for the treatment of asthmatics by enabling them to stop theophylline and other medications, enhances the effect of topically applied silver, tin and zinc salts for preventing dental cavities. In the near future, this Biofield Energy Treated L-cysteine may play a better role in the treatment of diabetes, psychosis, cancer, and seizures.
To Know More About Juniper Online Journal Material Science Please click on:
https://juniperpublishers.com/jojms/index.php
For more Open Access Journals in Juniper Publishers please click on:
https://juniperpublishers.com/index.php
#Juniper Publishers#Material Science#Materials Theory#Structural Materials#Juniper publisher reviews#Juniper publisher journals
0 notes
Text
Valuation of Nutrient Utilization, Protein Requirement and Proximate Assessment of an Ecotype Tilapine ‘Wesafu’ Fingerlings Reared in Earthen Pond
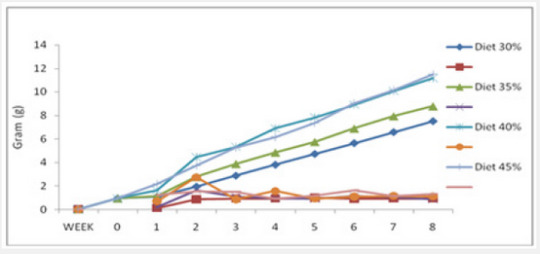
Authored by: Albert O Amosu
Abstract
This study was conducted to evaluate the nutrient utilization, protein requirement and proximate analysis of Wesafu from fry to fingerlings in an earthen pond. The experimental fish were monitored for comparative analysis and growth performance using commercial feed (Coppens® 0.2mm) and wheat flour in formulating feed with 30%, 35%, 40% and 45% crude protein levels. Fry were fed thrice daily at 8am, 12 pm and 4pm with 5% body weight for 8 weeks. Samples of experimental diet and fingerlings were analyzed for proximate composition while growth performance and nutrient utilization of diet were evaluated using growth indices such as Weight Gain (WG), Percentage Weight Gain (%WG), Specific Growth Rate (SGR), Food Conversion Ratio (FCR), Gross Feed Conversion Efficiency (GFCE), Protein Intake (PI), Protein Efficiency Ratio (PER). The results revealed that the highest cumulative weight gain (10.58 ± 0.12) was recorded in fry fed 45% crude protein diet while the lowest (6.58 ± 0.21) was observed in the 30% crude protein diet .There were no significant differences (p>0.05) in specific growth rate, food intake, food conversion ratio, gross food conversion efficiency and protein efficiency ratio while there were significant differences (DNMRT; ANOVA; df = (n-1); p < 0.05) in weight gain, protein intake. This study indicated that a diet containing 45% crude protein appear to be suitable for rearing Wesafu fry to fingerlings in earthen ponds.
Keywords: Aquaculture; Cichlids; Diet; Ecotype; Fingerlings; Growth; Nutrient; Wesafu
Abbreviations: WG: Weight Gain; FCR: Food Conversion Ratio; GFCE: Gross Feed Conversion Efficiency; PI: Protein Intake; PER: Protein Efficiency Ratio; SGR: Specific Growth Rate; LSD: Least Significance Difference; DNMRT: Duncan’s New Multiple Range Test; SE: Standard Error
Introduction
As the global population continues to rise, the need for sustainable alternative sources of protein also increases [1]. Research estimated that the worldwide requirement for food will increase up to 50 % by 2030 [2]. Juxtaposing the production input efficiencies of aquaculture versus several of fisheries and terrestrial agriculture systems shows that aquaculture is among the world’s most efficient mass producer of protein [3]. Protein is the most important constituents of fish and also the most expensive constituent of fish feed and global expenditure exceeds (7.05 million MT) €1bn per annum [4,5]. Aquaculture production is growing at a rate of nearly 9% per annum [3,6]. As wild fish stocks decline, the aquaculture industry faces a massive challenge to identify cost-effective and environmentally friendly alternatives to fish production on which it is so heavily reliant [1,7]. Cichlid aquaculture has the potential to provide a solution to this problem as it is relatively underexploited in Nigeria and can be cultured in a sustainable manner [8]. Cichlids are one of the most diverse fish species and widely cultivated fish families in the world, though their natural distribution was confined to North America, Central America, South America, Africa and the Mid East [9]. The family has been introduced into various continents including Australia [10]. Wesafu is an indigenous ecotype cichlid, very important specie of the fisheries of Lagos coastal waters in Nigeria [11-12]. The diversity of an unidentified cichlid of great abundant in Epe Lagoon commonly referred to as Wesafu and the large size cum weight it attains in the wild influence the drive for possible domestication, culture and exact identification and naming of this specie [13-14]. Several research studies have been conducted on this indigenous specie such as Age and growth, Aquaculture system, Characterization, food and feeding habits, nutrition, meristic and morphometric characters among others [11-22].
Tilapines are Cichlids with fast growth, resistant to diseases and handling, easy to reproduce and are able to tolerate a wide range of environmental conditions. They are widely cultured in tropical and subtropical regions of the world and constitute the third largest group of farmed fin fish with an annual growth of about 11.5% [3,23-25]. Proper feeding management is therefore a necessary tool for successful tilapia culture. Nutrition and feeding play important role in sustainable cichlid aquaculture therefore, feed resources as well as costs continue to dominate aquaculture needs. Feed accounts for 40-60% of the total production costs in aquaculture, with protein sources accounting for a significant proportion of this cost [1,3,22-24]. Frys and fingerlings require diets higher in protein, lipids, vitamins, minerals and lower in carbohydrate as they are developing muscles, internal organs and bones with rapid growth. Adult fish needs more calories of fats and carbohydrate for basal metabolism and a smaller percent of protein for growth [19]. The energy needs of the fish can be met by less expensive lipid and carbohydrate sources. The protein requirement of tilapia was estimated to be from 25% to 45% of diet [26,29-34]. Under natural condition, Tilapia is predominantly an herbivore and a detritus feeder. This means that they can provide high quality protein, suitable for human consumption from less protein sources [35]. Inabilities to develop suitable commercial and improved strain of tilapias that will grow to table size in good time are few of the problems militating against a viable tilapia industry in Nigeria [14]. The problem of precocious sexual maturity and unwanted reproduction has long been accepted as a major constraint to further development and expansion of tilapia culture in Nigeria. In addition, unwanted reproduction which leads to excessive recruitment (overpopulation), particularly in ponds, resulting in competition for available food and space resources as well as the ease of reproduction represents the principal problem in the optimization of yield in tilapia culture. Therefore, this research was geared towards determining the growth performance, dietary protein requirement and nutrient utilization of this economic important ecotype cichlid. The increased intensification of culture method for warm water fish such as tilapia has necessitated the provision of balance ration to satisfy the dietary requirement. Despite the commercial values of Wesafu, a tilapia highly priced fish in Lagos, Nigeria due to its tasty flesh and large size of over 1500g in the wild, little information exists on its nutritional requirements, in cultural practices yet it has culture potential in the country.
Materials and Methods
Experimental fish
One thousand four hundred and forty (1440) fry of average weight of 0.93 ± 0.16 were used in determining the protein requirement of Wesafu. The fish was raised from fry to fingerlings stage at Seg farm a private aquaculture farm in Topo village (6°25’0’’ N; 2°55’59’’ E) (Figure 1) on the West Coast of Badagry, Lagos, Nigeria. Fry were weighed and stocked in hapas. Prior to feeding trials, the experimental fish were starved for a day (24h) to ensure that their guts were emptied.
Experimental Design
Twelve (12) hapas (1 × 2 ×1.5m) were placed in earthen pond were used which was conducted in four stages:
a) Fry fed with 30% crude protein represent A in triplicate
b) Fry fed with 35%crude protein represent B in triplicate
c) Fry fed with 40% crude protein represent C in triplicate
d) Fry fed with 45% crude protein represent D in triplicate The fish were divided into one hundred and twenty (120) fry, stocked per in twelve different hapas in three replicates of 30%, 35%, 40% and 45% crude protein level and fed at 5% body weight. The 5 % the daily ratio was divided into 3 equal parts and fed at 8a.m, the second portion at 12p.m and the third portion at 4p.m. Each unit of experiment lasted for 8 weeks. Coppen 0.2mm feed was used with a protein content of 56% (Manufactured by Alltech Coppens Aqua Center, Germany) and wheat flour of 12% to formulate the diets using Pearson square method. All these hapas were placed in earthen pond in the farm and were covered with net to prevent the fish from escaping.
Determination of growth performance and nutrient utilization
Weight gain (wg)
The weight gain by fish was calculated from the differences between the final mean and the initial mean weight that is the final mean weight of fish at week eight subtracted from the initial mean weight of fish at week zero [36].
Weight gain (WG) = final weight (W2) – initial weight (W1) WG = (W2) – (W1)
Where:
W2 = Final mean body weight (g)
W1 = Initial mean body weight (g)
Percentage Weight Gain (%WG)
The percentage weight gain was calculated from the formula according to [14].
% weight gain = (X2 ) – (X1)×100 / (X1)
where:
X2 = Final mean body weight (g)
X1 = Initial mean body weight (g)
Specific Growth Rate (SGR)
Specific growth rate was calculated according to [36] as
SGR = Loge W2 – Loge W1 / T2 – T1
where:
W2 = Weight of fish at time T2 in days
W1 = Weight of fish at time T1 in days
Loge = Natural log of base e
Food Conversion Ratio (FCR)
Food conversion ratio according to[36] as FCR, expressed as the proportion of dry food fed per unit live weight gain of fish:
FCR =Weight of dry fed (g) / Live weight gain (g)
Gross Food Conversion Efficiency (GFCE)
The gross food conversion efficiency was calculated according to [36] as the percentage of the reciprocal of feed conversion ratio.
gFCR = 1×100 / FCR
Protein Intake (PI ) = Total feed intake × % protein in the diet Protein Efficiency Ratio (PER) = weight gain / Protein intake
Nutrient Evaluation of Experimental feed and fish
Samples of experimental feeds and fish were analyzed for their proximate composition according to the methods of [37].
Moisture content
The moisture content of the different fry samples were determined
% Moisture content = M1 − M2 / M1 − M0 × 100
where
M0 = Weight in g of fish and lid
M1 = Weight of g of dish, lid and sample before drying
M2 = Weight in g of dish, lid and sample after drying
M1 − M0 =Weight of sample prepared for drying
% dry matter content = 100 − % moisture content
Crude protein
Determination of crude protein was done using total kjeldahl nitrogen method.
% Nitrogen = 0.0075× A / B ×C
where
A = Mg /L reading displayed
B = g – sample digested
C = ML digest analysed
Determination of crude fat or lipid
The measure fat content of all the soluble materials present was determined according to [38].
% Fat = W3 –W2 /W1
where
W3= Weight of the cup with the extracted oil.
W2 =Weight of the empty cup
W1 =Weight of the sample.
Determination of the total ash
The percent of ash was calculated as follows:
Percentage (%) of ash = (weight of ash / weight of sample)×100 % Ash = (W2 /W1)×100
where,
W1 = Weight of sample (g)
W2 = Weight of ash (g)
Determination of crude fibre
The amount of the crude fibre content in the sample was determined using the acid/base digestion process [39].
% Crude fiber =Weight A −Weight B / Sample Weight
Where
Weight A = Weight of crucible + dried residue
Weight B = weight of Crucible + residue ashed
Statistical Analysis
All data collected were presented as mean values of each determination ± standard error (SE). Analysis of variance was performed using one way ANOVA procedure. Differences between the mean values of the treatments were determined by the least significance difference (LSD) test and the Duncan’s New Multiple Range Test (DNMRT). The significance was defined at p < 0.05.
Results
The result of the experiment shows that there was increase in the weekly growth rate, weekly feed intake, and food conversion ratio, protein intake while there was decrease in the weekly Specific Growth Rate, Gross Food Conversion Efficiency and the Protein Efficiency Ratio. It was observed that the weekly feed intake consumed increased per week in the following sequence Diet 1 > Diet 2 > Diet 3 > Diet 4 (Table 1). The weekly mean of total feed consumed showed a progressive increase throughout the experiment and there was significance (p<0.05) difference throughout the experiment. The weekly mean weight in Figure 1 shows increase trend from week one to week eight and there was significance difference (p< 0.05) between the crude protein levels throughout the experiment.
The weekly mean of total feed consumed showed a progressive increase throughout the experiment and there was significance (p<0.05) difference throughout the experiment.
No significance difference (p > 0.05) observed in weight gain for week 6 and 7 and significance difference was observed throughout the remaining weeks. Also, there was no significance difference (p > 0.05) observed between specific growth rates of the dietary protein level in week five and seven and there was significance in the rest of the week. The weekly specific growth rate decreases throughout the duration of the experiment (Figure 2).
No significance difference occurred (p > 0.05) in week 3, 6, 7 and 8 and significance difference was observed in week 1, 2, 4 and 5 (Figure 3). The food conversion ratio increases throughout the experiment. It was reveal that Gross Conversion Efficiency decreases throughout the duration of the experiment and significance difference (p < 0.05) was observed from week seven to week 8 whereas no significance difference observed from week 1 to week 6 (Figure 3).
There was significance difference (p < 0.05) throughout the experiment and the protein intake increases throughout the experiment. Significance difference (p < 0.05) was observed in the protein efficiency ratio expect for week four where there is no significance difference in the fry fed with the four experimental diet (Figure 4). No significant differences (p > 0.05) in specific growth rate, food intake, food conversion ratio, gross food conversion efficiency and protein efficiency ratio while significant difference (p < 0.05) in the weight gain, protein intake (Table 2).
Table 3 shows proximate analysis of feed Percentage crude protein had the highest mean value in each Diet 34.37 ± 0.12, 28.47 ± 0.25, 26.86 ± 0.26, 24.04 ± 0.48, the lowest value was observed in Fat content for Diet 1, Diet 2, Diet 3 and Diet 4 had 7.31± 0.12, 5.22± 0.05, 5.16 ± 0.05 and 4.81 ± 0.07 respectively. The proximate analysis of fish sample in each Diet; the percentage crude fiber had the highest mean value of 40.18 ± 4.79, 47.52±0.55, 45.76±0.08, and 43.95±0.39 and fat content has the lowest Diet of 2.91 ± 0.04, 2.69 ± 0.04, 2.19 ± 0.08 and 2.24 ± 0.09 (Table 3). The experimental earthen pond water temperature, pH, dissolved oxygen and total alkalinity ranged from 27-28.5°C, 6.8-7.5, 5.8- 6.4ppm and 120-128ppm, respectively during the entire rearing period.
Discussion
The highest cumulative weight gain was recorded in fry fed on Diet 1(45%) with 10.58 ± 0.12 while the lowest was observed in fry fed with diet 4(30%) with 6.58 ± 0.21, similar findings have been reported by different authors for different tilapia species that the dietary protein requirements of several species of tilapia have been estimated to range from 20% to 56% [33,34,40-42]. The specific growth rate decreased throughout the duration of the experiment. The highest food conversion ratio was observed in the fry feeds with Diet 2 crude protein with the value of 0.32 ± 0.57 cumulative. The other feeds 30%, 35% and 45% crude protein recorded 0.25 ± 0.04, 0.32 ± 0.57 and 0.25 ± 0.04 respectively which were similar to [43]. The highest cumulative gross food conversion efficiency was recorded in the fry fed with 532.14 ± 131.12 and the lowest gross food conversion efficiency was recorded in fry fed with 35% crude protein with the value of 412.48 ±105.57 corresponding to the observations of [41,42]. The fry fed on Diet 2 crude protein recorded the highest protein efficiency ratio and fry fed with Diet 1 crude protein diet recorded the lowest protein efficiency ratio. PER, in the present study, was significantly affected by protein levels and manifests that protein utilization was obtained at low protein level. The decrease of PER with increasing dietary protein level have also been reported by different authors for different tilapia species [44,45]. This was mainly because more dietary protein is used as energy when high protein Diets are fed to fish [30,40]. The highest cumulative protein intake was recorded in the fry fed on on Diet1, having a value of 8.75 ± 1.43, this was followed by Diet 2 with the value of 7.40 ± 1.34. Frys fed with diet 3 with the value of 5.17 ± 0.91 and this was observed to the lowest experimental Diet which was fry fed with Diet 4 which recorded 3.74 ± 0.71. The proximate analyses of sample feed fed fry of Wesafu showed that the percentage crude protein was highest in the feed with 45% having a value of 34.37 ± 0.12 and the lowest was observed in feed with 30% with value of 24.04 ± 0.48. The formulated experimental feed with 40% recorded 28.47± 0.25 while 35% recorded 26.86 ± 0.26. Fry on proximate analysis recorded better productive protein values in the 45% feed with the value of 19.99 ± 0.35, 35% feed with value of 18.26 ± 0.12 followed by 40% feed with 17.61 ± 0.08 and 30% with 17.71 ± 0.17.
Conclusion
This study clearly indicated that diet containing 45% crude protein bodes well for cichlid aquaculture industry and appear to be suitable for rearing Wesafu fry to fingerlings in earthen pond with the potential to be a successful feed and alternative replacement for coppens in tilapine feed formulation.
To Know More About Oceanography & Fisheries Open Access Journal Please click on:
https://juniperpublishers.com/ofoaj/index.php
For more Open Access Journals in Juniper Publishers please click on:
https://juniperpublishers.com/index.php
#Juniper publishers#Open access Journals#Peer review journal#Juniper publisher reviews#Juniper publisher journals
0 notes
Text
Juniper Publishers wishes Happy Easter to you and your family members

1 note
·
View note
Text
Happy Easter Day from Juniper Online Journal of Case Studies

Wishing you an egg-ceptionally wonderful Easter. Celebrate this day with peace, love, and gratitude. Have a blessed Easter. Hope your day is blooming with love and laughter.
#Juniper Publishers#juniper publishers journals#blessed Easter#Easter 2023#Easter day#easter celebration#happyeaster
0 notes
Text
The Effects of Freeze-Thaw Cycles and of Storage Time on the Stability of Proakap4 Polypeptide in Raw Sperm Samples: Implications for Semen Analysis Assessment in Breeding Activities
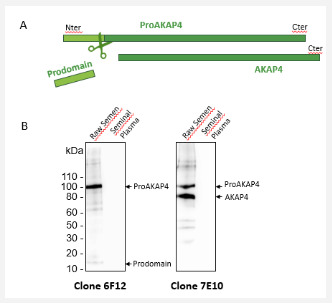
Abstract
Evaluation of the concentrations of the sperm macromolecule called proAKAP4, has been successfully introduced as a pertinent sperm parameter to assess sperm quality and high concentrations of proAKAP4 was shown to be highly correlated with sperm motility and fertility in large mammals. The sandwich ELISA kits known as Pig 4MID® Kits allowed the artificial insemination stations to monitor sperm quality more accurately with threshold values qualifying each ejaculate and animal. Introducing new methods and procedures are always challenging and sperm frozen collections have been suggested to standardize sperm assessment in daily routine. We thus have designed an experimental study to assess proAKAP4 stability and integrity in neat frozen ejaculates. Following baseline measurements, fresh ejaculates were aliquoted and stored at -20 °C for stability experiments up to 6 months and following up to 10 freeze-thawing cycles. ProAKAP4 concentrations were assayed at each time point using the Pig 4MID® Kit and western blot. Median or mean changes from baseline concentrations were evaluated statistically. We showed that the frozen storage conditions neither modified the total proAKAP4 concentrations nor changed the degradation rates of the proAKAP4 into mature AKAP4, that should in turn ensures signaling, capacitation and motility. This sperm parameter was shown then to be robust for semen quality analysis on fresh and on frozen neat semen. Taken together, proAKAP4 polypeptide can be considered as a highly stable analyte when kept frozen in raw semen up to the semen quality analysis using the Pig 4MID® Kit
Keywords: Boar; Proakap4; 4MID®; Fertility; Stability; Precursor; Freeze-thaw cycle; Storage; Semen processing
Abbrevations: AKAP4: A-kinase Anchor Protein 4; PKA: Protein Kinase A; CASA: Computer Assisted Semen Analysis
Introduction
ProAKAP4 concentrations are considered as a new sperm parameter that have been validated by field studies for sperm analysis assessment in large mammals [1-6]. Measurement of proAKAP4 concentrations was thus reported to generate pertinent information to guide the prognosis of sow fertility and prolificity in highly competitive breeding activities [1,4]. This quantitative approach of semen assessment is based on a sandwich ELISA method that allow to compare up to 87 semen simultaneously and is commercialized under the brand name of the 4MID® Kits (4BioDx, France). The Pig 4MID® Kits provide then a reliable and valuable figure reflecting the amount of proAKAP4 in pig ejaculates, with threshold values that are allowing a follow-up of the sperm quality inside and between pig breeding centers. Structurally, proAKAP4 is a precursor protein and will have to be converted by motile and alive spermatozoa in AKAP4 (A-kinase anchor protein 4) that in turn, coordinate the main transduction signals regulating sperm motility, capacitation and fertility [1,7-11]. ProAKAP4 concentrations has been reported to be correlated with total and progressive motility in stallion, in human and in bull [2,3,6,12,13]. Clearly the proAKAP4 concentrations is a reflect of the sperm motility giving a more objective figure compared to microscopic observations of the spermatozoa that are motile only at the time of analysis. In contrast, with the Pig 4MID® Kit, the more the proAKAP4 concentration is high in the ejaculate, the more the spermatozoa will be motile and efficient to go up to the site of fecundation. They have been evidences that spermatozoa with few or without proAKAP4 will be less motile or immotile and then infertile [14-18]. Therefore, we considered as essential to determine the stability and integrity of the full-length proAKAP4 in frozen storage conditions before the critical step of the sperm quality analysis. Data concerning the effects of freezing, thawing, and long-term storage effect on sperm proAKAP4 concentrations were not yet available in the literature. In this study, we aimed then to examine the analytical stability of proAKAP4 in fresh boar semen. We then assess the variations of proAKAP4 concentrations and proAKAP4 degradation rates in following freeze-thaw cycles and in long-term storage at minus 20 °C, in a final goal to improve operating procedures for semen analysis in swine breeding centers.
Materials and Methods
Sperm Preparation
Fresh boar sperm samples (Large White strain) were obtained from a boar stud and was first checked for total volume. They were then aliquoted into 1.5-mL polypropylene cryovials for the stability experiment. For stability assessment, the sampling of each ejaculate was then composed of 5 aliquots (2 for freezethaw cycle experiment and 3 for long-term storage experiment). Following baseline measurement (T0), they were all maintained frozen until analysis. The remaining boar ejaculates were either processed for the control quality experiment or for proAKAP4 expression controls. Samples stored at -20 °C were kept in a freezer equipped with a temperature recorder.
Freeze thaw Cycles and Long-term Storage Experiments
After 24 hours, 2 frozen sperm aliquots were thawed at room temperature until completely thawed, and then mixed properly with a micropipette before analysis (freeze-thaw 1). Samples were immediately re-frozen at -20 °C. This cycle was repeated for ten consecutive time points (T1, T2, T3, T4, T5, T6, T7, T8, T9, T10) to yield freeze- thaw processing. A group of 3 semen aliquots were stored at -20 °C for up to 1, 3 and 6 months, and then analyzed for stability at three-time intervals (T1M, T3M, T6M). As described below, the concentrations of proAKAP4 were assessed at each time point using the Pig 4MID® Kit (4BioDx, France). In parallel, proAKAP4 expressions and metabolism of the same aliquot were examined by western blotting. The results were compared with those obtained from the initial analysis of fresh samples. Median or mean changes from baseline (T0) concentrations were evaluated statistically.
Spermatozoa and Seminal Plasma Preparation from Boar Semen
A volume of 500μL of the remaining fresh semen was added in a 1.5mL Eppendorf tube and then centrifuged during 10 min at 2000rpm. The supernatant over the spermatozoa pellet was recovered with a 200μL micropipette and corresponded to the seminal plasma fraction. One volume of Tris Buffer (10 mM Tris HCl pH 6.8) with 2% SDS was added to the seminal plasma and sonicated at 22kHz (15 Watts) for 30 seconds. In parallel, 250μL of Tris Buffer with 2% SDS was added to the spermatozoa pellet, mix thoroughly with a vortex and then sonicated for 30 seconds (22 kHz, 15 Watts). Protein concentrations were determined using the Bradford’s method (BioRad, France). Then 50μL of the Tris-SDS sample was added to 1 volume of 2x concentrated NuPAGE LDS Sample Buffer (ThermoFisher, USA) and 10μL of NuPAGE Sample Reducing Agent (ThermoFisher, USA). Samples were vortexed and heated at 80 °C for 10 min.
Analysis of pig ProAKAP4 Expression and Metabolism by Western Blot
Equal protein concentrations of each sperm preparation were loaded on polyacrylamide gel (4-12% NuPage Precast Gels) and then transferred onto 0.45μm nitrocellulose membranes (G&E Healthcare, USA) using the Liquid Transfer System (Life Technologies, USA). Membranes were incubated overnight at 4 °C with the first antibody at a dilution of 1:4000 in 25 mM Tris-HCl (pH 8.0), 150 mM NaCl, 0.1% (v/v) Tween 20 (TNT Buffer), either with the clone 7E10, a monoclonal antibody anti-AKAP4 (4BioDx, 4BDX-1602, France), or with the clone 6F12, a monoclonal antibody anti-proAKAP4 (4BioDx, 4BDX-1701, France). After washing 3 times in TNT (10 min), each membrane was incubated with the secondary anti-mouse antibody coupled to horseradish peroxidase at 1:50000 diluted (Vector Laboratories, Burlingame, CA USA) and revealed with the ECL™ chemioluminescence kit (G&E Healthcare, USA). Images were acquired using the Image Quant™ LAS 4000 system (G&E Healthcare, USA).
The Pig 4MID® ProAKAP4 ELISA Assays
Thawed semen samples (respectively 50, 25 and 12μL) were mix with the Pig Lysis Buffer (450, 475 and 488μL) and then proceeded for ELISA quantification using the Pig 4MID® Kit (4VDX-18K2) according to the manufacturer’s instructions (4BioDx, France). Briefly, 100μL of semen lysates was then added to each well of the antibody-coated plate. A solution with conjugated proAKAP4 antibody was then added and after appropriate washing, the complexed sandwich was incubated with a substrate solution. The resulting color intensity was proportional to the amount of proAKAP4 present in each semen sample and could be measured by spectrophotometry at 450nm. A standard curve was determined in parallel for precise concentrations of proAKAP4 in the pig semen sample. Results of proAKAP4 concentrations were always expressed in ng/mL.
Statistical Analysis
Statistical analysis was achieved using Prism 8.2 GraphPad software (GraphPad Software, USA). D’Agostino and Pearson normality tests were performed to determine if the populations were following a Gaussian distribution and Pearson correlation coefficients were determined for each proAKAP4 concentration. The threshold for statistical significance was set to be p<0.05. In normally distributed groups, results were presented as mean ± standard deviation. The significant differences from T0 value were determined by a non-parametric paired samples t-test Mann Whitney U-test. Stabilities of proAKAP4 after freeze thaw cycles and after long term storage were assessed by the percentage change from T0 for paired groups (T0-T1, T0 -T2, etc. and T0 – T1M, T0 -T3M, etc.). Bias was calculated by the formula: [(CX - C1)/C1] × 100%, with C1: the mean or median of the T0 sample; and Cx: the mean or median of the experimented sample. For non- Gaussian groups, median variations from T0 were determined by non-parametric Friedman test and Wilcoxon signed rank test
Results
ProAKAP4 Expression in Boar Raw Semen
As observed previously from other mammals [1-3] proAKAP4 was only expressed in spermatozoa preparation and not in the seminal liquid as revealed with the monoclonal antibody (clone 6F12) against proAKAP4 (Figure 1). The proAKAP4 was cleaved in AKAP4 mature protein and the prodomain was released (Figure 1A). This cleavage and metabolism of the precursor proAKAP4 can also be followed by western blotting using specific monoclonal antibodies such as the clone 7E10 which recognized the C-terminus of both proAKAP4 and AKAP4 (Figure 1B). Therefore, in this initial T0 experiment, we observed the same amount of proAKAP4 and AKAP4 in the spermatozoa preparation sample of the fresh pig ejaculate. As expected, we confirmed that proAKAP4 is a spermatozoa specific protein expressed in the flagellum of pig spermatozoa
Stability of Boar proAKAP4 during Freeze-Thaw Cycles of the Same Aliquot
The concentration of proAKAP4 was measured in the ejaculate using the Pig 4MID® Kit as T0 value for the stability experiments. The initial mean concentration of ProAKAP4 was of 50.7 ± 1.3ng / mL, reflecting a high-quality semen [1]. After semen aliquots have been frozen and thawed up to ten times, there were no statistically significant differences in proAKAP4 concentrations as quantified using the Pig 4MID® Kit from T0 to T10 (Table 1).
All concentrations were in ng /mL and indicated as a mean± SD and median (interquatile ranges). Clearly, the proAKAP4 concentrations were not modified statistically after ten freezethaw cycles and the global percentage of variations was at 9.54%. Dilutions of the neat semen (half and quarter dilution factor) had no effect on the recovery of proAKAP4 concentrations as shown graphically on Figure 2. These dilutions highlighted the robustness of the Pig 4MID® Kit to quantify accurately the amount of the proAKAP4 polypeptide in neat pig semen. We checked then the expression and metabolism of proAKAP4 by western blotting (Figure 3). None of proAKAP4 and AKAP4 expressions or metabolisms were altered by the freeze-thaw cycles. Neither the integrity of proAKAP4 or AKAP4 was shown to be altered along the 10 freeze-thawing cycles and proAKAP4 was not further converted into AKAP4 showing that proAKAP4 and AKAP4 processing were not modified by freeze thawing cycles. The proAKAP4 was therefore considered as a very stable analyte when kept frozen in raw semen until we performed the Pig 4MID® Kit analysis
Stability of the Frozen proAKAP4 Polypeptide in longterm Storage Conditions
They were no significant variation in proAKAP4 concentrations as measured with the Pig 4MID® Kit for fresh pig sperm when stored until 6 months at -20 °C (Table 2). No variations were obtained when stored at - 80 °C (data not shown). Statistical significances were evaluated as described in the Materials and methods section. Our results showed that total proAKAP4 concentrations were clearly stable up to six months of storage at -20 °C with the variation in proAKAP4 concentration always below 5%. The western-blot analysis displayed no degradation of the sample stored at -20 °C from up to 6 months highlighting the robustness of the protein when kept frozen in raw semen (data not shown).
Intra-assay and Inter-Assay of the Pig 4MID® Kit
We further assess the robustness of the Pig 4MID® Kit by evaluation of the intra-assay and inter-assay CV’s on the Pig 4MID® Kit with neat pig semen as in the design of our study. These intra-assay and inter-assay CV’s were performed with two different ejaculates of the same animal (Table 3). Inter-assay variation was assessed from 10 determinations (with 2 aliquots each day) on ten consecutive study days, and intra-assay variation was calculated from eight sequential determinations obtained from the first day of the study period
Discussion
This study examined the storage effects and repeated freezethaw cycles on pig proAKAP4 sperm protein integrity in preanalytical conditions (meaning before the 4MID® Kit procedures) to evaluate the robustness of this new parameter in daily routine of semen analysis for swine breeding activities. We clearly show that proAKAP4 polypeptide is highly stable when frozen at minus 20 °C, for a long time period (up to 6 months) and will not be altered by multiple freeze-thaw cycles in neat semen. These data are of importance as they highlighted for the first time, that specimens of one ejaculate can be aliquoted and kept at minus 20 °C until their analysis and shipped from AI stations to central laboratories without loss of proAKAP4 integrity.
The reason of this stability could be due to the localization and the inherent functionality of the proAKAP4 itself. As shown on Figure 1, the proAKAP4 is a sperm specific protein that is neither found on the membrane nor released in the seminal plasma. The proAKAP4 polypeptide is inside the spermatozoa, more precisely in the fibrous sheath of the principle piece of the flagellum [19-22] and will need to be released from the fibrous sheath to be further quantified using the 4MID® assay. ProAKAP4 has been shown to be strictly localized to the principal piece of the flagellum and not in other spermatozoa compartments [20-21], tightly anchored to the fibrous sheath, along the longitudinal columns and ribs of the sperm tail [2,3,20-21].
According to the Pig 4MID® assay procedure, the proAKAP4 has then first to be extracted from the spermatozoa. Proteins markers described in sera or in seminal fluids [1,23] are frequently reported to suffer from the shear stress induced in buffered solutions and from long-term storage conditions. In contrast of what we reported with sperm proAKAP4, proteins in buffer solution can be fragile and they may even acquire conformations susceptible to degradation during frozen and post-thawed conditions. Clearly, proAKAP4 concentrations appears to be stable as long as the polypeptide is maintained in neat semen within the spermatozoa flagellum, with the fibrous sheath bringing stability for proAKAP4 integrity. The maintenance of proAKAP4 as a fulllength precursor is then important for the aliquot processed for the initial quality assessment of the ejaculate and at further steps, for the quality control during dose processing in AI stations. High proAKAP4 concentrations in the ejaculate and then in doses, will ensure to have enough motile and functional spermatozoa populations in the hours post the artificial insemination
The total amount of proAKAP4 per spermatozoa is fully synthetized within the testis and before ejaculation. Therefore, an aliquot of the ejaculate could be frozen immediately after semen collection in boar studs as this will represent the exact picture of the long-term motility of the spermatozoa. Freezing of an aliquot of ejaculate at collection point will then facilitate the analysis of semen (related to the proAKAP4 concentration) and favors also transport of such aliquot up to external laboratories. Our results clearly showed that degradation rates of the proAKAP4 were not impacted by frozen storage conditions of the aliquot and are in favor of such collection for delocalized sperm quality assessments. Furthermore, proAKAP4 stability when stored in aliquots in sperm frozen collections, will allow to better take in account technical and logistical constraints such as i) delays in shipping frozen aliquot when in need to analyze hypofertile animal; ii) being less dependent of any power cut or voltage fluctuations of the low-cost freezers; or the use of frost-free freezer that goes through numerous defrost cycles, as may happen in small breeding centers.
In boar stud, the storage of frozen aliquoted samples could also be convenient to process all the semen in the same time to compare ejaculates of different animals at the end of collection time. The dose semen processing will then not be impacted as the 4MID® analysis will be completely run in 2 hours. The amount of proAKAP4 as a read out of sperm quality should add marketing values for AI stations by ensuring high quality semen. In swine industry, there is also a real interest to identify the best male and then to follow up the sperm production during exploitation. Boars are usually kept from 6 to 9 months in the AI stations. That will be of importance to have a stable parameter to follow animal along all his career and keeping a safe measure of the initial quality of the first ejaculate after quarantine. In this context, the storage of frozen aliquoted samples may allow likewise to identify genetical traits of interest in a particular pig strains, such as fertility, death at birth or litter size, that may be related to proAKAP4 levels of expression [1,24-27].
Finally, keeping frozen aliquots of pig semen could allow to reanalyze the same samples stored to confirm previous results or to perform additional analysis, establishing new path for boar sperm preservation investigations. Better understanding proAKAP4 stability allows now to compare ejaculates at different collection points and compared to extended semen which is being shipped and used many days later. The storage capacity of extenders should be then further explored in relation with proAKAP4 consumption and degradation rates, during several days and in chilled conditions, when spermatozoa will stay alive.
Conclusion
One of current challenge of the swine industry is to standardize the semen processing procedures within boar studs. The proAKAP4 parameter have been initially introduced to facilitate the identification of ejaculates of inferior motility and quality, that were not identified by classical sperm parameters, and that could then be withheld before their release into the field. Having a stable sperm parameter such as proAKAP4 that can be kept stable as frozen up to the analysis time should be further interesting for quality check control and to follow up this parameter evolution during all the boar career. Taken together, the proAKAP4 parameter stability present then multiple advantages in favor of harmonizing sperm quality assessment between laboratory and AI centers.
To Know More About Journal of Dairy & Veterinary sciences
Please click on: https://juniperpublishers.com/jdvs/index.php
For more Open Access Journals in Juniper Publishers
please click on: https://juniperpublishers.com/index.php
#veterinary pathology#veterinary pharmacology#Veterinary Toxicology#Veterinary sonography#Juniper Publishers#open access journals
0 notes
Text
Influence of oligochitosans and highly molecular chitosan on Lactobacillus bulgaricus cultivation

Abstract
It was established that decrease of oligochitosans with molecular masses 7.0, 25.4, 45.3 kDa concentration in the process of Lactobacillus bulgaricus cultivation leads to fermented dairy product pH reduction and titratable acidity increase. Further increase in titratable acidity and decrease of lactic acid microorganisms’ amount was determined during the fermented dairy product storage process. Oligochitosans with molecular masses 7.0, 25.4, 45.3 kDa in concentrations interval from 0.0025 to 0.01 per cent did not exhibit prebiotic properties. Active acidity elevation and titratable acidity depression was observed at the chitosan with molecular mass 350 kDa concentration rises. Also increase of highly molecular chitosan concentration leads to elevation of lactic acid microorganisms’ total amount, which was more than three degree as many as total count of lactic acid bacteria in control sample.
Keywords: Chitosan; Oligochitosan; Lactic acidbacteria; Lactose, Lactic acid fermentation; Lactic acid
Introduction
Starters of the Lactobacillus bulgaricus species pure cultures are widely used for manufacturing of functional fermented dairy products with dietary and health-promoting properties. The prospective way of fermented milks production technological development is enrichment with chitosan [1-3]. Chitosan is a biogenic heteropolymer consists of N-acetylglucosaminaine and glucosaminresidues [2,4]. Chitosan has high molecular mass and soluble in organic acids [5,6]. Low-molecular derivatives of chitosan are represented byolygochitosans with a molecular mass from 2 to 50 kDa, which are well soluble in water. Chitosan and olygochitosans are able to interact with Lactobacillus bulgaricus cells by a different mechanism depending of their molecular mass [7-9]. Teichoic acid negatively charged molecules of lactic acidbacteria cells are capable to multi-point ion binding with positively charged high-molecular chitosan, whereas their cytoplasmic membrane proteins interact with oligochitosans [4,9]. The consequence of this process may be a change in metabolic processes in lactic acid bacteria cells. The goal of research was to study the effect of different concentrations of high-molecular chitosan and oligochitosans with varying molecular mass on lactic acid fermentation process driven by Lactobacillus bulgaricus.
Materials and Methods
Targets of research were skim milk, starter culture of lactic acid bacteria Lactobacillus bulgaricus (producer: Dairy Plant “Stavropolsky”, Russia), chitosan with a molecular mass of 350 kDa and a 95 per cent degree of deacetylation (manufacturer: “Bioprogress LLC”, Russia). Oligochitosans with molecular masses of 7.0, 25.4, 45.3 kDa and 96 per cent degree of deacetyration was prepared by the previously described technique [5]. Dry skim milk was reconstituted to a dry mass concentration of (10 ± 0.2) % by dissolving in distilled water at temperature 30 to 35 °C. Reconstituted skim milk after recombination was characterized by the following parameters: mass concentration of fat 0.15 per cent, mass concentration of protein 3.2 per cent,mass concentration of lactose 5 per cent. The solution of chitosan with molecular mass 350kDa in 2 per cent concentration lactic acid aqueous solution with mass concentration 1 per cent was added into skim milk experimental samples for preparation of mixture with final concentration of chitosan 0.0025, 0.005, 0.0075 and 0.01 per cent respectively. Similar experiments were carried out using oligohitosans with molecular masses of 7.0, 25.4, 45.3 kDa in above mentioned concentrations. The starter culture of Lactobacillus bulgaricus was inoculated in the amount of 3 per cent of the total samples volume after pasteurization of the mixture and cooling to the fermentation temperature of (43 - 45) °C. The end of the fermentation process was determined by organoleptic curd density, as well as by titratable and active acidity. Experimental and control samples were stored during 17 days at 4 ± 2 °С after completion of fermentation process. Following parameters were tested in triplicate during storage of control and experimental samples: pH by potentiometry, titratable acidity by titrimetric analysis and total count of lactic acid bacteria (CFU per gram).
Results and Discussions
The effect of highly molecular chitosan and oligohitosans with a molecular weight of 7.0, 25.4, 45.3 kDa various concentrations on fermented dairy products physical and chemical properties during the cultivation of Lactobacillus bulgaricus and long-term storage process was studied.
As shown in Tables 1 &2, decrease in the concentration of oligochitosans leads to significant decrease in pH and increase of titratable acidity after 20 hours of cultivation.
This is explained by the fact that oligohitosans with molecular masses of 7.0, 25.4, 45.3 kDa in concentrations of 0.0025 and 0.005 percent effectively interact with the proteins of the lactic acid bacteria cytoplasmic membrane. This interaction induces bacterial stress [10]. Consequently, lactose enzymatic hydrolysis and lactic acid production are accelerated resulting in titratable acidity increase. The elevation of oligohitosans concentration leads to promotion of their interaction with bacterial cells teichoic acid molecules. This type of interaction influences on lactic acid bacteria cells cytoplasmic membrane permeability and as a result inhibit rate of lactose metabolism. Highly molecular chitosan concentration variation did not lead to significant changes of pH and titratable acidity of fermented skim milk in comparison with control samples. Chitosan with a molecular mass of 350 kDa puts into effective multi-point ion binding with negatively charged teichoic acid molecules of Lactobacillus bulgaricus cells. This is due to the presence into highly molecular chitosan structure of about 1850 amino groups. Lactose assimilation and lactic acid formation rates are changed depending on highly molecular chitosan concentration.
Physical and chemical properties of fermented dairy products during long-term storage at 4 ± 2 °С were studied after the completion of the Lactobacillus bulgaricus cultivation process. It was established that optimal organoleptic attributes (taste and odor) of fermented product control sample are achieved after 5 days of storage at pH 4.2 - 4.5 and titratable acidity 70 - 140 °T. Organoleptic attributes of this product deteriorated during the further storage.
As shown in Table 3, optimal titratable acidity of fermented milks experimental samples containing oligochitosans at a concentration of 0.01 per cent persisted for up to 17 days. Further increase of titratable acidity of experimental samples containing oligochitosans at a concentration 0.0025, 0.005 and 0.0075 per cent was observed during the storage after the completion of the fermentation process.
Decrease in titratable acidity of fermented dairy product experimental samples was detected when concentration of chitosan with molecular mass 350 kDa increased in interval from 0.0025 to 0.01 percent. Therefore high-molecular chitosan concentration elevation reduces the intensity of lactic acid fermentation in experimental samples. The most powerful process of lactose homo fermentative fermentation inhibition occurred in a sample containing high-molecular chitosan in concentration of 0.01 per cent. The decrease of lactose assimilation intensity by Lactobacillus bulgaricus cells may be propelled by two reasons. The interaction between chitosan molecules and lactic acid bacteria cells cytoplasmic membrane leads to disturbance of membrane permeability for β-galactosidase enzyme, which catalases the reaction of lactose into glucose and galactose hydrolysis. At the same time structural changes in cell cytoplasmic membrane cause retardation of lactose hydrolysis products active transport into bacterial cells.
Thus, there is an inhibition of lactic acid formation in the process of fermented dairy product containing high-molecular chitosan storage, which stimulates the preservation of a large number of lactic acid bacteria. This is confirmed by the data of lactic acid microorganisms ‘quantitative accounting in control and experimental samples after 17 days of storage, as shown in Table 4.
The data presented in Table 4 indicates that oligohitosans with molecular masses of 7.0, 25.4, 45.3 kDa did not affect significantly on Lactobacillus bulgaricus grows rates during fermented dairy products storage process. Addition of highly molecular chitosan in concentrations of 0.0075 and 0.01 per cent in fermented milks increased the content of lactic acid microorganisms,which was more than three degree as many as total count of lactic acid bacteria in control sample.
Thus, tested samples ofoligohitosans with varying degrees of polymerization did not exhibit prebiotic properties and did not prolong the shelf life of fermented dairy products. High-molecular chitosan in a concentration of 0.01 per cent can be recommended as a prebiotic, prolonging the shelf life of fermented milks, manufactured with application of Lactobacillus bulgaricus starter cultures.
To Know More About Nutrition and Food Science International Journal
Please click on: https://juniperpublishers.com/nfsij/index.php
For more Open Access Journals in Juniper Publishers
please click on: https://juniperpublishers.com/index.php
#diabetes nutrition#food biotechnology#food toxicology#Mass spectrometry in food technology#Juniper Publishers#open access journals
0 notes
Text
Anti-hyperglycemic Effect and Regulation of Carbohydrate Metabolism by Phenolic Antioxidants of Medicinal Plants against Diabetes

Authored by HP Gajera
Introduction
Background
Diabetes mellitus is a carbohydrate metabolism disorder of endocrine system due to an absolute or relative deficiency of insulin secretion, action, or both [1]. The disorder affects more than 100 million people worldwide and it is predicted to reach 366 million by 2030. The non-insulin dependent diabetes mellitus (NIDDM, type 2) is the most prevalent form globally which is associated with elevated postprandial hyperglycemia. The occurrence of NIDDM 2 has been shown an alarming increase during the last decade (http//www.who.Int/diabetes/en/).
Plant derivatives with reported hypoglycaemic properties have been used in folk medicine and traditional healing systems. Very few of these traditional antidiabetic plants have received proper scientific or medical scrutiny despite recommendations by WHO. Ayurveda and other Indian traditional approaches have described more than 800 plants in the Indian subcontinent, known to possess antidiabetic potentials. These require to be effectively studied and in fact only few of them have been characterized for their mechanistic action [2,3]. Pancreatic α-amylase, is a key enzyme in the digestive system and catalyses the initial step in hydrolysis of starch to maltose and finally to glucose. Degradation of this dietary starch proceeds rapidly and leads to elevated post prandial hyperglycemia. It has been shown that activity of HPA in the small intestine correlates to an increase in post-prandial glucose levels, the control of an important aspect in treatment of diabetes [4]. Hence, retardation of starch digestion by inhibition of enzymes such as α- amylase would play a key role in the control of diabetes.
The discovery of specific high-affinity inhibitors of pancreatic α-amylase for the development of therapeutics has remained elusive. Inhibitors currently in clinical, use for example, acarbose, miglitol, and voglibose, are known to inhibit a wide range of glycosidases such as α-glucosidase and α-amylase. Because of their non specificity in targeting different glycosidases, these hypoglycemic agents have their limitations and are known to produce serious side effects. Therefore, the search for more safer, specific, and effective hypoglycemic agents has continued to be an important area of investigation with natural extracts from readily available traditional medicinal plants offering great potential for discovery of new antidiabetic drugs [5]. Ponnusamy et al. [6] studied on antidiabetic medicinal plants for human pancreatic amylase inhibitory effect in vitro and found that pancreatic α-amylase lower the levels of post perandial hyperglycemia via control of starch breakdown. The probable mechanism of action of the above fractions is due to their inhibitory action on HPA, thereby reducing the rate of starch hydrolysis leading to lowered glucose levels. Phytochemical analysis revealed the presence of alkaloids, proteins, tannins, cardiac glycosides, flavonoids, saponins and steroids as probable inhibitory compounds.
Anti-hyperglycemic effect of natural phenolic antioxidants
Advanced molecular studies showed that methanol extract of black jamun plant modulate the expression of glucose transporter (Glut-4), peroxisome proliferator activator receptor gamma (PPARγ) and phosphatidylinositol-3-kinase (PI3 kinase) comparable with insulin and rosiglitazone [7]. Evaluation of black jamun containing antidiabetic poly herbal formulation in alloxan induced diabetic rats also showed significant hypoglycemic activity, positive glucose tolerance activity and reduced lipid peroxidation in various organs compared to that of the diabetic control animals [8]. Meshram et al. [9] studied on hypoglycaemic action of black jamun seeds. The possible mechanism by which extracts bring about its may be by affecting the activity of glucoamylase or by increasing the glycogen biosynthesis. Thus, the significant inhibition of glucoamylase suggests that the active hypoglycaemic compound present in methanolic extracts of jamun seeds does not necessarily require the presence of functioning of β-cells for its favourable action seen in type-I. It means the methanol extracts of black jamun seeds may act in a variety of diabetic conditions with or without functioning of pancreatic β-cells.
Hasan et al. [10] studied DPPH radical scavenging activity of black jamun seed extracted in methanol. It has been determined that the antioxidant effect of plant products is mainly due to radical scavenging activity of phenolic compounds such as flavonoids, polyphenols, tannins, and phenolic terpenes [11]. Liang & Yi [12] identified hydrolysable tannins (ellagitannins) extracted from black jamun fruit showed a very good DPPH radical scavenging activity and ferric reducing/antioxidant power. The results are promising and indicating the utilization of the fruit of black jamun as a significant source of natural antioxidants.
Stanely et al. [13] evaluated the protective effects of gallic acid on brain lipid peroxidation products, antioxidant system, and lipids in streptozotocin induced type II diabetes mellitus. The results showed the beneficial effects of gallic acid on brain metabolism in streptozotocin induced type II diabetic rats. A diet containing gallic acid may be beneficial to type II diabetic patients. Meguro et al. [14] investigated the effects of continuous ingestion of a catechin rich beverage in patients with type 2 diabetes. The significant increase in insulin level was observed to patients fed with green tea containing the catechin. Rizvi et al. [15] evaluated the effect of tea catechins (epigallocatechin gallate (EGCG), epigallocatechin (EGC), epicatechin gallate (ECG) and epicatechin (EC)) on markers of oxidative stress in erythrocytes from type 2 diabetics. The relative effectiveness of individual catechins are in the order of EGCG>ECG>EGC>EC. Higher intake of catechin rich food by diabetic patients may provide some protection against the development of long term complications of diabetes. Chlorogenic acid is a major component of coffee that may provide more of an explanation for coffee’s effect on risk for type 2 diabetes. Chlorogenic acid proposed beneficial effects on glucose metabolism. The chlorogenic acid may delay glucose absorption in the intestine through inhibition of glucose-6-phosphate translocase 1 and reduction of the sodium gradient driven apical glucose transport. In vitro studies and animal studies showed that chlorogenic acid derivates can be decreased hepatic glucose output through inhibition of glucose- 6-phospatase [16].
Jung et al. [17] investigated the blood glucose lowering effect and antioxidant capacity of caffeic acid in mice. Caffeic acid induced a significant reduction of the blood glucose and glycosylated hemoglobin levels than the control group. Increased plasma insulin by caffeic acid was attributable to an antidegenerative effect on the islets. Caffeic acid also markedly increased glucokinase activity and its mRNA expression and glycogen content and simultaneously lowered glucose-6- phosphatase and phosphoenol pyruvate carboxykinase activities and their respective mRNA expressions, accompanied by a reduction in the glucose transporter 2 expression in the liver. Zhi et al. [18] investigated the antioxidant activity of black jamun leaf extracts. Leaf extracts contained phenolic compounds, such as ferulic acid and catechin, responsible for their antioxidant activity.
Diabetes, when uncontrolled, causes dyslipidemia often followed by atherogenic abnormalities. Balasubashini [19] examined role of ferulic acid (flavonoid) in diabetes induced dyslipidemia. Study demonstrates that ferulic acid lowers the lipid levels in diabetic rats and hence prevents further complications. It has been documented that ferulic acid may lower blood sugar level of Type 1 and Type 2 diabetic mice by enhancing insulin secretion [20]. Diabetic mice was given rice derived ferulic acid for 17 days and results showed that plasma insulin level increased while blood sugar level decreased significantly compared with control [21]. Ferulic acid may be beneficial in Type 2 diabetic and for the management of diabetic complications. Hussain et al. [22] indicated that quercetin can decrease postprandial glucose level after disaccharides loading, which may be mainly attributed to inhibition of α-glucosidase as one of the expected mechanisms for the reduction of plasma glucose. This effect subsequently leads to suppression of postprandial hyperglycemia. Thus, quercetin can be considered as a potential candidate for the management of type 2 diabetes mellitus. Medicines that reduce postprandial hyperglycemia by suppressing the absorption of carbohydrates are shown to be effective for prevention and treatment of non-insulin dependent diabetes mellitus [23]. Quercetin inhibited in vitro the intestinal α-glucosidase activity [24]. It has been also assumed that quercetin activates tyrosine kinase. Phosphorylation of the specific region of the subunit in insulin receptor (including Tyr- 1158, Tyr-1161 and Tyr-1162) correlates with receptor tyrosine kinase activation and the propagation of the biological actions of the hormone [25].
Correlations between antidiabetic, antiradical and phenolic compounds
Our previous study Gajera et al. [26,27] suggested that antidiabetic activity of fruit parts of black jamun landraces was positively correlated with free radical scavenging activity, nutraceuticals profile and individual phenolic constituents. Total phenols and individual phenolics are positively correlated with antidiabetic and antiradical activities but vary with different level of significances. Individual phenolics - gallic, catechin, ellagic and ferulic acids are highly positively correlated (P0.001) with antidiabetic and free radical scavenging activity. The positive correlation (P0.01) was established for caffeic and chlorogenic acids to scavenge free radicals and α amylase inhibitory activity (antidiabetic) for methanolic extract of black jamun fruit parts. The quercetin was found only in seed and its part kernel fraction of BJLR-6 (very small size fruits) and found to be positively correlated (P0.05) with antidiabetic activity. Among the fruit parts of black jamun land races, seed exhibited maximum seven individual phenolics and total phenols, particularly in their kernel parts. Among the individual phenolics, gallic acid was most diverse phenolic constituents which significantly positively correlated (P0.001) with inhibition of α amylase activity and DPPH radical scavengers followed by catechin, ellagic and ferulic acids in different fruit parts of black jamun land races. The study explained correlation of individual phenolics including flavonoids (ferulic) with α amylase inhibition and free radical scavenging activities in fruit parts of indigenous black jamun landraces.
Muniappan et al. [28] reviewed the black jamun as an antidiabetic plant which contained ellagic acid, glycosides, anthocynine, kampferol, marcein and isoquarcetine; and halt the diastolic conversation of starch into sugar. The phenolic constituents may be contributed directly to the antioxidative action. Consequently, the antioxidant activities of plant/ herb extracts are often explained by their total phenolics and flavonoid contents with good correlation.
To Know More About Current Research in Diabetes & Obesity Journal Please click on:
https://juniperpublishers.com/crdoj/index.php
To Know More About Open Access Journals Please click on: https://juniperpublishers.com/index.php
0 notes
Last Seen Blogs

wintered-debtz
wintered-debtz

pas-si-fleur
some kind of June

rumahsemarangtimur
DEKAT
MASJID!!!, CALL / WA +62 821 – 3327 – 1158, Jual
Ruma

l-c-d-h44
Lewis Carl Davidson Hamilton 44

youthmakeart
YOUTH