
Last Seen Blogs

mayxncheese
🎪The Whole Circus🎪

ofmagiick
* space witch

sugarcane4
SC4

dendixia
Poggies!

hoodkms
but my mom says i'm cool
Text
PRESENTATION
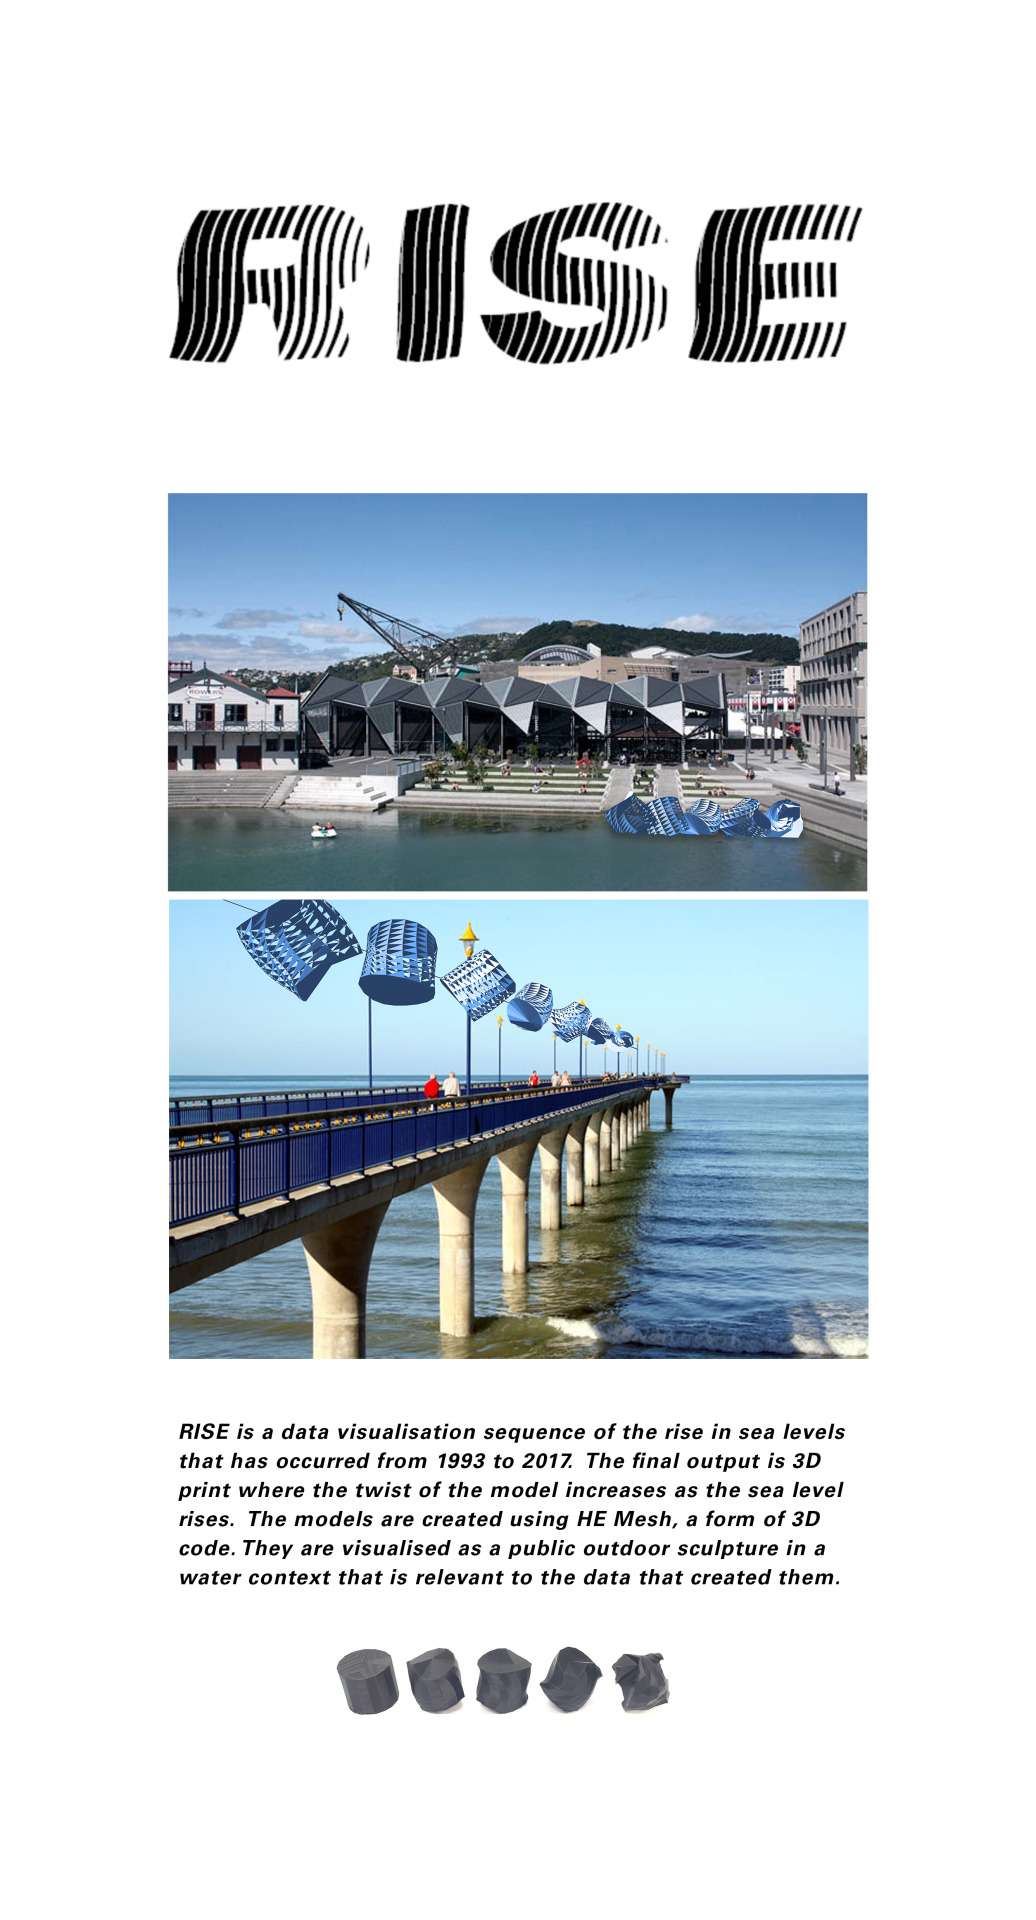
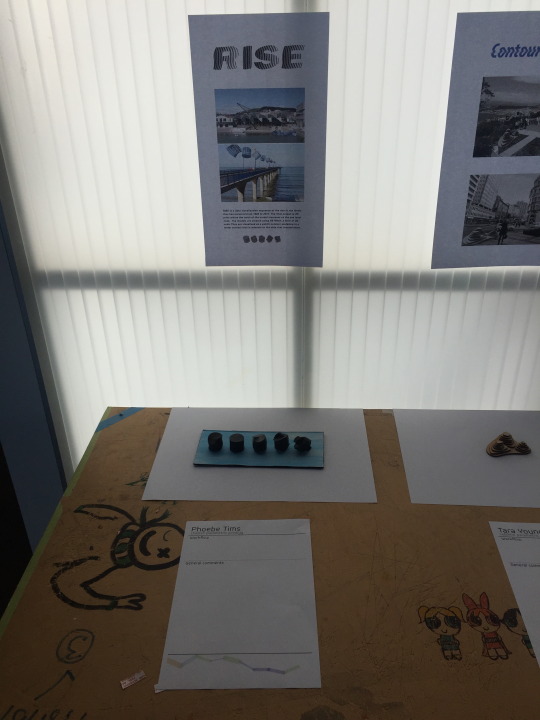
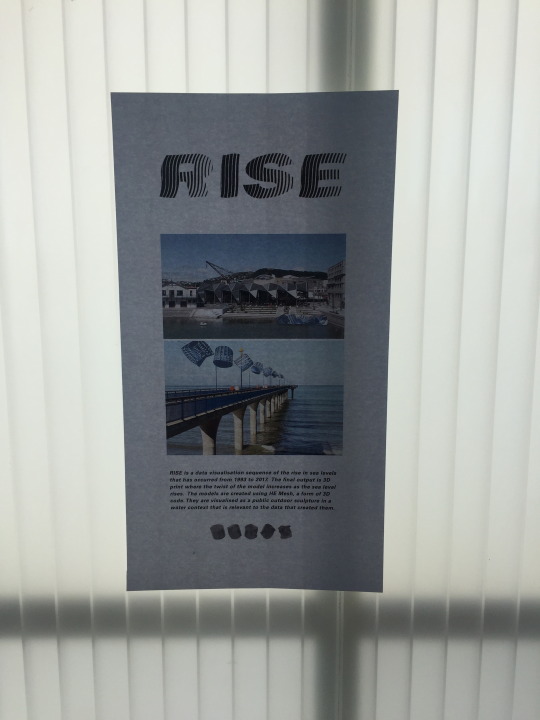
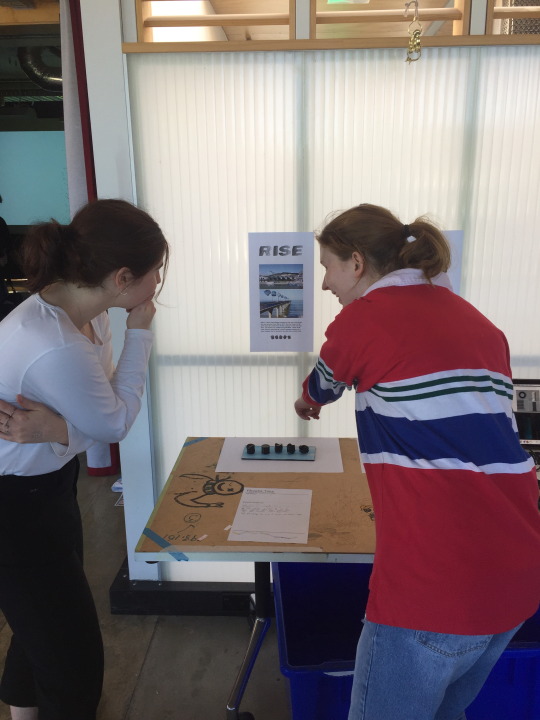
Really happy with the feedback too - glad to hear that people agreed with the visualisation of the models in water. They pointed out a good point that people would make the association in this location which was cool to hear from an outside perspective!
0 notes
Text
FINAL CODE
My final code:
/////////////////////// GLOBALS ////////////////////////
// LIBRARY
import wblut.math.*;
import wblut.processing.*;
import wblut.core.*;
import wblut.hemesh.*;
import wblut.geom.*;
import processing.opengl.*;
// HEMESH CLASSES & OBJECTS
HE_Mesh MESH; // mesh object
WB_Render RENDER; // render object
WB_Plane P;
WB_Line L;
// CAM
import peasy.*;
PeasyCam CAM;
int FRAME = 0;
// DATA
int[] year = {1993, 1994, 1995, 1996, 1997, 1998, 1999, 2000, 2001, 2002, 2003, 2004, 2005, 2006, 2007, 2008, 2009, 2010, 2011, 2012, 2013, 2014, 2015, 2016, 2017};
float[] sealevel = {-17.03765, -16.54147, -14.27094, -9.912121, -6.173636, -2.372727, -2.846667, -0.408824, 4.6211111, 8.1959321, 13.963775, 13.929917, 17.193824, 19.153333, 19.335405, 23.158142, 27.012341, 28.086489, 26.356986, 37.034058, 39.229615, 42.094444, 50.853514, 53.411146, 54.230769};
/////////////////////////// SETUP ////////////////////////////
void setup() {
size(600, 600, OPENGL);
CAM = new PeasyCam(this, 200);
createMesh();
createModifiers();
}
////////////// INITIALISE GEOMETRY /////////////////
void createMesh() {
HEC_Cylinder creator=new HEC_Cylinder();
//CREATOR PARMAMETERS
creator.setFacets(year[y]/1000+15);
creator.setHeight(70).setRadius(40);
creator.setSteps(10).setCap(true, true); // Vertical divisions & taper
MESH = new HE_Mesh(creator); // ADD CREATOR PARAMETERS TO OUR MESH
}
void createModifiers() {
// BEND MODIFIER
// TWIST MODIFIER
HEM_Twist twist = new HEM_Twist().setAngleFactor( sealevel[s]/10 );
L = new WB_Line(1, 0, 1, -1, 0, -1);
twist.setTwistAxis(L);
MESH.modify(twist);
// RENDER MESH
RENDER = new WB_Render(this);
}
/////////////////////////// DRAW ////////////////////////////
void draw() {
background(255);
directionalLight(255, 130, 7, 1, 0, -1);
directionalLight(255, 130, 7, -1, 0, 1);
// DRAW MESH
noStroke();
fill(255);
RENDER.drawFaces( MESH );
}
//////////////////// KEY ACTIONS /////////////////////////
void keyPressed() {
if (key == 's') {
saveFrame("screenShot_###.png");
println("screen shot taken");
}
if (key == 'e') {
// Hemesh includes a method for exporting geometry
// in stl file format wich is very handy for 3D printing ;–)
HET_Export.saveToSTL(MESH, sketchPath("export"+ FRAME+++".stl"), "1");
println("stl exported");
}
}
Description:
HE Mesh was the 3D library I used to create 3D meshes. The basis for my meshes was HEC_Cylinder (HEC meaning creator). The modifier is HEM_Twist (HEM meaning modifier).
Peasy Cam was a camera import that allowed me a 360 view of the meshes (important when working in 3D)
year[y] and sealevel[s] were used to reference their respective arrays of data. The year value effects how many facets the shape has, and sealevel value effects the amount of twist. The use of this referencing format as opposed to manually entering each value in saves time, and also makes human error slightly less possible. The values were often negative and long, so by being able to do a simple count up from 0-24, error was minimised. It also helps ensure the year and sealevel are corresponding data - y[1] s[1], y[2] s[2] etc.
Export as STL because this is a compatible file format with HE Mesh and works for 3D printing.
Final Workflow:
Code in Processing > Export as STL > Repair in Autodesk > Prepare in Cura and load to SD card > 3D print > hand-remove support printing
0 notes
Text
OUTPUT
3D printing
When I opened the mesh in Autodesk, the form was not solid. I used the emergency repair to make it solid by using the ‘add triangle’ tool. This was quite manual but was a necessary step which allowed the meshes to 3D print.
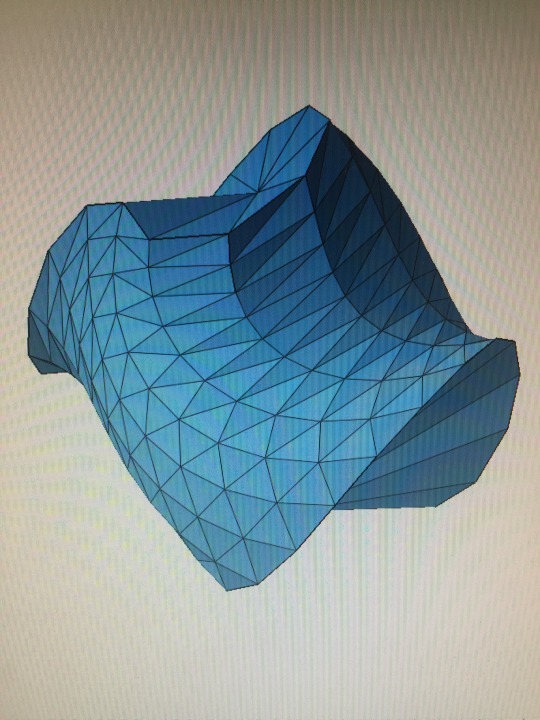
The opened stl on the right (pink), versus the repaired mesh on the left (blue).
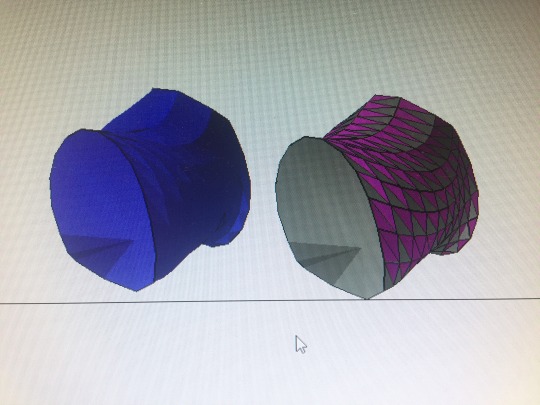
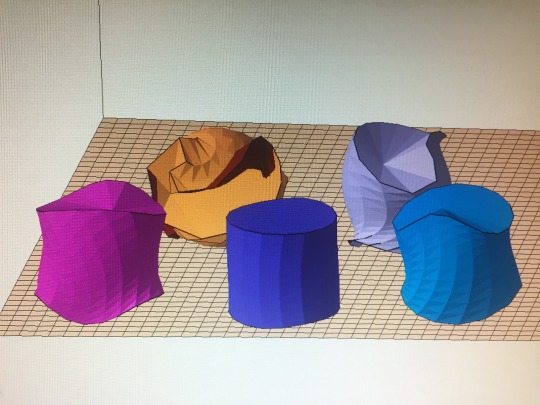
All 5 of the repaired meshes, ready to be opened in Cura. As pictured, I’m only printing 5 of the 24 meshes for time and resource purposes. The prints will be a model/visualisation of what they could become in real scale.

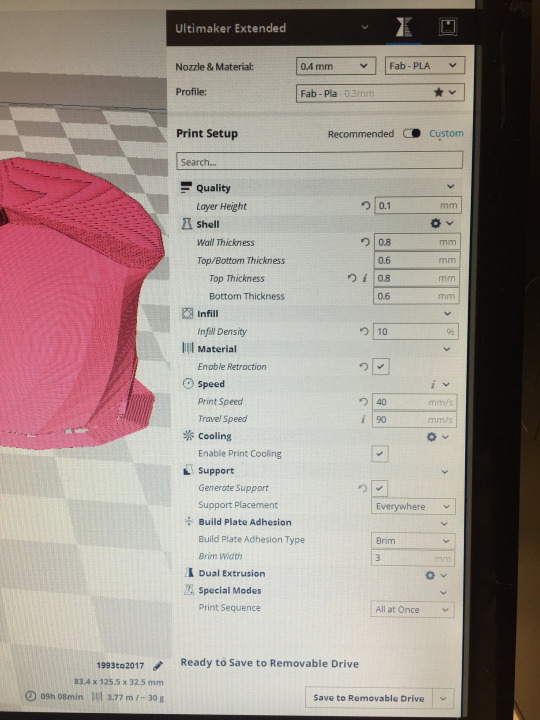
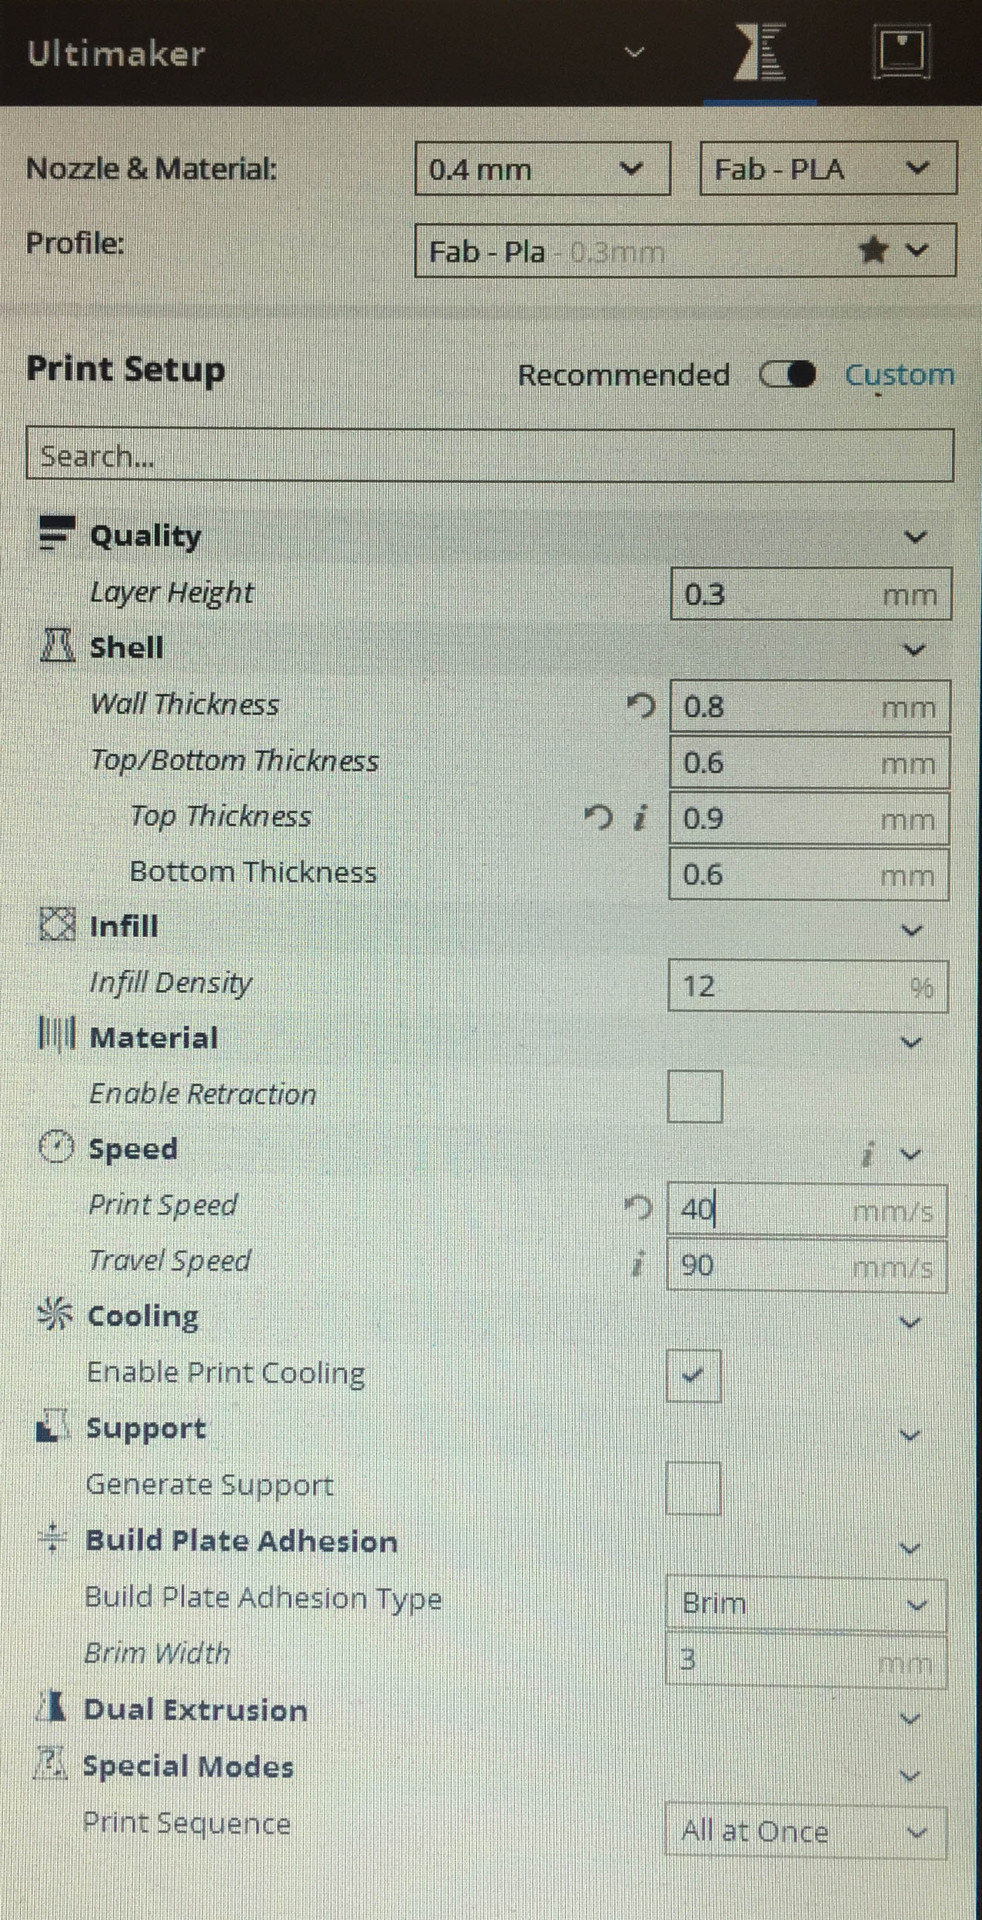
Next, opened this up in Cura to refine the settings for a successful 3D print. Made sure the walls had a suitable thickness, checked what support was going to be printed, and got to see how they were going to be built on the inside as well. The specific settings that were important for this print were the support system ticked, enable retract material between objects to minimise waste, layer thickness 1mm (meaning a finer print), infill density 10% (enough to be efficient yet strong), print all at once (rather than object by object where nozzle may knock it over).
Fresh off the printer from the weekend! Printed overnight for 9 hours to get the best quality print possible with these shapes.
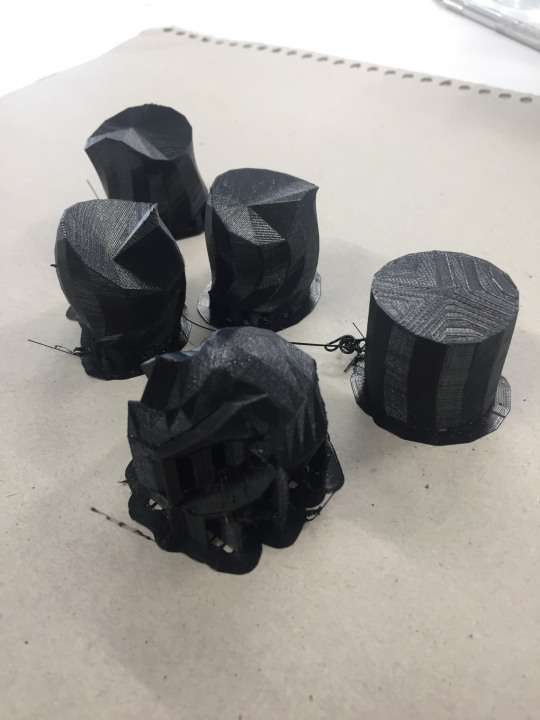
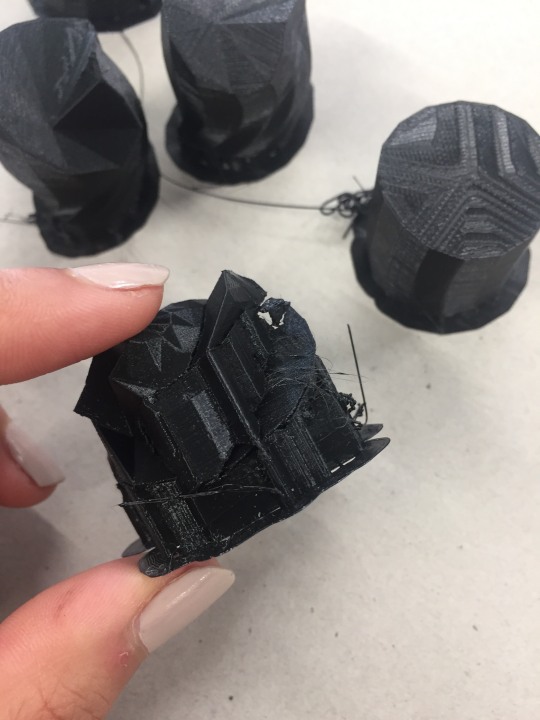
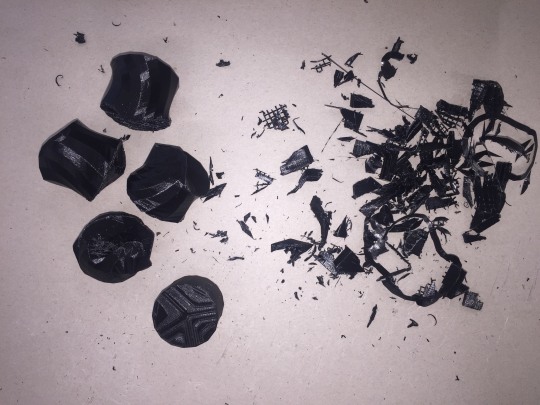
Removing the support printing with a scalpel craft knife.
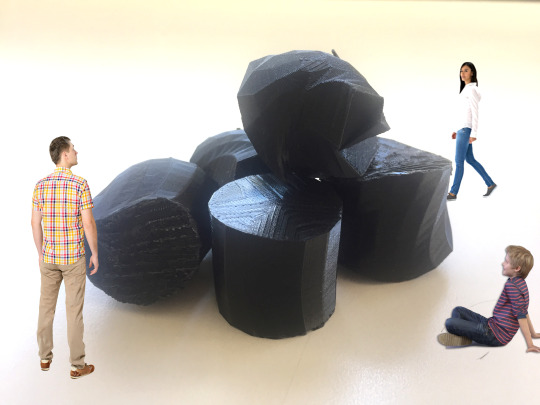
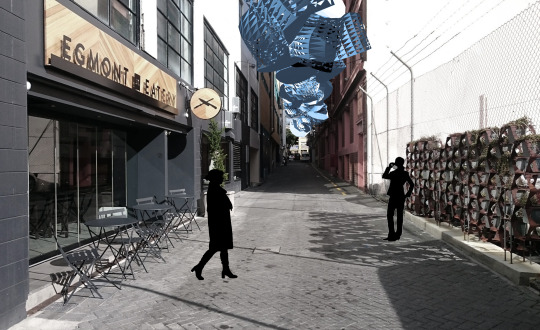
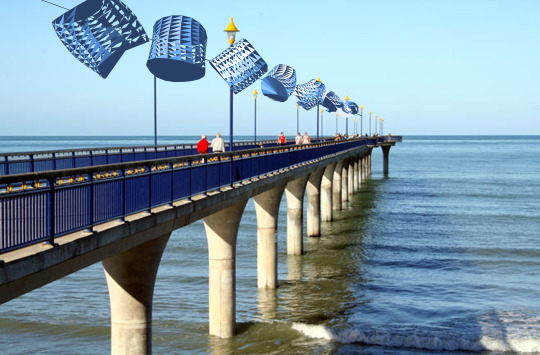
Entourage with the real physical prints. They could be suspended as in previous entourage post, or sculptures on ground as pictured, or utilise repitition and pile them up for visual effect...

Model making
I imagined the real-life models to be about half of human height. I calculated that a scale of 340 matched the 3D prints I’ve made. Also brainstormed how to display the objects.
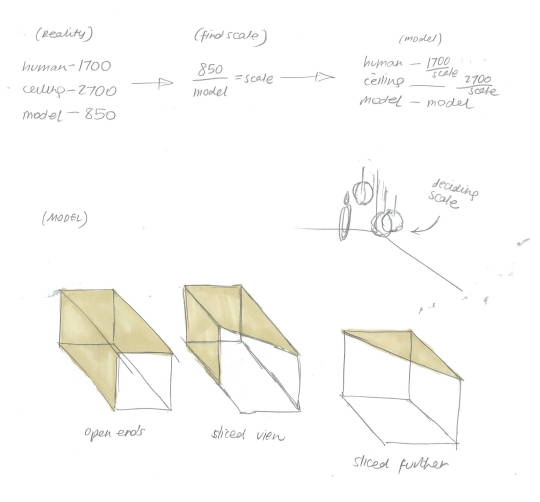
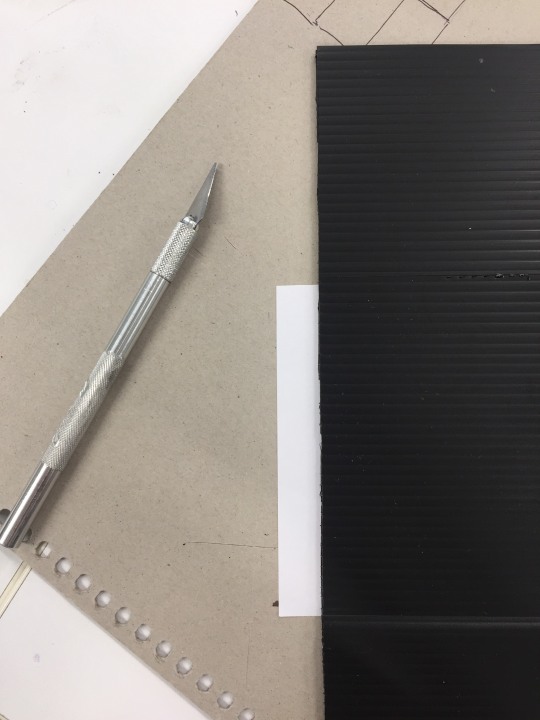
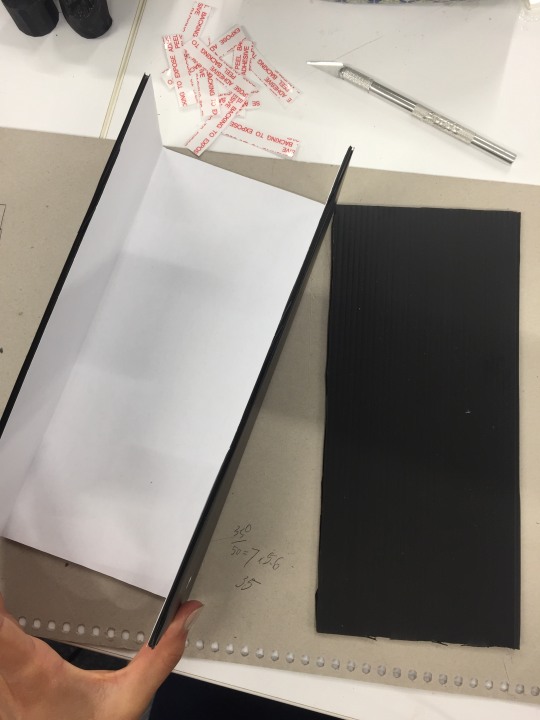
I started making the box/container as below. Plan on suspending the 3D prints from the lid of the box and placing model people inside for scale reference:
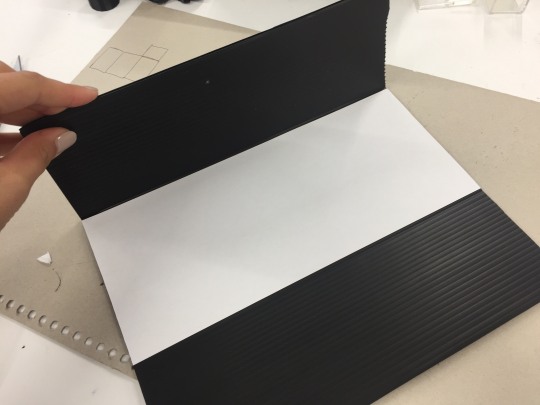
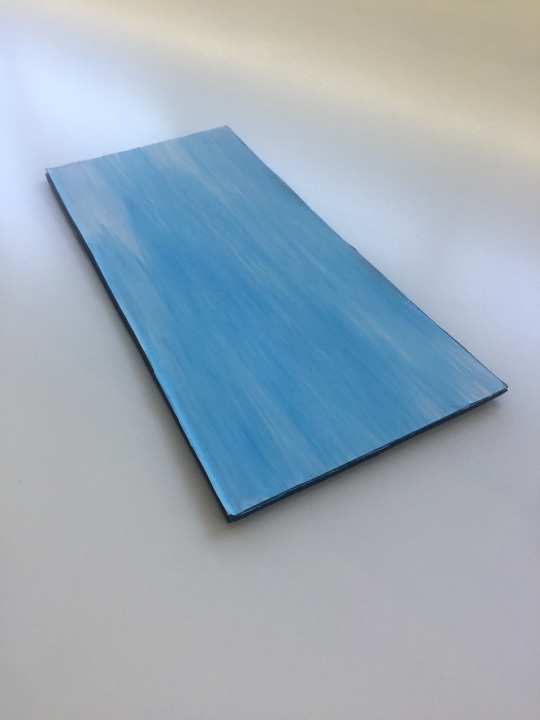
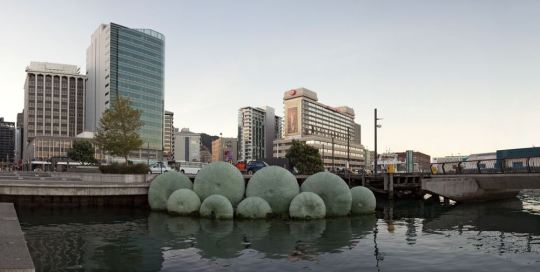
Update: I actually just relooked at my entourages and decided the kina-inspired water one was my favourite. So I’ve altered my ‘model’ so that it’s more of a display - the blue being an interpretation of the water. I’ll display it with an image of them in the water and information poster for context.
0 notes
Text
DESIGN PRINCIPLES + ENTOURAGE
DESIGN PRINCIPLES
Scale is a design principle that effects my concept heavily. In a space installation, the size of the 3D meshes will really change the experience. To emphasise the idea of rising sea levels, exaggerating the scale will create the feeling of immersion.

Also using the twist as a visual exaggeration of the scary contrast in sea levels between 1993 and 2017.


ENTOURAGE


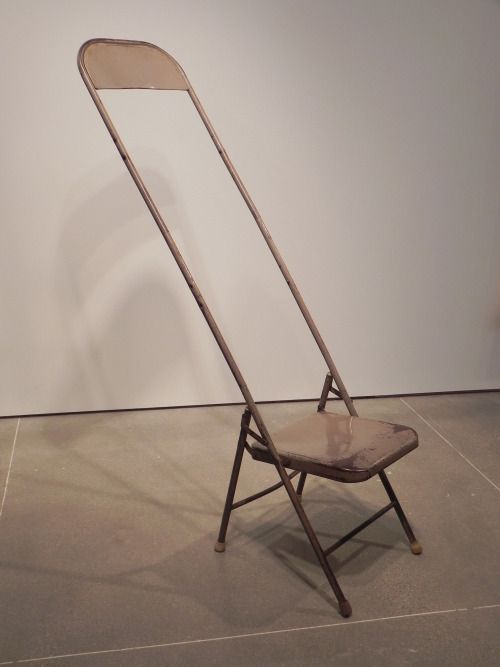
(as inspired by this existing kina sculpture)

0 notes
Text
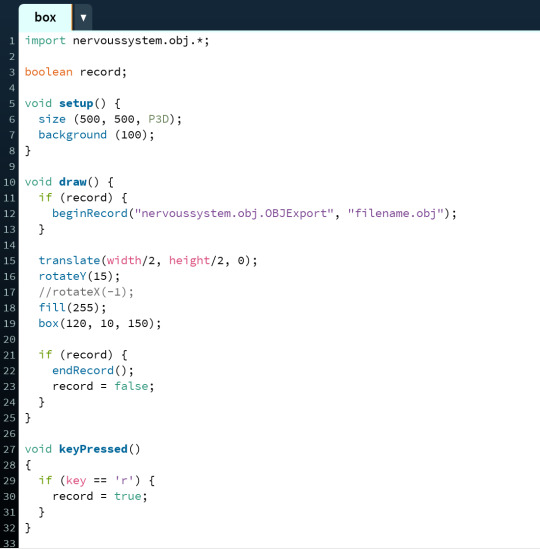
EXPORTING
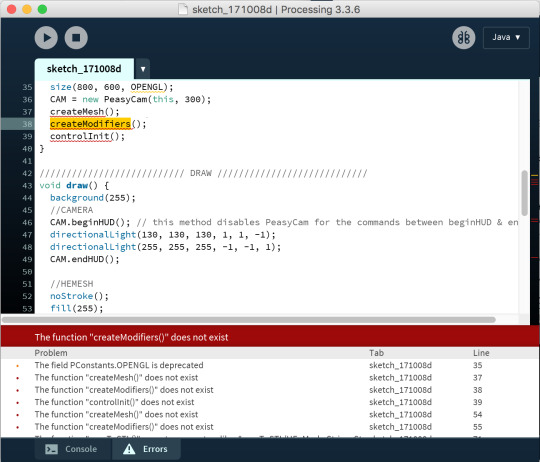
OBJ was the file format I used for my test output as STL code didn’t seem to work. This was at a point where I wasn’t using HE Mesh though. Now that I am, its actually swapped. That same OBJ code simply isn’t *meshing* with my HE Mesh, but STL works perfectly.
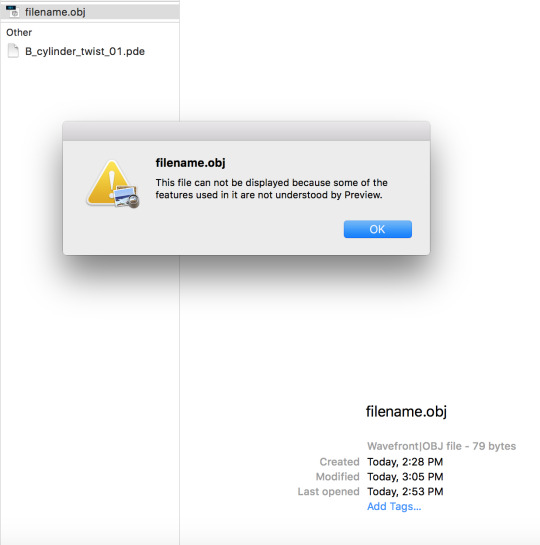
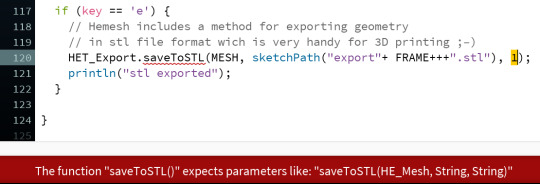
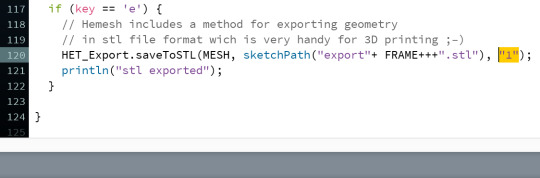
The existing HE Mesh export code had this error. But found in class that the integer 1 just needed to be made a string by adding “” as seen in screenshots below.
youtube
0 notes
Text
INPUTTING & USING THE DATA
I’m thinking the data could have one of two roles:
1. run code each time to get year and sea level mesh, or
2. key pressed: randomly generates mesh from a year and corresponding sea level (add println “year” to know which year is being represented) - I saw on Jordan Carroll’s 2016 blog this concept of randomly selecting data.
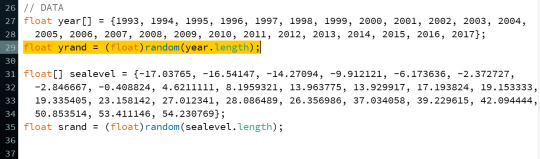
Wrote it into my code as seen in the screenshot below in case I want to try using it. Also, I’ve got my data in an array as like with Tim’s energy example. An array allows me to have multiple values within one set of {} and under the same name.
I’m trying out the for loop (before the random data-selecting code above) to start with. I’ve put a for loop in based on the examples in class. Y being the year: y=1993 meaning the data’s start point is 1993. y<=2017 meaning if the data is under or equal to 2017 it will continue to run. y++ meaning it goes up by one each time (and same concept for the S but with sea level numbers in place).
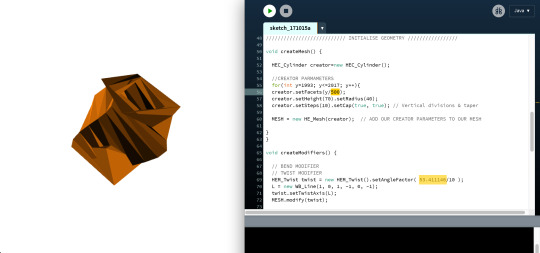
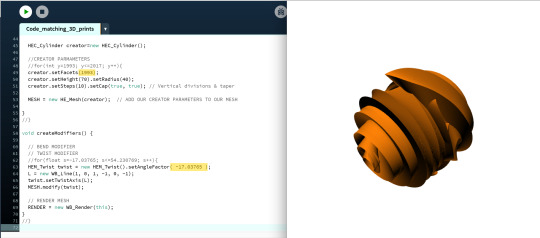
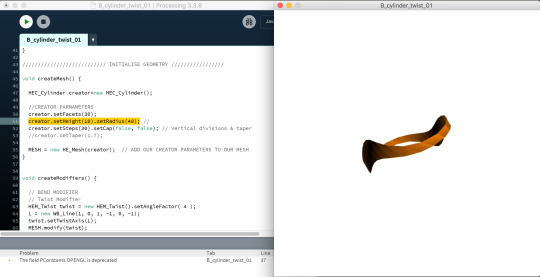
The ‘year’ for loop in action below. Realised after screenshotting that the value of the twist modifier was a sea level I had put in randomly previously. But ignoring that, the code is working!

Trialling how different things can effect the code. Dividing the setFacets value by 500 gives more facets than dividing by 1000, and therefore a larger, literally more multi-faceted shape:
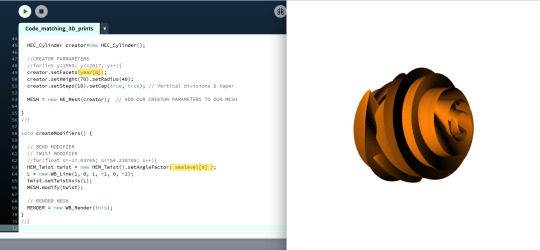
Adding in the same forloop concept but for sea levels to complete my concpet for the code. Replacing the twist value accident in above screenshots with s.
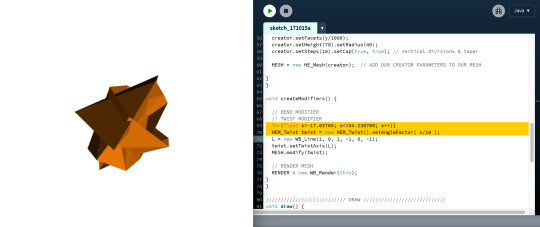
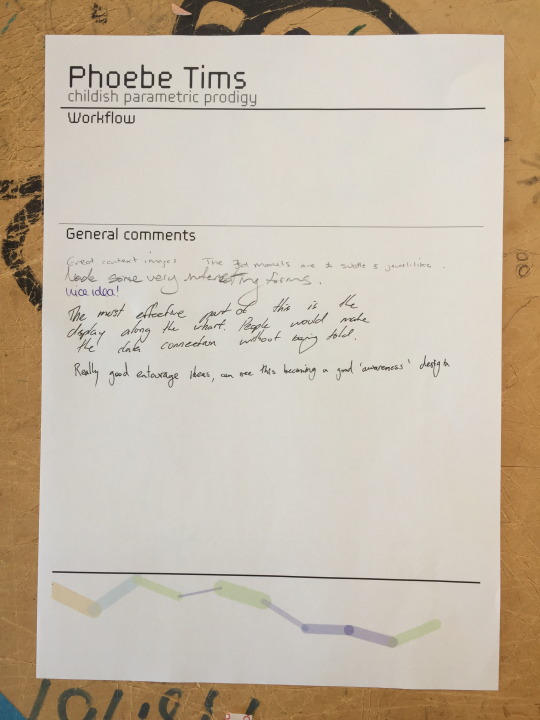
Here are some more images of what the sketch with loops for the year and sea level looks like from various angles. The thing I’m confused about is which year and sea level this is representing. Which piece of year and sea level data is the code drawing from the array and using as the value for output? I need to figure out how to get the code to go through every year rather than just displaying the starting point (1993). I guess in literal terms this is what I want the code to do: the viewer hits ‘y’ and the Y value (the year) goes up by one while also saving as the next stl.


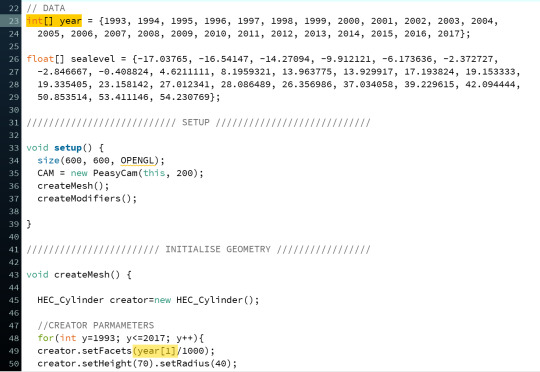
Thinking a forloop maybe isn’t what I need. Josh’s blog reminded me of the concept used for calling on values within the array: name of array[specific data’s place in array]. The data can be called on using its place number within the array, starting with the first number as 0. So, 1993 = 0, 1994 = 1, 1995 = 2 etc. So to reference 1993 from the ‘year’ array in the code, I would write year[0] in order to grab that first piece of data. Tried this below:
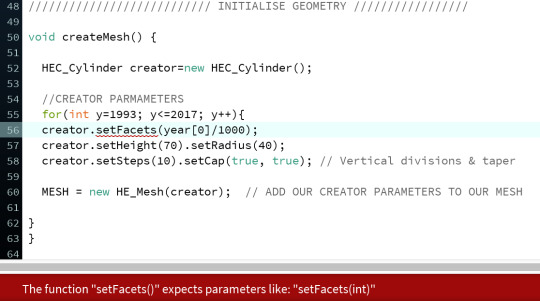
Fixed the error by changing the data class from float to int in order to match what setFacets required:
Ran it and created this shape for year/sealevel[0] ie. 1993 and -17.03765:
Just to check/prove that year[0] was equating to the correct data, I ran it manually and the same result came out wooo:
Keeping in mind that 3D printing with these meshes would be quite complex, I added a bit of division to the data values. This means the meshes are simplified enough to 3D print well, but still with enough twist to make visually interesting and representative forms!
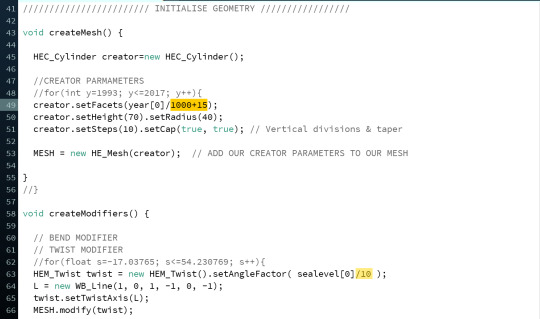
year[0] ie. 1993 now looks like this:

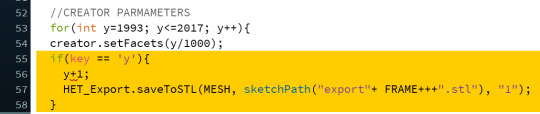
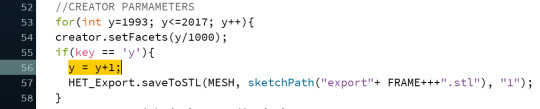
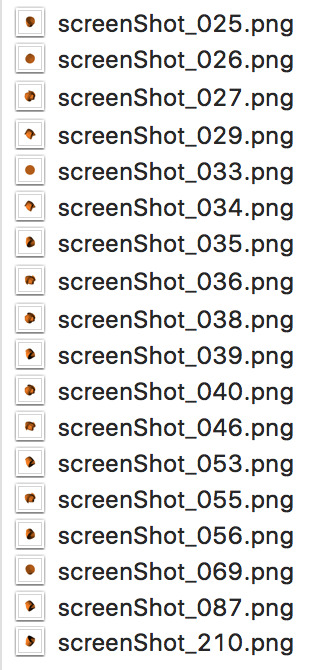
This code helped make the process faster for documenting (push ‘s’ for a screenshot’)
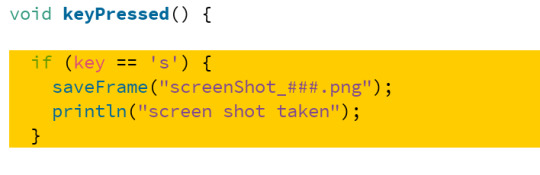
Using ‘s’ key, went through year and sealevel data arrays 1-24 and screenshotted. Next, going to do the same thing to get stl exports.
0 notes
Text
MOVING FORWARDS
Took a break and then came back to these 3 options - after rethinking, I think the HE Mesh will do my project the most justice. With 3D print as my output, I want the code concept to be something that works with that. HE Mesh is made for 3D modelling etc, so this is probably the best choice. There is also a lot of room for me to play around with visuals and relationship to data. I also find the HE Mesh shapes the most interesting so have decided to move forward with this option.

From here, I need to input the data and have it affecting variables. I’ve read through the code to understand what the different variables are and what they all do.
setHeight with no extrude or other modifiers. The height affects how ‘tall’ the shape is - height of the cylinder.
setHeight (10) + extrude was making it low in height, but still have 3 dimensionality.
no height makes the mesh into flat planes. I thought no height might create an error (no height maybe meaning nothing 3D to render?) but it still seems to work. It looks like the mesh is still rendered, just with no height to the planes.

.setCap “true” verifies the command to literally ‘set a cap’ on the shape and seal the edges - no longer open on the ends.

I’ve also played around with adding variables I learned from the HE Mesh tutorial - trying out different combos of modifiers to see what shapes they create.
Need to consider how these different modifiers will affect the 3D printing feasibility though. We found in class today that the extrude, for example, is all hollow and would need a setCap or something. Also, considering the support structure that will be printed, and how this will affect me in terms of time and quality of outcome.
To keep it manageable for the 3D printer, I’ve narrowed my inputs down to:
year effects number of facets
sea level effects amount of twist
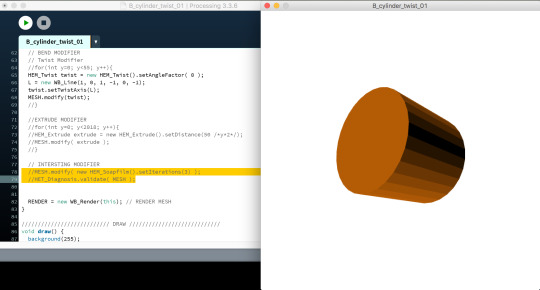
No extrude sadly as this makes it way too tricky. Cool on screen, but not feasible as a physical 3D print. So I’ve refined the starting point for the sketch back down to this cylinder (which is the basis for all the complex shapes above). Though it is a basic first shape, it will utilise the design principle of contrast to highlight the drastic rise in sea levels throughout the progression of shapes. I’ve turned extruder off, made Twist 0 (was at 4), turned HEM SoapFilm off, and made setCap true so it is sealed at the ends for 3D printing purposes.
0 notes
Text
OPTIONS
The visual design possibilities are infinite so I narrowed it down to some options that are both relevant to the data and aesthetically interesting/visually abstract art interpretations of the data. The three options I’ve got currently:
1. The spikes idea and work on creatively coding it

The spikes being relevant to ice/icicle forms and evoking danger of rising sea. Maybe add some if() functions that reveal certain elements once the sea reaches a certain level, or extruding on crazier angles as sea rises. Code
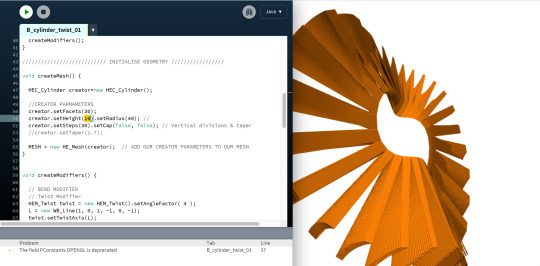
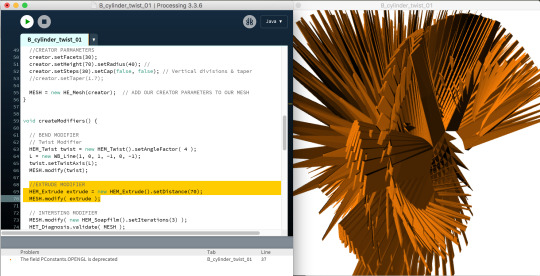
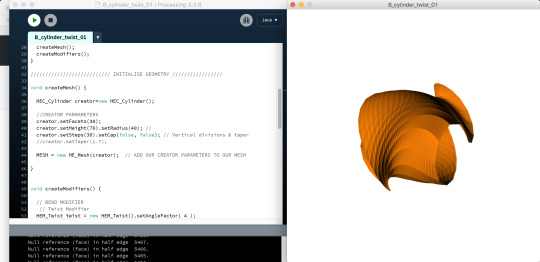
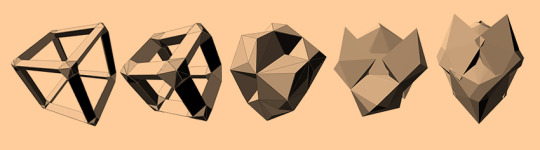
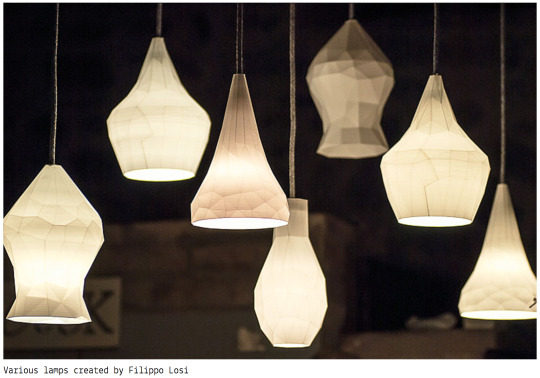
2. HE Mesh unique shapes altered by the data
(working with source code from FreeArtBureau which had an awesome three-part tutorial on HE Mesh. Interested in the last 3 meshes below for their resemblance to wave/ocean forms)
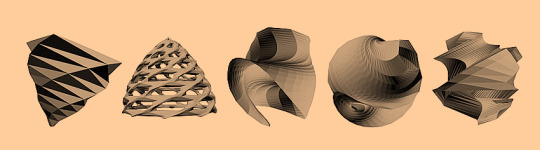

Got a bit confused because the source had uploaded the createMesh and createModifiers sections in a different file! Good to learn that some people do this (troubleshooting for future). Source code
What it looks like with errors fixed:
3. A more abstract 3D sketch altered by data
Until I get some help in class, I’ve just done some research into what could be done (exploring the ideas to see if it works for a final concept). For some reason, when thinking about spatial displays and 3-dimensional installation, I gravitated towards Russian Constructivism??! The geometry reminds me of like a precursor to all digital geometry scapes, I like that aesthetic, and the tension amongst geometric shapes is a visually accurate display of the consequences of rising sea levels.
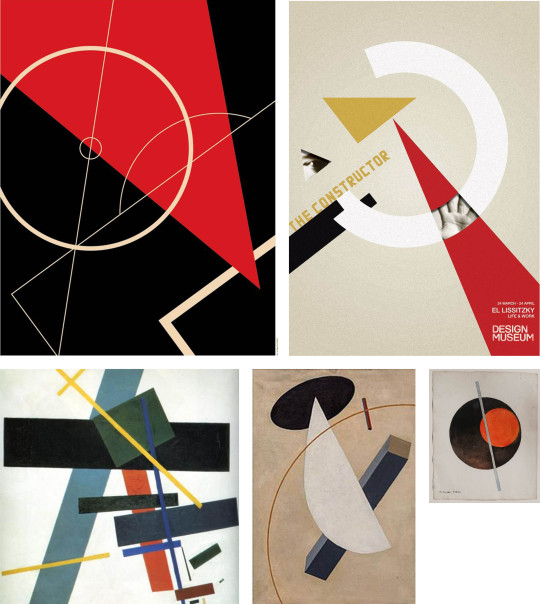
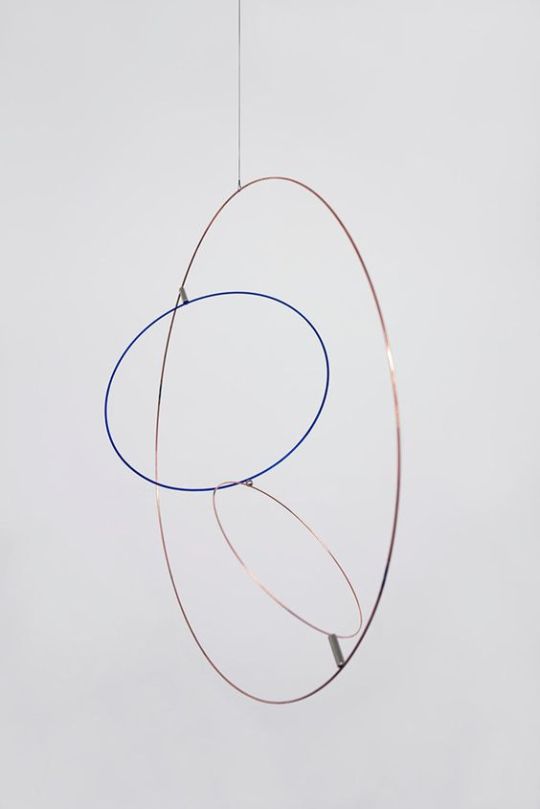
This leads on to a 3D example of this aesthetic - artist/designer Sabine Marcelis is an example of 3D constructivist-esque work. She works with a lot of simple geometry in a spatial context. Her examples are inspiration for the output side of things (no relation to data visualisation or coding).

From this extra research, I made a quick collage of shapes (using things that were visually reminding me of issues regarding rising sea levels or reminding me of the actual icebergs/icicles that melt and cause rising sea levels).
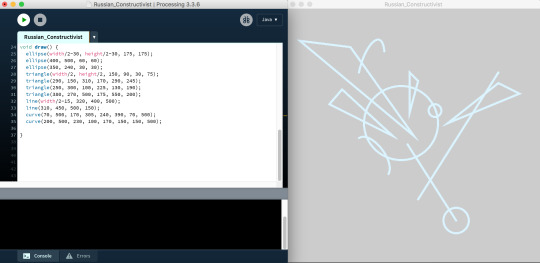
To incorporate data into this for ‘data visualisation’, the concept being that the lower the sea level at the time, the simpler and less tense the composition would be (shapes only revealed once sea reached a certain level, the scale of things grow as sea level value rises). I attempted to use Tim’s example code from class, but it was having trouble finding the data.
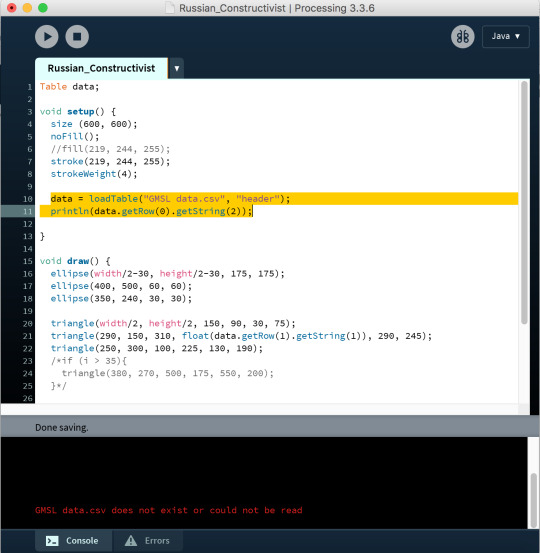
// adding this screenshot later down the track to show that the csv file is in the sketchbook location and still can’t seem to be read

Finding it a good challenge trying to figure out what syntax/what to even write to source the data, equate it to floats, use these floats in place of certain x/y/z positions etc. I’ve seen code using float{} to reference data manually typed in which is manageable for the amount of data I have. I think this approach will help me in making the code feel manageable and approachable so that I can focus on the shapes and output.
eg: Tim’s data example from the class blog
float[] energy = {10.3, 9.3, 10.4, 7.7, 11.0, 8.7, 9.8, 8.0, 9.5, 8.3};
void setup(){
size(400,200);
background(0);
noStroke();
for(int i = 0; i < 10; i++){
fill(255,128);
if(energy[i] > 10){
fill(255,0,0);
}
ellipse(i*50, height/2, energy[i]*10,energy[i]*10);
}
}
void draw(){
}
With this base sketch created, I now need to make it 3D. I considered modelling it into 3D using Sketchup but I’m not sure who that will translate. I could have the data effecting coordinates, scale, composition, and then push/pull the 2D sketch up so its raised, but not sure if that will be utilising the code enough? Rather than manually push/pulling the sketch in another program, maybe using the data to add depth to the shapes (another visualisation of the data)?
Other options for making it 3D are to try remaking it using the 3D versions of these shapes, or to simply move foward with a different one of my options. Think I’m gonna attempt to make the existing sketch work through the depth or 3D version solutions - seems like a waste of coding and research so worth a try:
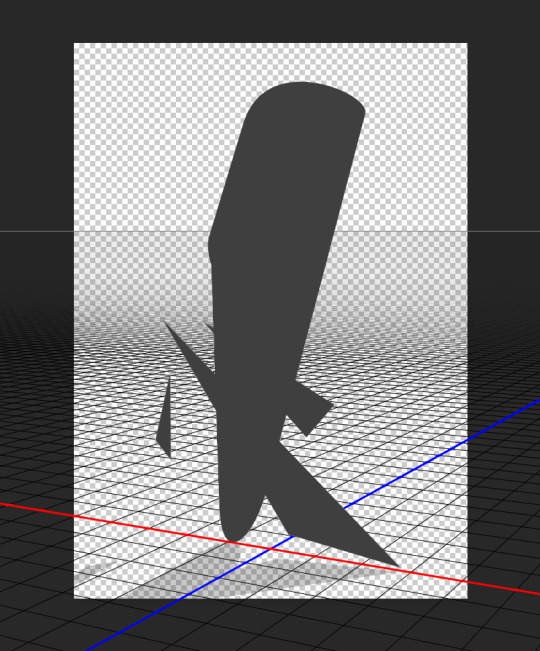
I attempted the 3D modelling process just in case. I exported as a PDF to begin with and opened in Sketchup, but couldn’t push/pull it up because it was read as one flat image. So I’m going to try the same thing exporting as OBJ instead.

Exported as OBJ didn’t create the same effect as its trying to merge 2D and 3D. It has created the sketch into a 3D object (solid panel) according to the silhouette rather than just the lines. (OBJ opened below in Photoshop 3D mode).
0 notes
Text
LEARNING ABOUT HE MESH
Notes
– All classes prefixed by HE_ specify core classes for accessing specific data concerning our mesh.
– All classes prefixed by HEC_ specify creators for creating & configuring the basic geometric shapes.
– All classes prefixed by HEM_ specify modifiers for applying a number of modifications to our shapes.
– All classes prefixed by WB specify a multitude of math and rendering possibilities.
All shapes are therefore created using the HE_Mesh class and the HEC_ classes. HEM_ classes are used for modifying our shapes.
Modifiers: Extrude
Cones and Cylinders - actually very close concept to what I hope to achieve (data visualised through a variety of data-effected shapes).
Explorations
Played with sphere by extruding it:

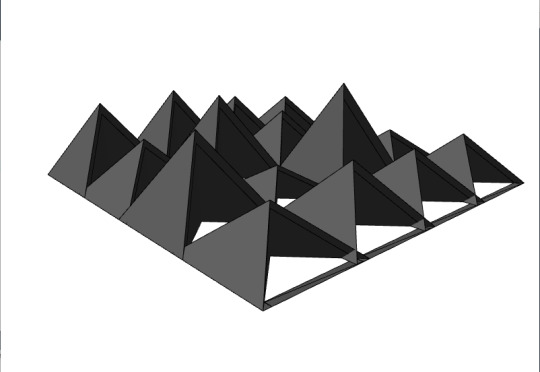
Looking at how I would maybe make a grid (if I go forward with the spiked grid idea):

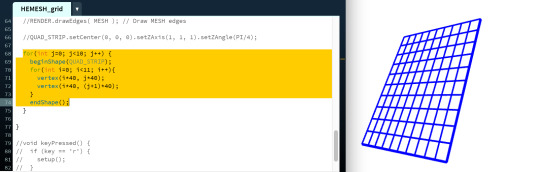
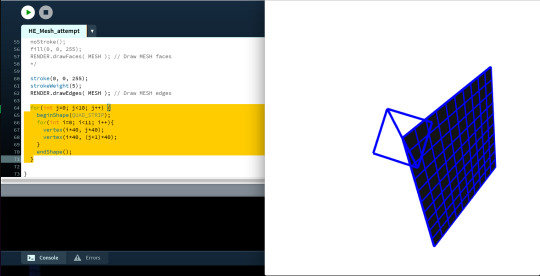
That square is the triangulated grid. When extruded, looks like this:

Extruding a cube:

0 notes
Text
TESTS FOR INTERIM
The Week 10 interim will help me to become familiar with what the process for the real thing.
Workflow: trial sketch in processing > export as STL > open in Autodesk then Cura > 3D print
I haven’t got my real code ready yet but am keen to get a full trial run through of the process. I’m just going to print a simple flat box (simple for time purposes).
Sketch in Processing

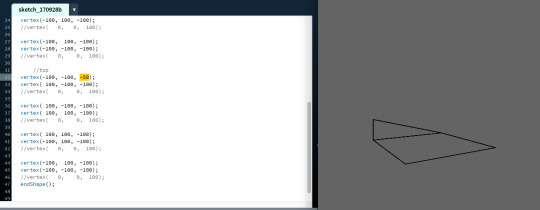
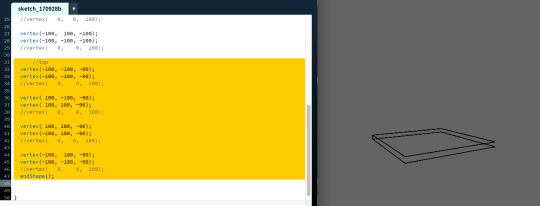
I got to this point of making the raised square/cube manually before finding this Processing info page...! Until now, I had only read that a box() could be a cube, but this page showed that you can put particular x,y,z variables in.
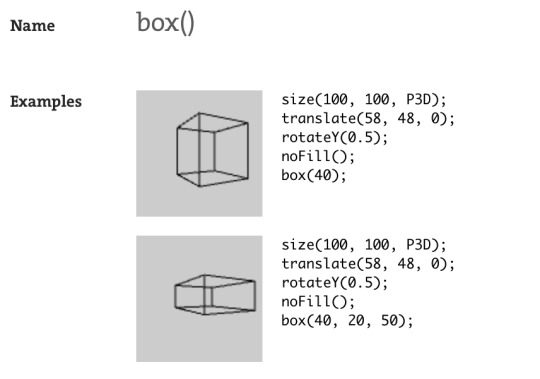


I’ve altered the x,y,z and checked that it is a functional 3D object by adjusting the x rotation and adding fill to see how it looks. I will print it without any x rotation in the code so that it is flat on the 3D printing surface though.
Saving as STL
Next step was to save as an STL to use in Autodesk and Cura. The STL format is a common 3D printing and prototyping file format and I had seen it in other workflows so attempted to use it. It ended up being a mission though! I did heaps of googling for how to make an STL from Processing but the solutions all required imports or longer, complicated processes.


From the research, I came across the DXF format. I thought maybe I could go Processing > DXF > STL? I used code from the Processing DXF example library and put my test sketch code in.
I then had to convert DXF to STL. There was a random little online converter which appeared to have worked, but when put onto Autodesk, had an error opening. There didn’t seem to be a straightforward way to get an STL straight from Processing OR get DXF to STL argh!! I was really keen to get the test print done though, so emailed you guys as well as going to Fablab and asking Craig. Craig wasn’t sure about how to get an STL either but found that an OBJ could work. Realising there is heaps of problem-solving involved with coding and digital fabrication processes which is exciting and challenging.
I imported the OBJ example library and put my test sketch code into the example as below:
From here I was able to open it up in Autodesk and Cura.
Used Autodesk to repair any errors that would stop it from printing. It was also used to place it on the printing bed before setting the print up in Cura.
Settings for Cura:


So from what I’ve learned from this test output, the updated workflow is:
sketch in Processing > export as OBJ > check/refine in Autodesk > check/refine in Cura > load to SD card > 3D print
0 notes
Text
STARTING THE CODING
I realised I need to work in 3D for the 3D printing!! I’ve read this Processing info page on it. Key things to note were the ‘left-handed’ system, rotation around 3 axis, translate and rotate for placement of 3D shapes, perspective modes.
I’m finding there is an overwhelming amount of option for 3D building - so far I’ve come across modelbuilder/unlekker import, HE_Mesh import, Primitives3D, and createShape() in Processing.
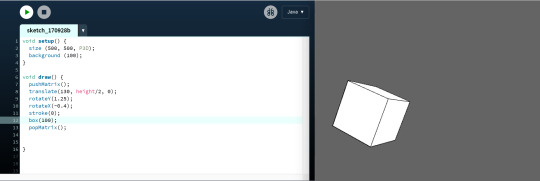
The box below just uses createShape() as a trial to get my head around rotation, translation, and working in 3D.


After talking with Cameron, I’ve also realised that the code could play more of a part in the generation than I was imagining with my initial concept. I was originally going to use the code to simply take in the data and give me the differently levelled spikes for 3D printing which we decided could easily be done manually, and that the code could have a larger role than that.
0 notes
Text
Global Mean Sea Levels
Rather than focusing on specific oceans which have lots of data, I want to focus on sea levels at a global level as it is a global issue.
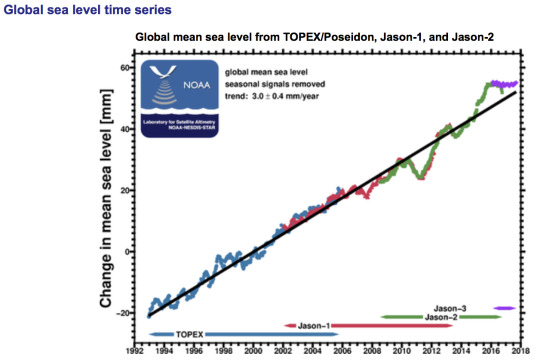
I’ve come across the NASA website which has awesome information on all kinds of global warming issues. They had a perfect term ‘Global Mean Sea Level’ which averages out the recorded sea levels from around the world. Below is a dataset that has recorded the GMSL from 1993-2000.

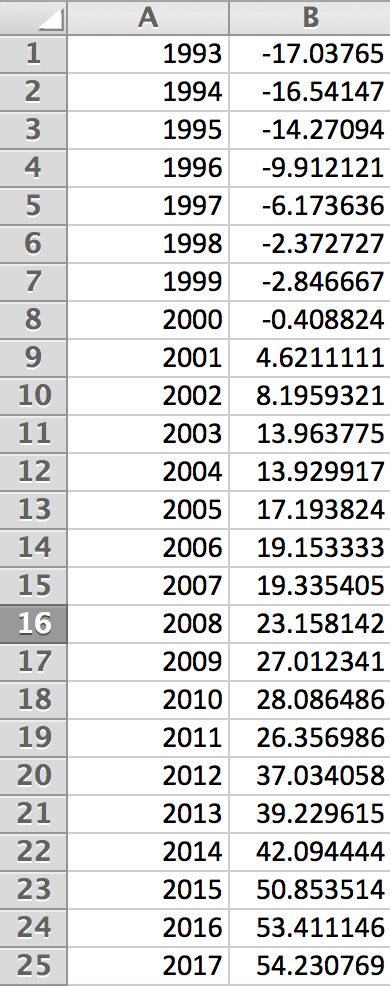
The data was in a tricky format, so I’ve sourced the same GMSL data from another database instead which is in a more user-friendly format. Again, it has data from 1993-present. The data has recordings at multiple times per year so I’m going to take the average from each year (ending up with one average value per year).
Column A: Year
Column B: Global Mean Sea Level from takings that year
0 notes
Text
WORKFLOW
My Planned Workflow
Tour > Brainstorm > Code in Processing > Export STL > 3D Print > Manually Assemble final details
FabLab Tour
Need to do a tour of FabLab. This will help me see what outputs are possible. The output will be influenced by my chosen concept from brainstorm below too.
Brainstorm
My brainstorm helped me get visual ideas down and clarify concepts down to something I want to move forward with. I recognise that the code may guide the outcome somewhere different from what I’ve drawn, but this was a helpful starting point. The brainstorm figured out what concept I will focus on, what data I need for it, and the kind of output that would be suitable.
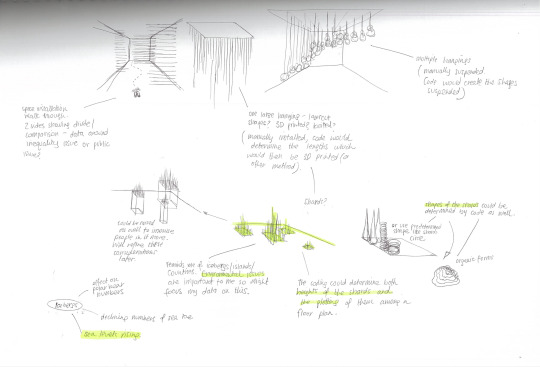
Concept - sea levels rising due to iceberg melting.
Data - sea levels recorded from every year over the past 100 years, or all recorded sea levels ever. Need to check what’s available.
Output - 3D printing or laser cutting - not sure of output at this stage, might gain a better idea once I start coding. //Update: Have decided on 3D printing!
0 notes
Text
FOR LOOPS
Notes on for loops
for loops
Use it in place of repeating lines of same idea
for (int i = 0; i < 10; i++){
}
int i = 0 - iterator constructor. Where the integer begins
i < 10 - conditional. Where it runs up to
i++ - iterator. What happens to the integer
0 notes
Text
CLARIFYING IDEAS
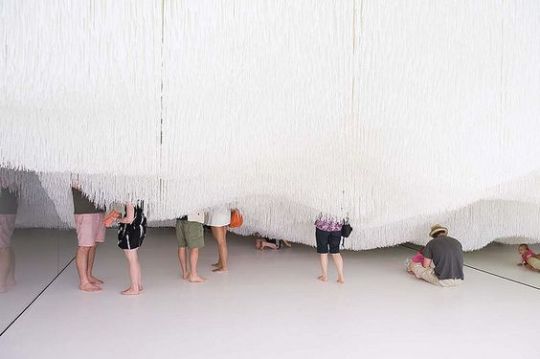
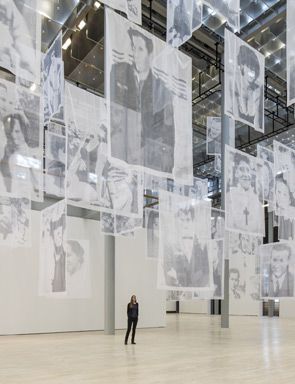
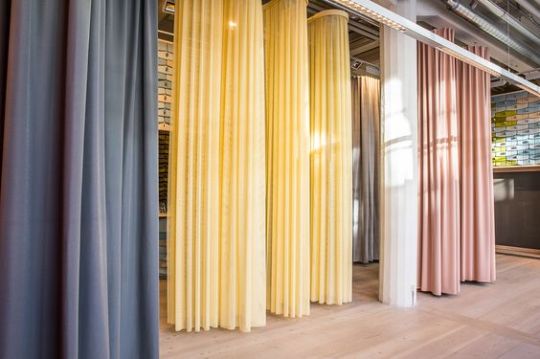
I enjoyed all of the data visualisation examples from what was shown today in class and what I found in research. A lot of the data visualisation examples from class were prints, so I’m interested in making this 3D and taking it into a human-sized space.
Below are some quite specific examples of what I’m thinking about - playing with levels and allowing human movement through the space.

0 notes
Text
CODING ARTISTS
Pitch Interactive is a data visualisation studio that focuses on using new technologies to address complex data. Here they have created Christmas cards with snowflakes that were generated according to two data points: how long they have known the recipient and the air quality where the card is being sent. This comes under ‘data visualisation’ which I quite like the idea of.
vimeo
“Generative design is when you try to create a piece of work through finding processes and rules of how those rules interact with each other.” - Karsten Schmidt.
youtube
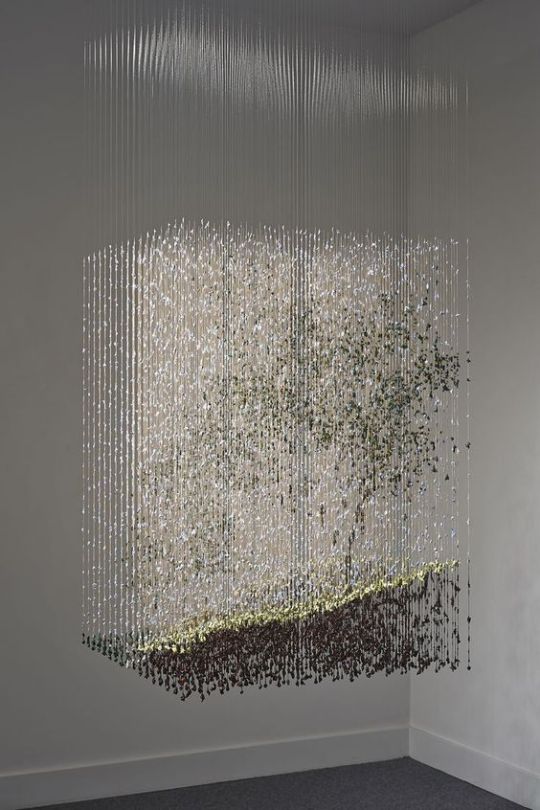
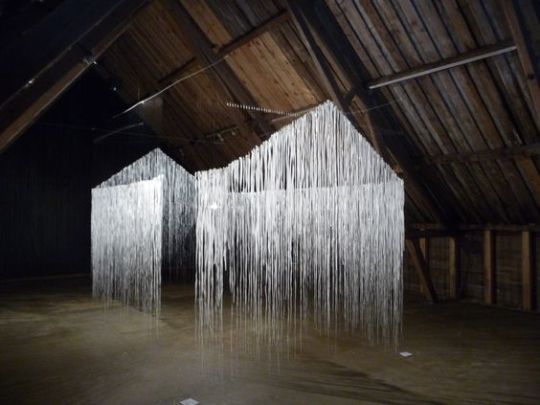
Below, the artist has made quite a sculptural, spatial design which interests me. I don’t know if he used code to create the physical structure, but that could definitely be incorporated for my own practice. He has used code, however, for the projections that appear on this 3D surface. Really enjoy the combination of 3D and digital.

Varvara & Mar are collaborators which was useful to see. Between their sets of skills they were able to create something push beyond their individual capabilities. This could be applied for me in the 3D workshop/FabLab/coding where I might have ideas for coding 3D objects but not the knowledge yet. This example had combinations of processes - gaining data from human brain activity and translating that into code which will create an object - I guess data visualisation again.
youtube
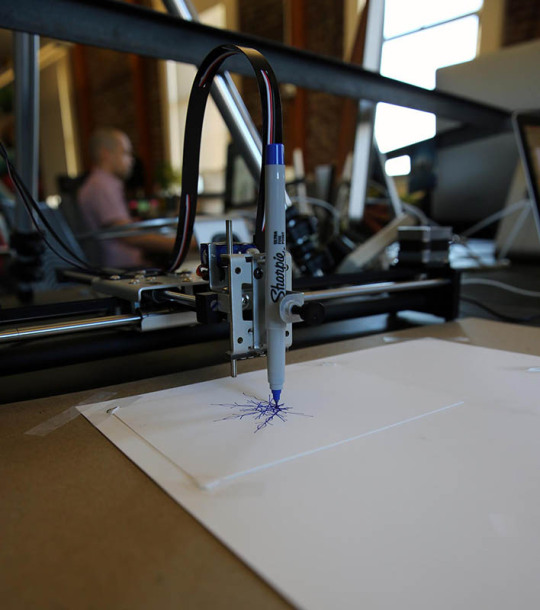
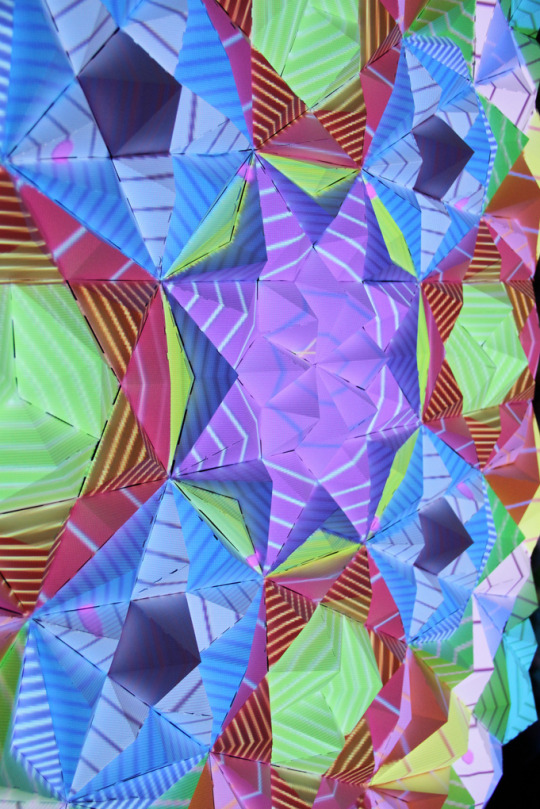
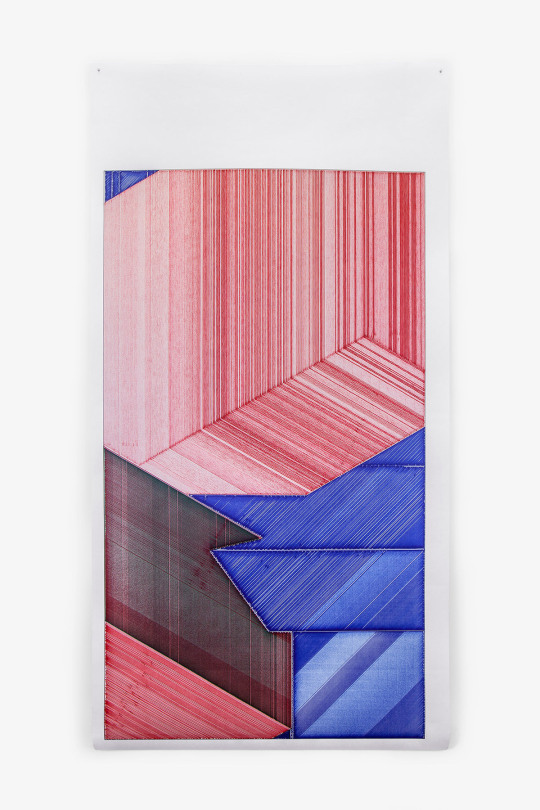
“Created by Miguel Nóbrega, Possible, Plausible, Potential is a set of three series of isometric drawings generated by code and printed with colored markers on a plotter machine. In these drawings, Miguel explores a bridge between the iterative aspect of algorithms and the utopian aspect of modern architecture. Each drawing is a unique variation of the same set of rules and carefully placed random decisions.”
This concept is cool because the code is enabling potentialy unrealistic architectural concepts to be rendered. The code liberates the design from reality and drives the design. I can definitely see the benefits of this as sometimes you need that element of randomness, or a fresh perspective to give something new or suprising. Code, as seen here, can be more than just a material to create with - I guess it is able to act as a second creator in itself.

vimeo
0 notes
Text
TERMS
Generative
Generative art refers to art that in whole or in part has been created with the use of an autonomous system (Wikipedia).
Generative art is art made using a predetermined system that often includes an element of chance – is usually applied to computer based art. The practice has its roots in dada, yet it was the pioneering artist Harold Cohen who was considered one of the first practitioners of generative art when he used computer-controlled robots to generate paintings in the late 1960s. (Tate)
Parametric
Parametric design is a process based on algorithmic thinking that enables the expression of parameters and rules that, together, define, encode and clarify the relationship between design intent and design response.
Parametric design is a paradigm in design where the relationship between elements is used to manipulate and inform the design of complex geometries and structures. (Wikipedia)
Data Visualisation
Data visualization refers to the techniques used to communicate data or information by encoding it as visual objects. (Wikipedia)
Digital Fabrication
Digital modeling and fabrication is a process that joins design with production through the use of 3D modeling software or computer-aided design (CAD) and additive and subtractive manufacturing processes. (Wikipedia)
0 notes