
lupinepublishers-ado
Lupine Publishers - ADO
Journal of Diabetes and Obesity: which covers high quality of manuscripts which are both relevant and applicable to the broad field of applied life sciences. Journal aims to reflect contemporary thinking so that professionals can keep pace with the developments in the field of Diabetes & Obesity
179 posts
Don't wanna be here? Send us removal request.
Last Seen Blogs

suuartpotato
Dummydum_suu

butinanironicway
Quick, laugh like I said something funny

dru-c-alba
Dru C. Alba

bimdesigners
Building Information Modelling

padcorp01
Padcorp
Text
Semaglutide versus liraglutide for treatment of obesity
Abstract
Background: Once weekly (OW) semaglutide is a glucagon-like peptide-1 receptor agonist (GLP-1 RA) currently under evaluation for treatment of obesity at a dose of 2.4 mg OW.
Objective: To compare weight-loss efficacy and safety of once daily (OD) liraglutide 3.0 mg versus OW semaglutide 2.4 mg. Methods: Pubmed research up to March 31, 2021. Randomized trials, pertinent animal studies, and reviews are included. Search terms were glucagon-like peptide-1 receptor agonists, weight loss, obesity, liraglutide, semaglutide, efficacy, safety.
Results: No head to head trials are available to provide direct comparison of efficacy of OD liraglutide 3.0 mg versus OW semaglutide 2.4 mg. However, marked resemblance between trials in terms of study protocols and subjects’ characteristics may allow indirect comparison. In clinical trials of OW semaglutide, this drug was consistently associated with greater weight loss than in trials of OD liraglutide. Thus, placebo-corrected percentage weight reduction was -10.3 to -12.4% and -5.4% with OW semaglutide and OD liraglutide, respectively. In patients with type 2 diabetes, corresponding weight reduction was less pronounced with both drugs being -6.2% and -4.3% with OW semaglutide and OD liraglutide, respectively. In addition, head to head trials comparing liraglutide and semaglutide used in different doses and formulations consistently showed more weight loss in favor of semaglutide. In general, the anti-hyperglycemic efficacy and safety profile are similar in both drugs.
Conclusions: Available indirect evidence suggests that OW semaglutide 2.4 mg may be superior to OD liraglutide 3.0 mg for weight loss. Head-to-head comparison between these 2 agents is essential to confirm this conclusion.
Keywords: Obesity; Liraglutide; Semaglutide; Glucagon-like Peptide-1; Efficacy; Safety; Weight Loss; Type 2 Diabetes; Hemoglobin A1c
Introduction
GLP-1 RAs are approved for treatment of type 2 diabetes. The drug profile of these drugs is characterized by mild dose-related weight loss of approximately 2-6 kg [1]. Currently, liraglutide is the only GLP-1 RA approved for treatment of obesity in a dose higher than that approved for type 2 diabetes (3.0 mg daily for treatment of obesity as opposed to a maximum dose of 1.8 mg/d in type 2 diabetes) [2]. Semaglutide is another GLP-1 RA approved for treatment of type 2 diabetes in a dose of 0.5-1.0 mg given subcutaneously OW and as an oral formulation in a dose up to 14 mg once daily [3,4]. Currently, semaglutide is under evaluation for future approval for treatment of obesity. The Semaglutide Treatment Effect in People with obesity (STEP) development program including 5 phase 3 clinical trials (STEP 1 to 5) was launched to evaluate efficacy and safety of OW semaglutide at this high dose of 2.4 mg for treatment of obesity in patients with and without diabetes [5].
Mechanisms of Weight Loss by Liraglutide and Semaglutide
In general, the mechanisms of weight loss by liraglutide and semaglutide are similar. Both agents were shown to reduce appetite and hunger while increasing sense of fullness and satiety [6,7]. In addition, OW semaglutide 2.4 mg, but not liraglutide, may decrease food craving [7]. Animal studies have shown that the anorexigenic effect of semaglutide is mediated by GLP-1 receptors in the hypothalamus and hind brain [8,9]. Delay in gastric emptying, a class effect of all GLP-1 RAs, may contribute to the sensation of early fullness [10]. Meanwhile, one study with relatively longfollow- up (52 weeks) has shown that improvements in hunger and fullness with OD liraglutide 3.0 mg peak after 4 weeks, then decline gradually and return to baseline after 40 weeks [6]. Similar followup studies are not available for semaglutide.
STEP Program of Semaglutide
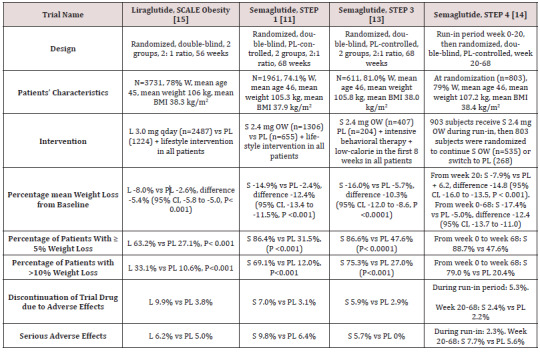
STEP 1 to 4 trials are well-designed studies comparing OW 2.4 mg semaglutide with placebo in obese individuals (defined as BMI of ≥ 30 kg/m2, over ≥ 27 kg/m2 with ≥ 1 weight-related coexisting condition e.g. hypertension, dyslipidemia, cardiovascular disease, or obstructive sleep apnea) for 68 week-duration [11-14]. STEP 1, 3 and 4 excluded patients with diabetes, whereas STEP 2 included exclusively patients with type 2 diabetes [11,13-14]. In addition, STEP 2 included a third group of individuals randomized to the smaller anti-diabetic dose of OW semaglutide 1.0 mg [12]. In STEP 1, 2 and 4, all participants receive lifestyle intervention defined as a 500 kcal deficit relative to the estimated energy expenditure plus encouragement of increase physical activity, such as walking 150 minutes per week. In STEP 3 trial, all subjects received a low-calorie diet (1000-1200 kcal/d) provided as meal replacement for the first 8 weeks. Subsequently, they were transitioned to a low-calorie diet (1200-1800 kcal/d) of conventional food. Moreover, they were prescribed 200 min of physical activity/week [13]. The coprimary endpoints of STEP 1 to 3 trials were the percentage change in body weight and weight reduction of at least 5% at week 68 compared with placebo [11-13]. STEP 4 trial was a withdrawal trial that includes an initial run-in period of 20 week during which all subjects received OW semaglutide 2.4 mg followed by randomization to a group that continued the drug and another group that switched to placebo for further 48 weeks [14]. Overview of STEP 1 to 4 trials are summarized in (Tables 1 and 2).
Table 1: Weight-loss efficacy of liraglutide and semaglutide in patients without diabetes.
Abbreviations: W: Women; BMI: Body Mass Index; L: Liraglutide; S: Semaglutide; OW: Once Weekly; PL: Placebo; HbA1c: Hemoglobin A1c; CI: Confidence Intervals
Table 2: Weight-loss efficacy of liraglutide and semaglutide in patients with type 2 diabetes
Abbreviations: PL: Placebo; W: Women; HbA1c: Hemoglobin A1c; L : Liraglutide; OWS: Once-Weekly Semaglutide
Weight loss in Semaglutide and Liraglutide Trials
While no head to head trials are available to compare weight loss efficacy of OW semaglutide 2.4 mg with OD liraglutide 3.0 mg, indirect comparison may be inferred from results of their respective trials. In fact, as shown in tables 1 and 2, subjects’ characteristics at baseline in these trials were similar to a great extent (Table 1). In addition, the study protocols and designs have several common features (e.g. similar primary end point). In STEP trials 1, 3 and 4 that excluded patients with diabetes, the difference in weight loss between OW semaglutide and placebo ranged between -10.3% and -12.4% at 68 weeks (Table 1). Meanwhile, in the SCALE Obesity and prediabetes trial of OD liraglutide 3.0 mg, the corresponding difference was -5.4% (95% CI, -5.8 to -5.0%) at 56 weeks (Table 1) [15]. In trials that exclusively recruited patients with type 2 diabetes, the weight loss efficacy of both drugs was diminished, but was still relatively greater in OW semaglutide 2.4 mg than with OD liraglutide 3.0 mg. Thus, in 2 liraglutide diabetes trials, the mean difference in weight loss between the drug and placebo was -4.0 and -4.3%, whereas the corresponding difference was -6.2% with OW semaglutide 2.4 mg (Table 2) [12,16-17]. The explanation of this finding is unclear but might be related to the coexistence of type 2 diabetes, relatively older patient population (mean age approximately 55 year-old in diabetes trials versus 45 year-old in trials excluding diabetes), or the lower baseline body weight (approximately 99.8 kg in diabetes trials versus approximately 105.5 kg in non-diabetes trials) (Tables 1-2) [12,16-17]. Other parameters that suggest superiority of OW semaglutide 2.4 mg over OD liraglutide 3.0 mg are the proportions of individuals losing ≥ 5% and > 10% of body weight. These proportions were always higher in trials of semaglutide than in those of liraglutide (Tables 1 and 2).
Head to Head Trials of Semaglutide Versus Liraglutide
Another indirect line of evidence suggesting greater efficacy of semaglutide compared to liraglutide may be derived from 3 randomized head to head trials comparing the 2 agents in different doses and formulations. A randomized, placebo-controlled, doubleblind trial [18] compared semaglutide in 5 daily subcutaneous doses (0.05, 0.1, 0.2, 0.3, and 0.4 mg) versus liraglutide 3.0 mg once daily on top of lifestyle changes in obese subjects without diabetes. After 52 weeks, mean weight reduction from baseline was significantly greater in patients randomized to semaglutide doses ≥ 0.2 mg daily being - 11.2 to -13.8% versus -7.8% in subjects randomized to liraglutide 3.0 mg daily [18]. The second trial including patients with type 2 diabetes [19] compared oral semaglutide (14 mg qday) with OD liraglutide 1.8 mg in doubleblind double-dummy fashion. After 26 weeks, oral semaglutide resulted in superior weight loss (-4.4 kg) compared with liraglutide (-3.1 kg), estimated difference -1.2 kg (95% CI, -1.9 to -0.6, P= 0.001) [19]. The third trial [20] compared OW semaglutide 1.0 mg with liraglutide 1.2 mg in patients with type 2 diabetes in an open-label design. After 30 weeks, mean weight loss was -5.8 kg and -1.9 kg, in the semaglutide and liraglutide groups, respectively; estimated treatment difference -3.8 kg (95% CI, -4.47 to -3.09, P<0.0001) [20]. Taken together, the results of the preceding 3 trials suggest higher efficacy of semaglutide than liraglutide irrespective of doses or drug formulation (i.e. subcutaneous or oral semaglutide).
Anti-Hyperglycemic Efficacy of Liraglutide Versus Semaglutide
The difference between semaglutide and liraglutide with respect to their anti-hyperglycemic efficacy is not as consistent as in their weight-loss effects. Thus, in the studies conducted by O’Neil et al, [18] and Pratley et al [19], semaglutide was similar to liraglutide in HbA1c reduction. Meanwhile, in the trial conducted by Capehorn et al, [20], OW semaglutide 1.0 mg was superior to liraglutide 1.2 mg qday; estimated treatment difference in HbA1c reduction was - 0.69% in favor of semaglutide. However, the latter trial is limited by its open-label design and using liraglutide in submaximal antidiabetic dose (1.2 mg instead of 1.8 mg) [20]. Therefore, while semaglutide may be more effective than liraglutide in causing weight loss, both GLP-1 RAs may be equally effective in terms of glycemic control.
Effects of Semaglutide and Liraglutide on Cardiovascular Variables
Significant reduction in systolic blood pressure (SBP) was recorded in subjects randomized to semaglutide in STEP 1-3 trials, approximately 4-5 mmHg lower than in individuals randomized to placebo [11-13]. Likewise, a significant reduction in DBP of approximately 2 mmHg was observed in STEP 1 and 3 trials [11,13]. Changes in lipid panel were generally mild. Thus, reduction in plasma triglycerides of 14-17% compared to placebo was the most consistent change in lipid panel. Minor reductions in concentrations of low-density lipoprotein-cholesterol (LDL-C) (by ≤7% vs placebo) and increase in high-density lipoprotein-cholesterol (HDL-C) levels (by <5% vs placebo) were also observed. In addition, there was significant reduction in the inflammatory marker C-reactive protein (CRP) levels in semaglutide-treated subjects vs placebo [11-13]. Similar beneficial changes in the above cardiovascular (CV) markers were described in liraglutide trials albeit they were lesser in magnitude [15,21]. The above favorable changes in blood pressure, lipids and CRP are likely attributed to weight loss per se and are unlikely to be direct effects of semaglutide or liraglutide.
Safety of Liraglutide and Semaglutide as Anti-Obesity Agents
Gastrointestinal Adverse Effects
Gastrointestinal (GI) adverse effects represent the most common adverse events that characterize all GLP-1 RAs. In liraglutide obesity trials, GI adverse events occurred in 65% and 39% of subjects randomized to OD liraglutide 3.0 mg and placebo, respectively [16]. In STEP 1-3 trials of semaglutide, GI adverse effects were reported by approximately 63-83% and 34-63% in subjects randomized to OW semaglutide and placebo, respectively [11-13]. Among the GI adverse effects, nausea was the most common, followed by diarrhea, vomiting and constipation [11-13,16]. The frequency of GI symptoms increased early in the first few weeks during drug titration. They were generally described as mild to moderate and transient. However, in a minority of patients, they can be severe. In fact, GI adverse effects were the most frequent cause of premature drug withdrawal. Thus, in the largest obesity trial of liraglutide, drug discontinuation due to GI adverse effects occurred in 6.4% and 0.7% in the liraglutide and placebo group, respectively [15]. In STEP trials, withdrawal due GI adverse events occurred in 3.4-4.5% and 0-1.0% in patients randomized to OW semaglutide and placebo, respectively [11-13]. Previous trials including patients with type 2 diabetes using OW 1.0 mg semaglutide have shown that GI adverse effects tend to be more common with semaglutide compared with other GLP-1 RAs [1]. Meanwhile, post-hoc analysis by Lingway et al [1] suggest that GI adverse effects contribute minimally (less than 0.1 kg) to the superior weight loss effects of semaglutide vs other GLP-1RAs. Incidence of cholelithiasis and cholecystitis was slightly higher with liraglutide than placebo, 1.5% and 0.4%, respectively [15] as well as with semaglutide than with placebo, 2.5-2.6% versus 0-1.2% [11-13]. These events may be attributed in part to weight loss, but other mechanisms could be involved such as inhibition of gallbladder contraction and biliary motility [22]. Frequency of acute pancreatitis is marginally elevated with OD liraglutide 3.0 mg (1.3% vs 1.0 in placebo) [21], and similar to placebo in trials of OW semaglutide 2,4 mg in STEP 1 to 4 trials [11-14].
Hypoglycemia
Consistent with the glucose-dependent action of GLP-1 RAs, frequency of hypoglycemia was similar to placebo in patients without diabetes. However, in obesity trials including patients with type 2 diabetes, frequency and severity of hypoglycemia were increased with use of OD liraglutide 3.0 mg (87 versus 31 events per patients-year with placebo) [16]. These hypoglycemia events occurred mainly in patients using sulfonylureas [16]. In STEP 2 trial, severe or blood-glucose confirmed symptomatic hypoglycemia occurred in 5.7% and 3.0% of patients receiving OW semaglutide 2.4 mg and placebo, respectively [12].
Safety Concerns about Liraglutide and Semaglutide
There was numerical increase in breast neoplasms in association with OD liraglutide 3.0 mg. Thus, 10 premalignant and malignant neoplasms were reported in 9 women in the liraglutide arm versus none in the placebo arm [21]. In STEP 4 trial of OW semaglutide 2.4 mg, 3 breast cancers were diagnosed in women randomized to semaglutide versus none in the placebo group [13]. Worsening diabetic retinopathy seems to be an adverse effect specific to semaglutide which was initially observed in association with use of OW semaglutide 0.5-1.0 mg [23]. In STEP 2, there was a trend towards increase in incidence of retinal disorder events in the 2 semaglutide arms compared with the placebo arm [12]. Thus, these events occurred in 6.9%, 6.2%, and 4.2% in patients randomized to OW semaglutide 2.4 mg, OW semaglutiude 1.0 mg, and placebo, respectively [12].
Appraisal of Liraglutide and Semaglutide
Although available data suggest that OW semaglutide 2.4 mg may be more effective than daily liraglutide 1.8 mg in weight reduction, both drugs offer several advantages for management of obesity. First, their short-term efficacy and safety are supported by well-designed randomized trials [11-15]. Second, being also wellstudied as anti-diabetic drugs, they may be particularly useful in obesity-related type 2 diabetes by causing reduction of both body weight and hyperglycemia [12]. Furthermore, in individuals with pre-diabetes, they delay the onset of type 2 diabetes and increase reversion to normoglycemia [15,21]. The OW administration of semaglutide might virtually enhance compliance with prolonged use. However, both agents have several limitations. First, the common occurrence of GI adverse effects which not uncommonly lead to drug discontinuation. Second, safety beyond 58 weeks is not available for OW semaglutide 2.4 mg [11-14]. The ongoing STEP 5 may in part clarify this problem as it extends over a 2-year period [5]. In case of OD liraglutide 3.0 mg, safety data from placebocontrolled trials are overall reassuring and extend up to 172 weeks [21]. Third, the durability of the weight loss effect is still unclear. In fact, maximum weight loss with use of either drug was achieved after approximately 52 weeks followed by a gradual rebound [11- 15, 21]. Moreover, after drug cessation, weight regain takes place at a more rapid pace along with rise of systolic blood pressure and glycemic parameters to their baselines [14,16]. Hence, these drugs will be taken for years, or even decades as long as weight loss is desired. It is crucial therefore to establish their long-term safety. Fourth, drug cost is another limitation. Advantages and limitations of both agents are summarized in Table 3.
Table 3: Advantages and limitations of liraglutide and semaglutide for treatment of obesity.
Conclusions and Current Directions
Available clinical trials suggest that OW semaglutide 2.4 mg as an adjunct to healthy life-style changes may be more effective than OD liraglutide 3.0 mg in terms of weight reduction, but not glycemic control. While no head to head comparison is available yet, data derived from respective trials of liraglutide and semaglutide showed superior weight loss with use of OW semaglutide 2.4 mg. Furthermore, head to head comparison of the 2 drugs used in different doses or formulations, consistently showed greater weight loss associated with the use of semaglutide than with liraglutide. However, the superiority of OW semaglutide 2.4 mg will only be confirmed by direct head to head comparison with OD liraglutide 3.0 mg in the setting of randomized, double-blind and double-dummy trials. The possible increase in incidence of breast cancer in association with these 2 agents must be clarified in long-term studies and post-marketing investigations. Similarly, risk of worsening of diabetic retinopathy in relation to the use of semaglutide should be carefully examined. Whereas both drugs in their anti-diabetic doses may reduce CV events in patients with type 2 diabetes, it is equally important to assess their impact on CV outcomes when used in their higher doses for treatment of obesity. In this regard, the SELECT study is an ongoing, double-blind placebo-controlled trial specifically designed to examine the effect of OW semaglutide 2.4 mg on CV outcomes in overweight and obese persons with established CV disease who do not have diabetes [17]. SELECT study started in November 2018 and is expected to recruit 17,500 participants, and last for approximately a total of 59 months.
Read More About This Article Click on Below Link:
https://lupinepublishers.com/diabetes-obesity-journal/fulltext/semaglutide-versus-liraglutide-for-treatment-of-obesity.ID.000162.php
Read more Lupine Publishers Google Scholar Articles : https://scholar.google.com/citations?view_op=view_citation&hl=en&user=nqY8h-kAAAAJ&citation_for_view=nqY8h-kAAAAJ:-f6ydRqryjwC
#Lupine Publishers#Lupine Publishers Group#ADO#Journal of Diabetes#Archives of Diabetes and obesity Journal#Journal of Obesity
0 notes
Text
Blissful Thanksgiving!!!

Greetings from ADO
Wishing you a harvest of blessings, good health and good times. Happy Thanksgiving day!
#Lupine Publishers#Lupine Publishers Group#Archives of Diabetes and Obesity#Journal of Diabetes and Obesity#ADO
0 notes
Text
Lupine Publishers| Effectiveness, Safety and Therapeutic Adherence of Weekly Subcutaneous Semaglutide for Weight Management in Real Practice: An Observational Study
Lupine Publishers| Journal of Diabetes and Obesity
Abstract
Aims: To evaluate in a real practice setting effectiveness, safety and adherence to weekly subcutaneous semaglutide for weight reduction, along with diet and lifestyle modifications in obese/overweighted patients attending an Obesity Unit.
Materials and Methods: In a retrospective study, 367 patients (mean age 50.25 years, 78.36% female, mean baseline body mass index 32.39 kg/m2) were followed for 10.7 months (median) after initiation of semaglutide. Up to 24.25% of patients were previously on GLP-1 analogue therapy (mostly liraglutide) and 36.26% used background oral medication for weight loss.
Results: At final office visit patients averaged a weight loss of 7.97±3.42 kg (9.13±3.86% baseline body weight) and 88.07% and 30.27% of patients had achieved a≥5% and ≥10% weight loss, respectively, as compared to baseline body weight. Up to 61.19% and 33.46% of patients maintained 0.5 and 1.0 mg dose, respectively and 86.18% of patients persisted on sc semaglutide by last office visit. Nausea and abdominal pain were reported by 12.53% of patients with no severe adverse events. Background antiobesity medication did not affect weight loss and patients on previous GLP-1 analogue therapy lost 1.43 kg less than naïve patients (p<0.001).
Conclusions: Out-of-label weekly administration of sc semaglutide 0.5 to 1.0 mg resulted in a significant, safe and affordable weight loss in a pragmatic setting without reimbursement of treatment cost. Magnitude of weight loss and safety profile was in line with preliminary data from a phase 2 trial, although this will need to be confirmed by an ongoing phase 3 development programme.
Keywords: Observational Study; Obesity Therapy; GLP-1 Analogue; Semaglutide; Appetite Control Antiobesity Drug
Introduction
Obesity has become a major public health issue worldwide, and its prevalence is growing so uncontrolled that over the past 20 years, the rate of obesity has risen three-fold and is affecting more than 30% of population in some European countries [1]. Major health institutions recognize now obesity as a complex, multifactorial condition [2,3], associated to a number of comorbidities, including metabolic, mechanical and mental health complications that significantly impact both quality of life [4,5] and life expectancy of affected population [6]. On the other side, treatment cost of complications derived from obesity represents a formidable burden for health public systems in many countries [7,8]. Conversely, a weight loss of 5-10% of body mass reduces obesity-related complications and improves quality of life [9,10], although this goal is difficult to achieve and maintain only with diet and lifestyle interventions [11,12]. Few safe and effective drugs are currently available for the treatment of obesity. Among them, glucagon-like peptide 1 (GLP-1) receptor agonists have proven a combined effect on glucose metabolism and reduction in body weight associated to favourable outcomes in patients with type 2 Diabetes and coexisting obesity, including reduction of cardiovascular events for some of them [13-15].
Liraglutide, a once daily administered GLP-1 analogue was initially approved for treatment of patients with type 2 Diabetes at a dose of 1.2 to 1.8 mg, and subsequently gained approval for weight reduction in many countries, at a maximum daily dose of 3.0 mg, in combination with diet and lifestyle modifications [16-17]. Subcutaneous (sc) semaglutide, a longer-acting GLP-1 analogue was approved in Spain in 2019 for treatment of type 2 Diabetes with a weekly administration of 0.5 or 1.0 mg, and conditions for reimbursement by Spanish public health system include coexistence of obesity. Both drugs have proven clinically significant weight reductions in obese patients without type 2 Diabetes and a clinical development program is currently undergoing aiming to gain indication for sc semaglutide in weight management [18-19]. In this observational retrospective study, performed under real practice conditions, we aimed to evaluate effectiveness, safety and adherence to weekly administration of sc semaglutide in a nonreimbursed setting in patients with obesity or overweight attending an Obesity Unit in a private institution in Mallorca (Spain), along with dietary and lifestyle recommendations.
Patients and Methods
In this retrospective study, patients attending our Obesity Unit who started on sc semaglutide since May 2019 were consecutively invited to take part in the study and after giving written informed consent, were included for analysis. Inclusion criteria were patients 18-year-old or older, with a body mass index (BMI) >25 kg/m2, and at least one follow-up office visit after initiation of sc semaglutide. A total of four follow-up visits after baseline visit were included in this study, to ensure for at least a 6-month follow-up period. Patients with a previous diagnosis of type 2 Diabetes Mellitus were excluded from participation in this study. The study protocol was approved by the reference Hospital Ethics Committee (University Hospital Son Espases).
A total of 372 patients were consecutively included in the study. All patients were prescribed sc semaglutide with an out-of-label indication for weight reduction, as part of a structured program for the management of overweight and/or obesity that included diet and exercise counselling. A number of patients had been previously or currently prescribed drugs with an approved indication for weight management (GLP-1 analogue liraglutide and lipase inhibitor orlistat) or a clinical indication for weight management yet out of label, as other GLP-1 analogues (dulaglutide, exenatide LAR), selective serotonin reuptake inhibitors (SSRI), and topiramate. Diet counselling included a structured quantitative dietary recommendation with an average 500 kcal/day reduction from calculated baseline metabolic rate. Standardized Harris-Benedict’s equations corrected for Lang’s daily activity coefficient were used to calculate baseline metabolic rate. In line with Spanish Health Authorities policy, sc semaglutide prescription for overweight or obesity management is not reimbursed, and all patients paid for this out-of-pocket prescription accordingly.
Height, weight, and BMI were recorded as baseline variables at initial visit. Also, concomitant use of drugs with a potential to reduce weight including topiramate, orlistat, SSRIs and current or previous use of other GLP-1 analogues in the last 6 months previous to index date was also registered. At initial visit, sc semaglutide was started at a dose of 0.25 mg once weekly according to label instructions, but subsequent dose titration was left to physician’s judgement based upon effectiveness and Gastrointestinal (GI) intolerance (namely, incidence of nausea, vomiting or abdominal pain). Patients in this unit are regularly followed-up with office visits every 4-12 weeks, and weight, current sc semaglutide dose, use of background medications for weight loss, incidence of adverse events and persistence on sc semaglutide were systematically recorded at each visit and included for analysis. Safety data included serious adverse events, incidence of GI intolerance and incidence of other adverse events.
Primary effectiveness outcome in this study was absolute and percentage weight loss from baseline after initiation of sc semaglutide until last follow-up visit. Secondary objectives included persistence on sc semaglutide and drug dose, evaluated at each follow-up visit, incidence of non-serious/serious adverse events and/or GI adverse events, proactively requested to patients, and change in background use of drugs for weight loss. Subgroup analysis evaluated influence of previous GLP-1 analogues therapy and background use of anti-obesity drugs in weight loss.
Statistical Analysis
Primary and secondary outcomes analysis was performed for patients attending the last office visit. Subgroup analysis for previous use of GLP-1 analogues and use of anti-obesity medication included all patients with at least one follow-up office visit (last observation carried forward). All data are expressed as mean ± Standard Deviation (SD) for continuous variables and as percentage for categorical variables. Normally distributed variables were compared using two-sided T-Student test and categorical variables were compared using Chi-square test. A p value <0.05 was assumed as statistically significant for all comparisons (Statplus statistical package 2016©, AnalystSoft, Walnut, CA).
Results
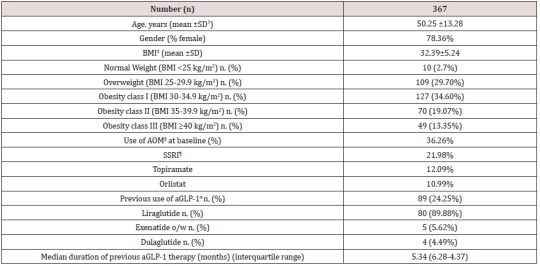
Table 1 shows baseline characteristics of patients included in this study. A total of 367 patients completed a first follow-up visit. On average, patients had a mean age of 50.25 years and a wide majority of them were females (78.36%). Mean BMI was 32.39±5.24 kg/ m2, with a balanced distribution among patients with overweight (29.7%), class I obesity (37.32%) class II and III obesity (together, 32.42%). Up to 36.26% patients were on previous pharmacological treatment for obesity, mostly SSRI agents, topiramate and orlistat, and up to 24.25% of this population initiated sc semaglutide switching from a previous GLP-1 analogue therapy, either currently in use or in the previous 6 months. In most cases (89.88%) previous GLP-1 analogue was liraglutide with an average daily dose of 1.48 mg. Median duration of previous aGLP-1 therapy was 5.34 months and mean (±SD) weight reduction achieved was 3.25 ±5.32 Kg (Table 2). Up to 32.01% of patients in this subgroup had achieved a ≥5% weight loss with previous aGLP-1 therapy.
Table 1: Baseline characteristics of patients.
ꝉSD: Standard Deviation ‡BMI: Body Mass Index §AOM: Anti-obesity Medication ¶SSRI: Selective Serotonine Re-uptake Inhibitor αaGLP-1: Glucagon-like Peptide 1 against.
Table 2: Weight reduction throughout follow-up.
ꝉSD: Standard Deviation §AOM: Anti-obesity Medication *p<0.05 vs. baseline (Chi-square test)
Weight Reduction
Table 3 and (Figures 1&2) show changes in BMI and body weight throughout consecutive office visits. After a median followup of 10.7 months up to 311 patients attending the last office visit, achieved a weight loss of 7.97±3.42 kg (9.13±3.86% of baseline body weight), and weight loss was achieved gradually in a timedependent fashion. By the end of study observation period, 88.07% and 30.27% of patients had achieved a ≥5% and ≥10% weight loss, respectively, as compared to baseline body weight.
Table 3: Weight reduction (LOCF)* according to previous use of GLP-1 analogues
*LOCF: Last observation carried forward ꝉSD: Standard Deviation ‡BMI: Body Mass Index §AOM: Anti-obesity Medication
Figure 1: Evolution of BMIα after initiation of sc Semaglutide*. αBMI: Body mass index expressed in Kg/m2 *Expressed as median values. Bars represent ± standard deviation.
Figure 2: Absolute and Percentage weight loss after initiation of sc semaglutide*. *Expressed as median values. Bars represent ± standard deviation.
Tables 3 and 4 show changes in body weight according to previous use of GLP-1 analogue therapy and concomitant use of anti-obesity drugs, respectively. As stated before, up to 24.25% patients had switched to sc semaglutide from treatment with a GLP-1 analogue in the previous six months, mostly liraglutide. This subgroup of patients had achieved a previous weight reduction of 3.25 ±5.32 Kg after a median follow-up of 5.34 months (interquartile range, 4.12-6.57 months). Patients without previous use of a GLP-1 analogue, reduced significantly more weight than patients switching from a previous GLP-1 analogue to sc semaglutide, after a similar follow-up period (last observation carried forward); 6.51±2.79 kg (7.42% of baseline body weight) vs. 5.08±2.52 kg (5.58%), respectively (p<0.001). No differences were found for concomitant use of other anti-obesity medications and persistence on sc semaglutide was quite similar between both groups (Table 3). Conversely, sub analysis of weight reduction according to concomitant use of any anti-obesity medication did not yield any significant differences between both subgroups, neither in baseline BMI, nor in the magnitude of weight loss (last observation carried forward), or in the persistence on sc semaglutide (Table 4).
Table 4: Weight reduction (LOCF)* according to previous use of anti-obesity medication
*LOCF: Last observation carried forward ꝉSD: Standard Deviation ‡BMI: Body Mass Index
Table 5: Safety and tolerability of sc semaglutide
*GI (Gastrointestinal) intolerance included nausea, vomiting, abdominal pain or diarrhoea. ꝉOne patient admitted to hospital for urinary sepsis, one patient diagnosed of gross bowel cancer and one patient with myocardial infarction.
Therapeutic Persistence, Drug Dose and Background Anti-Obesity Medication Use
A total of 311 patients did attend the fourth and last office visit included in this study (84.74%). Persistence on sc semaglutide was high throughout consecutive office visits, with up to 268 patients out of 311 (86.18%) attending the last office visit being persistent to the drug. Up to 61.19% of patients remained on an initially prescribed semaglutide dose of 0.5 mg (after initial up titration) throughout consecutive office visits and 33.46% of patients were on the 1.0 mg dose by the last office visit. Concomitant use of other anti-obesity drugs remained unchanged throughout follow-up visits, and only in the last office visit a statistically significant 7.45% reduction in use of other agents was detected, mostly affecting orlistat use.
Safety and Tolerability
Regarding safety, few severe adverse events were reported throughout the follow-up period. A 66 year-old female was admitted to hospital due to urinary sepsis, a morbid obese 54 year-old male patient was diagnosed of gross bowel cancer requiring surgery and a 61 year-old patient suffered a non-lethal myocardial infarction. Additionally, a patient accidentally administered 5 consecutive daily doses of 0.25 mg of sc semaglutide and reported on nausea and vomiting during two days, but her condition improved after stopping the medication, and after two weeks, the patient resumed correctly weekly administration of sc semaglutide. A total of 66 patients (17.98%) complained on GI symptoms at initial follow-up visit, and this percentage did reduce significantly in subsequent follow-up visits (Table 5). Most of these patients complained of nausea and abdominal pain, that in some cases deserved transient interruption of medication or use of omeprazole, and in 14 patients led to definitive interruption of medication. Other reasons for treatment abandonment included lack of effectiveness or inability to afford for treatment costs, as reported by up to 19 patients. A patient with a baseline BMI of 42.3 kg/m2 was derived to bariatric surgery after 3 months of sc semaglutide 1.0 mg, with a weight loss of 5.3 kg from baseline.
Discussion
In this observational study we evaluated weight reduction associated to out-of-label use of sc semaglutide in a patient population with overweight or obesity as part of a pragmatic strategy for weight management including diet and physical activity counselling, and in selected cases prescription of drugs with a potential for weight loss. Patients included in this study represent an average profile of patients typically attending an obesity clinic in a private setting; middle aged patients with a high proportion of women and an average baseline BMI >30 kg/m2. Conversely, we found a lower percentage of patients with morbid obesity, as compared to Spanish public health system obesity units, were most patients are morbid obese and referred to for consideration of bariatric surgery [20]. A substantial proportion of patients included in this study were previously on pharmacological therapy for weight loss. In Spain, according to the 2016 official position statement by the Spanish Society for the Study of Obesity (SEEDO) [21], only lipase inhibitor orlistat, combination of opioid receptor antagonist/antidepressant naltrexone/bupropion and GLP-1 agonist liraglutide are approved drugs for medium and longterm obesity management in patients with a BMI >30 kg/m2 or >27 kg/m2 with major comorbidities, when a structured program including diet and lifestyle changes fails to promote a weight loss >5% after 3 to 6 months of follow-up. Conversely, the 2016 clinical practice guidelines for medical care of patients with obesity issued by the American Association of Clinical Endocrinologists and the American College of Endocrinology (AACE/ACE) [22] include lorcaserin, phentermine/topiramate ER (extended release) combination and SSRI therapy for selected patients as medications for chronic weight management.
Taking in mind the strong correlation between obesity and depressive mood disorder [23,24], it is not surprising that up to 21.98% of our patients were on SSRI (mostly fluoxetine) and in some cases with a coexisting indication for binge eating disorder or night eating syndrome. Eighty-nine patients in this study were using or had used in the past six months a GLP-1 analogue for weight reduction. Liraglutide was by far the most frequently used drug with an average daily dose of 1.48 mg which is lower than the approved dose of 3.0 mg od for weight reduction. Lack of reimbursement by Spanish public health system for liraglutide in obese subjects plays probably an important role in this low average dose used by patients, as treatment cost is directly dose-dependent. This issue has been acknowledged as a mayor limitation for treatment accessibility in our country, as stated by SEEDO guidelines [21]. Nevertheless, despite this low dose, patients on liraglutide achieved an average weight loss of 3.25 kg, accounting for >3% of baseline weight, after a median period of 5.34 months. Interestingly, the clinical development program for liraglutide LEAD (Liraglutide Effect and Action in Diabetes) included 4,456 patients with type 2 Diabetes with an average baseline BMI of 31.83 kg/m2, and age 55.87 years old. Weight loss associated to liraglutide 1.2 and 1.8 mg ranged 2.3 to 2.8 kg, respectively, after 26 to 52 weeks [25-30]. A similar baseline BMI in an older population was associated to a lower weight loss as compared to patients in our study. A possible explanation for this could be differences in age, as Mezquita et al., demonstrated in their liraglutide survey Diabetes Monitor [31]. In this real-world web-based survey, patients with type 2 Diabetes under 50 years old lost significantly more weight as compared to patients over 60 years old. Nevertheless, potential differences in the response to GLP-1 analogues in a population without Diabetes cannot be excluded, as clear differences in GLP-1 biology in patients with type 2 Diabetes as compared to normal individuals have been detected [33], namely reduction of GLP-1 secretion in response to oral intake and reduction of insulinotropic potency of GLP-1 [34,35].
Patients in our study gradually achieved a clinically significant weight loss of 7.97 kg by the last office visit, accounting for 9.13% of initial body weight, after a median follow-up of 10.7 months. By the end of the study, 88.07% and 30.27% of patients attending the last office visit included in the observation period had achieved a ≥5% and ≥10% weight loss, respectively. According to SEEDO guidelines [21], a sustained weight loss of 3-5% of body weight is associated to clinically significant improvements in metabolic factors like blood glucose and plasma lipid concentrations, and reduces risk for development of Diabetes, with higher weight loss having the potential to reduce long-term cardiovascular complications. Conversely, AACE/ACE guidelines for obesity management recommend a weight-loss goal of 5-10% (≥15% in some circumstances) to induce improvements of comorbidities associated to overweight or obesity [22].
Interestingly, most patients included in the study remained in the 0.5 mg ow dose, and only 33.46% of patients increased to the 1.0 mg ow dose at any office visit. Again, rather than GI intolerance or perceived effectiveness, we believe that economic constraints play a major role in the capability of patients to afford for higher doses of sc semaglutide. Throughout follow-up, use of other medications with a potential to reduce weight did not experience a substantial change except for last office visit, in which a 7.45% reduction was observed, affecting mostly to orlistat use. A reduction in meal size and fat content to avoid nausea, which is a common advice given to patients on GLP-1 analogues [17,36] could explain this observed reduction in orlistat use.
Persistence on sc semaglutide was high throughout study observation period, with more than 86.33% of patients using the drug by the last office visit after a median of 10.70 months. This persistence is comparable to that observed in a recent publication by our group [37] in patients with type 2 Diabetes in a real-world setting using sc semaglutide under approved indication for glucose management, with a full reimbursement by public health system. As opposed to patients in our study, with an out-of-pocket indication for weight loss, this high persistence is reflecting in our opinion, a high degree of patient’s perceived effectiveness of sc semaglutide for weight reduction. Patients’ satisfaction was not specifically measured in this study but indeed a perception of successful weight management was frequently referred by patients to treating physicians. Additionally, a low percentage of patients complained of GI intolerance, mostly nausea and abdominal pain, and in most cases, these symptoms were mild to moderate in intensity and transient, thus allowing for treatment continuation. Up to 19 patients attending office visits declared inability to afford for treatment cost, despite good tolerance and significant weight loss. Few serious adverse events were seen in this study, none of them with a potential direct relationship to the use of sc semaglutide. Furthermore, overall persistence on sc semaglutide in this study was higher than that reported for other GLP-1 analogues in patients with type 2 diabetes in other real-world setting studies [38,39].
In 2010, Astrup and colleagues published the results of a trial evaluating for the first time, efficacy and tolerability of liraglutide in adult obese patients without diabetes [16]. Patients randomized to 1.2 to 3.0 mg of liraglutide lost 4.8 to 7.2 kg compared with 2.8 kg with placebo after a 20-week follow-up period, setting the evidence for use of liraglutide in obesity. These results represent a deeper weight reduction in obese patients without diabetes, as compared to patients with type 2 diabetes in the LEAD program, and are closer to those observed in the subgroup of patients with a previous treatment with liraglutide in our observational study, despite differences in study design and observation period.
In 2018, O’Neil et al. published the results of a phase 2 trial evaluating efficacy and safety of daily sc semaglutide compared to liraglutide and placebo in 957 obese individuals with a baseline BMI of 39.3 kg/m2 and age 47 years-old [18]. Patients randomized to 0.05 to 0.4 mg of sc semaglutide od lost -6·0% (0·05 mg), -8·6% (0·1 mg), -11·6% (0·2 mg), -11·2% (0·3 mg), and -13·8% (0·4 mg) as compared to -7.8% of initial body weight in patients randomized to liraglutide 3.0 mg od, throughout 52 weeks of treatment. In this study, proportion of patients with ≥5% and ≥10% weight loss vs baseline body weight ranged 54-90% and 19-72%, respectively, across different sc semaglutide doses. In our study, calculated average weekly sc semaglutide dose was 0.59 mg, which results in an estimated daily dose of 0.084 mg, close to the 0.1 mg od dose arm in the study by O’Neil et al., and with similar results in terms of weight loss (9.13% vs 8.6%) and proportion of patients with ≥5% and ≥10% weight loss (88% and 30% vs 67% and 37%, respectively). All sc semaglutide doses were generally well tolerated, with no new safety concerns. The most common adverse events were dose-related gastrointestinal symptoms, primarily nausea, as seen previously with GLP-1 agonists in patients with type 2 Diabetes and rarely led to discontinuation of treatment. No patient complained on symptoms suggesting hypoglycaemic episodes, reassuring the safe use of the drug in a population with normal glucose metabolism. A comprehensive clinical development program, the Semaglutide Treatment Effect in People with Obesity (STEP) program is now undergoing, aiming to investigate the effect of sc semaglutide on weight loss, safety, and tolerability in adults with obesity or overweight. The program comprises 5 randomized clinical trials for which results will be available through 2020- 2021[19]. For all trials, the primary end point is change from baseline to end of treatment in body weight. Participants have a mean age of 46.2 to 55.3 years, are mostly female (mean 74.1%- 81.0%), and have a mean BMI of 35.7 to 38.5 kg/m2.
Our study represents the first published evidence for effectiveness and safety of sc semaglutide with a weekly administration in the management of overweight and obesity in adults without diabetes in a real-world setting. An important point in this study, derived from its observational nature in real practice conditions, is that patients paid for sc semaglutide treatment and still a high percentage of them remained persistent to the therapy. Treatment adherence is one of the major drivers for the gap between efficacy observed in clinical trials and effectiveness found in real practice in chronic conditions like type 2 Diabetes [40], and obesity shares similarities with it, both in their chronic nature and in their pathophysiology. Weight reduction is a strong signal for patients’ perception of effectiveness that reinforces treatment adherence and this is probably one of the reasons for the high treatment adherence found in our study. Undoubtedly, treatment cost and treatment adherence will significantly impact effectiveness of antiobesity drugs in future real-world studies.
Our study has several limitations derived from its real-world descriptive nature. First, the lack of a control group does not allow to assign achieved weight loss to the solely effect of sc semaglutide, although previous evidence from randomized trials shows a similar degree of weight loss associated to the drug. Second, a number of patients were missed from follow-up for weight evolution, so again a selection bias overestimating treatment effect cannot be excluded, being this is a typical limitation of real-world studies. Third, a number of patients were included in this study with current use of other drugs with a potential for weight loss, both oral medications and GLP-1 analogues, so a potential confounding effect of these treatments cannot be completely excluded. Nevertheless, we performed a subgroup analysis where oral anti-obesity medications were not found to impact significantly on weight reduction and conversely, previous use of GLP-1 analogues was associated to a significantly lower weight loss, assuming that part of the potential for weight reduction associated to GLP-1 agonist therapy had already been achieved in those patients. Finally, it is not usual that an observational study reporting on effectiveness and safety of a drug in real practice conditions is published before gaining regulatory approval for the specific indication, as efficacy and mostly safety are important issues that must be first addressed by randomized clinical trials, and the authors deeply acknowledge this fact. Nevertheless, several important questions must be kept in mind in this regard; first, sc semaglutide has been approved by regulatory agencies in most developed countries for use in patients with type 2 diabetes and conditions for reimbursement in Spain include coexisting obesity, which virtually affects most patients with type 2 Diabetes. Second, liraglutide, a GLP-1 analogue with a similar molecular design and pharmacological properties has been approved for weight reduction in patients with obesity and third, given the shortage of effective treatments to treat obesity and the barriers that treatment cost may represent for patients’ accessibility to such therapies, the authors believe that evidence provided by this study is timely, and of scientific interest.
Conclusion
In conclusion, in this observational study in real practice conditions, we have demonstrated that sc semaglutide at a weekly dose of 0.5 to 1.0 mg administered to patients with overweight or obesity in the pragmatic context of a structured program along with diet and lifestyle recommendations resulted in a sustained, safe and affordable clinically significant weight reduction. Given the limitations of a retrospective observational study, we will need to confirm these results with the forthcoming results of the STEP program and contrast them with results from other groups in a real practice setting which for sure will be coming up in future. Until then, we consider that weekly sc semaglutide represents a useful tool for helping patients in their long-term struggle, along with diet and lifestyle changes, to increase their chances to arrive to and maintain a healthy body weight.
For more Diabetes and Obesity Journals please click on below link: https://lupinepublishers.com/diabetes-obesity-journal/
For more Lupine Publishers Please click on below link: https://lupinepublishers.com/
#Lupine Publishers#Lupine Publishers Group#ADO Journal#Archives of Diabetes and Obesity Journal#Journal of Diabetes#Journal of Obesity
0 notes
Text
Lupine Publishers| The Effect of Glibenclamide Administration on Gastrin Release in Diabetic Patients
Lupine Publishers| Journal of Diabetes and Obesity
Abstract
The effects of sulfonylureas on gastrointestinal function in man is not yet quite clear. The aim of this study was to investigate the effect of oral administration of glibenclamide on gastrin release in patients with non-insulin dependent diabetes mellitus. Twelve non-insulin dependent diabetic patients (six men, six women, median age 57 years, range 46-63 years) were studied. Glibenclamide or placebo were given on different days and in a random order 10 minutes before a standard meal (73.6 g corned beef + 5ml olive oil + 60g bread). Blood samples for the determination of gastrin, glucose and C-peptide in serum, before (-15 and 0 minutes) and 30, 60 , 90 , 120 and 180 minutes after the standard meal, were obtained. Initial mean values of gastrin in serum did not differ significantly between the two meals. As expected gastrin levels increased significantly after taking the meals. However, no significant differences concerning mean gastrin concentrations between the two meals were noted at all time intervals studied, although there was a trend for the glibenclamide-preceded meal to exert lower gastrin values, especially at 60 minutes (p: 0,06). Mean serum glucose levels were, as anticipated, significantly lower after the glibenclamide-meal. Similarly, serum C-peptide concentrations were higher after this meal. It is concluded that acute glibenclamide oral administration does not influence post-stimulatory 3 gastrin levels in non-insulin dependent diabetic patients. Thus, in the clinical situation, sulfonylurea administration does not seem to interfere with gastrin release.
Introduction
The effect of PPIs (Proton Pump Inhibitors) on serum gastrin levels has been well known since the early years of patient treatment with omeprazole [1]. On the contrary, the effects of sulfonylureas on gastrointestinal function in man is not yet quite clear. Sulfonylureas are known to have various extrapancreatic actions [2]. In addition to their stimulatory effect on insulin release from pancreatic islets. However, the effects of sulfonylureas on gastrointestinal function and gut hormones release remain unclear. More specifically, as it regards gastrin, there are only a few studies in which the effect of sulfonylureas is investigated [3,4]. furthermore, these studies show a discrepancy between results obtained in man and animal models [5,6] and, in addition they describe only the effect of sulfonylureas on fasting and not the postprandial serum gastrin concentrations [3,4]. The present study was undertaken, therefore, to investigate the effect of glibenclamide oral administration in patients with Non-Insulin Dependent Diabetes Mellitus (NIDDM) in combination with a test meal.
Results
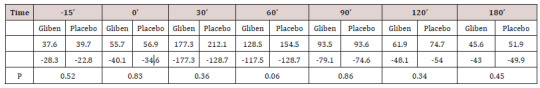
Initial mean values of gastrin in serum did not differ significantly between the two meals and were within the normal range (<90 pmol.1). As expected, gastrin levels increased significantly after taking the meals (Table 1). However, no significant gastrin concentrations between the two meals (meal + glibenclamide and meal + placebo) at all intervals studied, although there was a trend for the glibenclamide-preceed meal to exert lower gastrin values, especially at 60 minutes (p:0.063) (Table 1). Blood glucose variations are summarized in (Table 2). Mean serum glucose levels were, as anticipated significantly lower after the glibenclamide-meal as compared to those after placebo-meal. Similarly, postprandial C-peptide concentrations in serum were significantly higher after the glibenclamide-meal comparing to the placebo-meal (Table 3).
Table 1: Mean serum gastrin values ±SD (pmol/l).
Table 2: Mean serum glucose levels ± SD (mg/dl).
Table 3: Mean serum C-peptide concentrations ± SD (ng/dl).
Discussion
In this study, gastrin concentrations in serum were found not to be altered significantly in NIDD patients after oral administration of glibenclamide, in combination with a meal, as compared to those who received the same meal with placebo. Although there was a trend for patients taking glibenclamide to present lower postprandial serum gastrin levels, this difference was not statistically significant. These findings are in agreement with the results of a previous study in which injectable solution of glibenclamide was administered intravenously or per os to healthy volunteers [3]. In the above study, gastrin levels were estimated in periphal and portal blood and were found to be essentially unchanged, under all conditions studies [3]. In another study, tolbutamide was reported to inhibit gastrin release in man [4]. In that case the drug was administrated intravenously or per so to normal subjects as well as in patients with atrophic gastritis, duodenal ulcer and IDDM [4].
Our study Differs from the previous reports:
a) Because it concerned exclusively patients with NIDDM, who are mainly treated with glibenclamide and
b) In the parallel administration of a test meal.
Therefore, it is obvious that the present study was planned accordingly to simulate the everyday conditions in diabetic patients taking a meal in combination with glibenclamide. These results, as well as the above-mentioned study [4], suggest a possible inhibition of gastrin release by Sulfonylureas in man. However, in animal models, gastrin release has been reported to be stimulated by sulfonylureas [5,6]. Indeed tolbutamide was found to stimulate both somatostatin and gastrin secretion from the isolated perfused rat stomach [5]. Also, glibenclamide was reported to stimulate gastrin release from the antral mucosa of cats [6]. It is possible that differences in animal species, as well as in the experimental design and drug dosage may account for this discrepancy. Basal gastrin values of diabetic patients in the present study were in normal range. Hupergastrinaemia has not been reported previously in diabetic humas, except in the diabetic pesuedo-Zolinger-Ellison syndrome [7] and a number of patients with clinical manifestations of autonomic neuropathy [8-10]. It has been further suggested that increased serum gastrin leels in those NIDD patients are not related to hypochlorhydria but, instead, are resulting from the autonomic dysfunction [8,9]. In the present study, patients did not show clinical manifestations of autonomic neuropathy. This, as well as the fact that they did not have impaired renal function, might well explain the normal initial mean gastrin values. Finally, it is noted that the present experiments deal with acute glibenclamide administration. Also, it would be interesting to investigate further the possible effect of sulfonylureas on gastrin levels in diabetic patients presenting hypergastrinaemia.
For more Diabetes and Obesity Journals please click on below link: https://lupinepublishers.com/diabetes-obesity-journal/
For more Lupine Publishers Please click on below link: https://lupinepublishers.com/
#Lupine Publishers#Lupine Publishers Group#ADO Journal#Archives of Diabetes and Obesity Journal#Journal of Diabetes#Journal of Obesity
0 notes
Text
Lupine Publishers| An Evidence-Based Herbal Supplement for The Control of Metabolic Syndrome
Lupine Publishers| Journal of Diabetes and Obesity
Abstract
Background: Metabolic Syndrome (MS): Overweight, Obesity, Hypertension, Hyperglycemia and Hypercholesterolemia, are generally accepted today as clinical signals leading to cardiovascular diseases. Control of MS is therefore of a common health concern. While drug treatment is yet not available or may not be creditable, developing an effective health supplement against MS is highly justified.
Methods: A herbal formula composed of four herbs known to have anti MS pathological effects was used for in vivo and in vitro biological researches to verify its pharmacological effect, and subsequent pilot clinical trial.
Results: In vitro study: Adipocyte viability and cholesterol uptake, liver cell viability and anti-glycaemia effects, all gave positive results of good control. In vivo study testing herbal formula’s effects on obese mice also showed very promising results. In clinical trial, measurements of body weight, body circumferences, BMI, as well as liver fibrosis, all showed good responses after the herbal formula consumption.
Conclusion: Our efforts on the creation of an Evidence-Based Specific Supplement for the control of Metabolic Syndrome have harvested highly positive data in the laboratory. The subsequent 3 months’ pilot clinical trial showed positive data on the control of blood lipids, general body measurements and liver steatosis.
Keywords: Gene Expression; Lipid Droplets; Mitochondria; RNA Sequencing; Type 2 Diabetes Mellitus
Introduction
As cardiovascular diseases have become dominant causes of mortality, other related pathological presentations are gaining public attention [1,2]. Obesity is the commonest observable indicative of “unhealthiness”, leading to cardiovascular problems. Thus, simple objective measurements of obesity like Body Mass Index (BMI), blood lipids and cholesterols are also gaining much public concern [3]. Blood pressure and blood sugar levels naturally fall into the same checklist of safety requirements which are mainly affecting cardiovascular health [4].
As time goes on, the five major influences on cardiovascular health have thus been put together as the “Metabolic Syndrome” (MS): overweight, obesity, hypertension, hyperglycemia and hypercholesterolemia [5]. Another associated pathology, viz. fatty liver, turns up, as many sufferers of MS are found to have different degrees of liver dysfunction and fat deposits gradually leading the way to liver fibrosis [6].
For decades, varieties of interventions are available for the control of the different aspects of MS, particularly in areas that require specific effective control like hypertension and hyperglycemia. It is realized now that a better way to deal with the problem is to broaden the area of concern so that MS can be taken together in a multi-facetted preventive endeavor. Although specific single target pharmaceuticals are available for solitary treatment, a more ideal alternative could be some extra-pharmaceutical multiple target, harmonizing supplement to take care of all components of the MS [7,8].
Medicinal Herbs
A number of Medicinal herbs have been traditionally used as supplement for patients with diabetes mellitus and obesity. They are chosen for our study on metabolic syndrome. Platform studies would include bioactivities related to cardiovascular problems [9,10].
We selected four edible herbals items for the Chinese pharmacopeia to be tested. They are: (Table 1).
The combined formula (2MSC) would be tested for the control of body fat and sugar metabolism, while its effects on blood pressure, blood lipids and liver function would carefully be studied [17]. The design of this study on MS has chosen an emphasis on the effects on fatty liver [18].
Methods
Preclinical Studies
In vitro experiments included the following:
To investigate specific bioactivities of individual herbs and the combined formula
I.Testing the effects of Crataegus Fructus and the formula on the adipocyte viability and cholesterol uptake using adipocyte and cacocell cultures [19].
II.Testing the effects of Schisandra Fructus and Silymarim Marianum separately and the combined formula on liver cell viability using HepG2 cells [20].
III.Testing the antiglycemic effects of Momordica and the combined formula using Brush Border Membrance Vesicle model via its glucose uptake obstruction [21-23].
In vivo Experiments
Male C578 1/6 mice were use. Obesity induction was achieved using forced high-fat feeding for 8 weeks. The obese mice were treated with normal diet and continual high fat diet with 2% and 4% combined herbal formula [18]. At the end of 8 weeks for the low dose and 12 weeks for the high dose, the animals were sacrificed to have comprehensive checks on Body Weight, Blood examinations for lipid assessments and liver examinations.
Results of Laboratory Studies
In Vitro Studies
3T3-L1 preadipocytes differentiation cell assay showed the effects of the different concentrations of 125 μg/ml, it was a dose that induced significant toxicity to cells, and there was no dose– response effect observed [19].
Fluorescent tagged cholesterol-treated Caco-2 cell assay
The effect of the different concentrations of Crataegus Fructus aqueous extract and the herbal formula extract on cholesterol uptake in Caco-2 cells. Crataegus Fructus aqueous extract significantly prevented the cholesterol uptake in Caco-2 cells in a dose dependent manner. Herbal formula extract on the other hand had no significant effect on the cholesterol uptake in Caco-2 cells [19].
Animal Studies
The body weight, adipose tissues weight and liver weight were measured. In the 8-week treatment study, the High-fat diet (HF-fed) animals significantly gained more weight than chow-fed animals. Among all HF-fed animals, there was a trend for a reduction in body weight of 4% among herbal formula fed animals, starting from week 9 onwards. Three types of adipose tissues (epididymal fat, peri-renal fat, and inguinal subcutaneous fat) were isolated and weighed. High-fat diet induced obesity in mice compared to normal chow-fed mice after 16 weeks and 20 weeks, as evidenced by the significant increase in all three types of fat pad mass to body weight ratio: epididymal fat pad (p < 0.01 for both 8-week and 12-week treatment studies), inguinal fat pad (p < 0.01 for both 8-week and 12-week treatment studies), and perirenal fat pad (p < 0.001 for both 8-week and 12-week treatment studies).
Livers were isolated, weighed and presented as liver to body weight ratio. High-fat diet induced an increase in liver to body weight ratio in both 8-week and 12-week treatment studies [19]. 2% and 4% herbal extracts dose-dependently reduced the liver to body weight ratio in both treatment periods.
Liver histopathology and inflammation assessment
Livers from mice fed on different diets were analyzed histologically. Normal-chow-fed animals demonstrated the histological sections of normal livers. In contrast, H&E sections from HF animals revealed the presence of a large number of circular lipid droplets within the hepatocytes. These lipid inclusions were clearly reduced in size as well as number in the livers of all herbal formula treated animals.
A Pilot Clinical Trial
Title: Pilot Clinical Study to evaluate the effects of the innovative herbal formula 2MSC in subjects with Metabolic Syndrome.
Hypothesis: 2 MSC is effective for the Management of MS, with particular emphasis on liver fibrosis (Fatty liver).
Study Design
An open label pilot study conducted with 30 overweight adult men and women were assigned to take 2 MSC daily for 3 months.
Study Population
Subjects recruited were 40-66 years of age, with BMI between ≥25kg/m2 and ≤37.7kg/m2. They agreed to attend all study visits and to keep their normal dietary habits and usual physical activities. Subjects were excluded if they were diabetic (on diabetic medication for more than four weeks); on cardiac and statin related drugs; on immune-suppressive drugs. Cigarette smokers, pregnant or lactating women were excluded. A total of 30 volunteers with no past history of allergy to herbal medicine were recruited.
Study Procedures
The study started after signing the proper consent. Duration of treatment lasted 12 weeks. Monthly phone calls were conducted to monitor the progress, compliance and adverse effects. Volunteers were reminded to keep their usual dietary habits and physical activities.
Data Collections
Demographic and basic measurements related to MS including Body Weight, BMI; Waist Circumference; Hip Circumference and Neck Circumference. Blood testing included fasting blood sugar, Liver function tests, Renal function tests. Other items related to Lipid metabolism included total cholesterol (TC), Triglycerides (TG), Low density (LDL) and high-density lipoprotein cholesterol (HDL), and non-high-density lipoprotein cholesterol. Adiponectin and some immune cytokines were also taken. Fibroscan of the liver was done at baseline and final visit. The Quality of life was checked with the standard SF-36 scoring sheet.
Primary Outcome
The primary outcome included the decline of Body Weight, Waist Circumference and Lowing of blood triglyceride TG.
Statistical Analysis
Excel 2016 (Microsoft Corp, Redmond WA) was used for data entry. Statistical analysis was performed using SPSS Base System ver. 25 (IBM SPSS Inc., Chicago IL.). Statistical analysis (descriptive statistics and Student t tests) was performed using SPSS ver. 22 (IBM SPSS Inc., Chicago IL.). Paired t-test was utilized to evaluate the difference between pretreatment mean and post-treatment mean. The percent changes in CAP Reading from baseline to 12 weeks of treatment with 2MSC were analyzed by using Chi-Square test.
Results
Compliance was excellent. No subject withdrew during study period. Adverse effects reported were all mild, including loose stools and mild abdominal discomfort. Liver and kidney functions remained normal. Bodily measurements all showed clear tendencies of improvement with convincing p values (Table 2).
BW: Body Weight; BMI: body mass index.
The blood checking data indicative of lipid metabolism also showed very positive decline in the triglycerides (Table 3). Fibroscan study showing the “rigidity” of the liver through the anterior abdominal wall, demonstrated softening from 315.3 (49.7) to 291.0 (44.1) p=0.006 (Table 3).
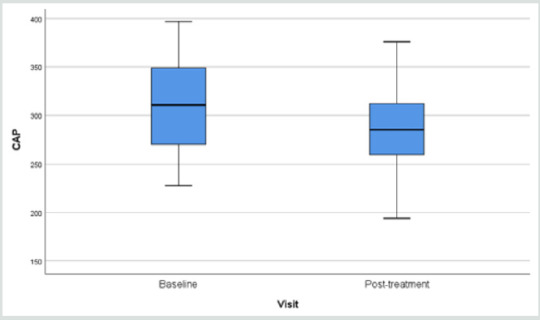
Results of fibroscan for fatty liver study gave an overall positive effects of the herbal formula slowing down the progress of liver fibrosis when the controlled attenuation parameter (CAP) data revealed by the fibroscan were analyzed (Figure 1).
Table 3: Changes in the lipid profile and Fibroscan after administration of 2MSC.
TC, total cholesterol; TG, triglycerides; HDL-C, high-density lipoprotein cholesterol; LDL-C, low-density lipoprotein cholesterol; * 12-week minus Baseline.
Figure 1: Overall Fibroscan Results: Comparission of controlled attenuation parameter (CAP) values.
Figure 2: Comparison of CAP Reading.
When the liver conditions of the volunteers were classified into four different groups of liver steatosis, as: minimal, mild, moderate and severe, it was interesting to find that the herbal formula influenced only the moderate group significantly, while the minimal to mild group and severe group were unaffected. (Figure 2).
Discussion
Functional foods or nutraceuticals which have potential anti-obesity properties have attracted great attention. Schisandrae Fructus is a Chinese herb traditionally used as a liver tonic. Silymarin, an extract of the milk thistle (Silybum marianum), is a dietary supplement that is widely used in Europe for the prevention and treatment of liver problems. Crataegus Fructus (hawthorn) is traditionally used to promote digestion and dissipate food stagnation. Momordica charantia (bitter melon) is traditionally used for the treatment of diabetes in Ayurvedic Medicine. Our in vitro results suggested Crataegus Fructus aqueous extract exerted potent inhibitory effects on 3T3-L1 preadipocytes differentiation and cholesterol uptake into Caco-2 cells. Schisandrae Fructus aqueous extract and milk thistle exerted inhibitory effects on oleic acid-induced fatty liver in HepG2 cells. Momordica charantia extract on the other hand, exerted significant inhibitory effects on the glucose uptake into BBMV. Our in vivo results showed that our herbal formula exhibited a trend to reduce diet-induced increase in body weight and fat pad mass (epididymal, perirenal and inguinal fat). It also significantly reduced diet-induced increase in liver weight, liver lipid, and plasma lipid dose-dependently. High-fat diet induced a significant reduction in adiponectin level which was significantly improved by herbal formula supplementation at 4%. The herbal formula also significantly reduced diet-induced inflammation in the liver at both doses.
Metabolic Syndrome is currently understood as a combination of commonly co-existing symptoms some of them clearly present uniquely as an outstanding disease, like diabetes mellitus and hypertension, while others present as potentially threatening pathologies. Although adequate treatment for diabetes and hypertension are available, there is a common wish that they could be controlled at an early stage, so that progression could be curbed [23].
Apart from a rigidly followed lifestyle recommended for the cardiovascular system and obesity, which is not easy for the general public, food supplements have been used to help [24,25]. Our pilot clinical study ventured to develop an evidence-based supplement specific for MS, adopting a broad view covering all five problems: obesity, body weight, BMI, blood pressure, and blood lipids. Changes in liver fat and adiponectin were also explored [26,27]. Our pilot clinical study showed an overall body weight loss from 71.4 to 70.6 kg (p=0.027) and a BMI 28.0 to 27.7 (p=0.053) within a short period of 12 weeks.
The body circumference (external fat collection) shrinkage as detected through waist and hip also showed significant decline (p=0.014 and 0.011).
Since neck circumference measurement has recently been endorsed as a simple practical assessment for body fat, our neck measurements were supportive to the innovation and showed a 37.0 to 36.0 cm decline [28,29].
Useful results were provided in the blood tests. Liver function and renal function tests stayed normal, indicating the safety of the formula. With regard to the lipids: there were declines in triglycerages (p=0.044) and an increase in high density lipid (p=0.034) [30]. Fasting blood sugar remained stable.
The overall results were promising but the trial period lasted only 12 weeks and the number of volunteers was small. More than 50 Traditional Chinese Medicine formulae have been used to treat MS, basing on classical theory “Kidney Health”, cardiovascular support, and general harmonizing effects [31]. The 4-herbs selected to form the 2MSC formula were taken from classical recommendations subsequently scrutinized on bioactivity platform, to provide pharmacological evidence.
Liver scanning using Ultrasonic Fibroscan device is a simple qualitative and quantitative way to evaluate fat contents in the liver suspected of fatty changes. In our study, liver tissue resistance to Ultrasonic pressure was found to decline from 315.3 to 291.3 (p=0.010) within a period of only 12 weeks (Figure 1) (32-35). There are many reports on the study of non-alcoholic fatty liver in response to supplements [25,36-39] mainly targeting on the liver pathology alone. Our study took a broader view: other factors leading to MS should also be contributing towards fatty changes in the liver.
Since the discovery of Adiponectin as a factor very much affecting the Metabolism of fatty tissues responsible for the metabolic cycle connecting fat deposit and carbohydrate consumption, the behavior of adiponectin is often included in studies related to MS [40-43]. In our preclinical animal experimental study lasting 12 weeks, we found a high dose of the combined formula gave an increase of adiponectin suggesting that carbohydrates metabolism could have been promoted [19]. In our pilot clinical trial, however adiponectin was found to be either raised, remained stable or decreased. This might be due to the low dose effect or that the study lasting only 12 weeks. Using the SF36 questionnaire for the volunteers’ selfevaluation of their physical, mental and social well-being’s did not give remarkable results.
Conclusion
Up to today there is no FDA approved medications for the treatment of non-alcoholic fatty liver disease (NAFLD). The American Association for the Study of Liver Diseases (AASLD) suggested the combination use of vitamin E (an antioxidant) and pioglitazone may be helpful but not all patients would benefit from it. For patients diagnosed with NAFLD, the first line of treatment usually involves weight loss through a combination of a healthy diet and exercise. According to the AASLD guidelines, it was recommended that 10% body weight loss would lead to improvement of the steatosis and inflammation related. Previous studies also found that lifestyle modification could significantly improve the mean fibroscan CAP value (278.57±49.13 dB/m VS 252.91±62.02 dB/m, p=0.03). Thus 6 months of lifestyle modification which include moderate intensity physical exercise 3 days per week each for 45 minutes; plus a restricted caloric intake of 25-30 kcals/kg/day could better protect liver health after tremendous individual efforts and This obviously involves hard work and determination.
Our efforts on the creation of an Evidence-Based Specific Supplement for the control of Metabolic Syndrome have harvested highly positive data in the laboratory and in the subsequent 3 months’ pilot clinical trial. Encouraging results were obtained in the control of blood lipids, general body measurements and liver fibrosis. It is envisaged that coupled with more exercises and dietary control, better results could be expected. Further clinical studies would be very much warranted.
For more Diabetes and Obesity Journals please click on below link: https://lupinepublishers.com/diabetes-obesity-journal/
For more Lupine Publishers Please click on below link: https://lupinepublishers.com/
#Lupine Publishers#Lupine Publishers Group#ADO#Archives of Diabetes and Obesity#Journal of Diabetes and Obesity
0 notes
Text
Lupine Publishers| Diabetes in Older People: Comprehensive Approach
Lupine Publishers| Journals of Diabetes and Obesity
Abstract
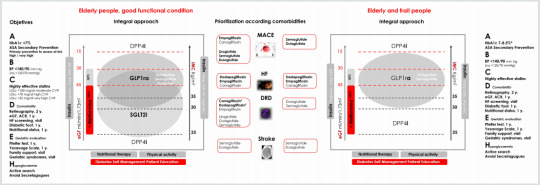
The clinical management of older people with diabetes requires a comprehensive evaluation and a holistic approach for the individualization of objectives and strategies of treatment. In older people with diabetes, geriatric syndromes, frailty and sarcopenia are considered at present as a third category of chronic complications. These situations are added to traditional microvascular and macrovascular complications, leading to significant disability and increasing the costs. In this context, two clinical scenarios can be considered: the first one, elderly subjects without significant comorbidities and good functional condition, in which an approach to diabetes similar to that of younger patients must be made. The second scenario, elderly and frail subjects, in which it will be essential a correct identification of these conditions and the evaluation of geriatric syndromes. This evaluation will guide the adaptation in the goals of treatment and in global management of diabetes.
Some basic principles should guide our decision-making: starting drugs at low - medium doses, with progressive increase according to tolerability; selection of drugs according to evidence-based medicine (considering the limited evidence in this age group), favoring agents with the lowest risk of hypoglycemia, avoid polypharmacy. Finally, patient´s safety and quality of life should be the main objectives.
Keywords: Diabetes; Older; Frailty; Evidence-Based-Medicine
Opinion
Clinical management of older diabetes people requires a comprehensive evaluation and a holistic approach for the individualization of objectives and strategies of treatment. Geriatric syndromes, frailty and sarcopenia are considered at present as a third category of chronic complications [1]. These situations are added to traditional microvascular and macrovascular complications, leading to significant disability and a significant increase in costs.
In this context, two clinical scenarios can be considered: first, elderly subjects without significant comorbidities and without frailty, in which an approach to diabetes similar to that of younger patients must be made. The second scenario, elderly and frail subjects, in which a correct identification of frailty and an evaluation of geriatric syndromes is mandatory, guiding modifications in the goals of treatment and in the global management of diabetes.
Initial Approach
1. Consider evaluation of medical, functional (self-care skills) and geriatric sphere to establish a frame of reference that determines the objectives and therapeutic strategies diabetes management (Evidence B) [2].
2. Assess presence of geriatric syndromes (polypharmacy, cognitive impairment, depression, urinary incontinence, falls, chronic pain) as conditions that interfere with patient’s management of diabetes and reduce quality of life (Evidence B) [2].
Figure 1: Comprehensive approach in older people with T2DM.
Bold therapy: grade A evidence. * Clinical situation: Intermediate / complex HbA1c 7-8%, TA <140/90 mmHg; very complex HbA1c <8.5%, TA <150/90 mm Hg.
ASA, acetylsalicylic acid; BP, blood pressure; LDLc, LDL cholesterol; y., every “number” years; eGF, estimated glomerular filtration; ACR, urine albumin creatinine ratio; HF, heart failure (evidence limited to patients at risk of heart failure or patients with FH diagnosis and reduced ejection fraction); Ŧ eGFR <30 mL/min/1.73 m2: Initiation not recommended, but once established, it can be maintained until the start of dialysis.
GLP1ra, glucagon-like peptide-1 receptor agonists; SGLT2i, sodium-glucose transport protein 2 inhibitors; DPP4i, dipeptidyl peptidase 4 inhibitors; Glarg, glargine
3. Evaluation of frailty. The most validated and simple evaluation tools are Fried criteria and FRAIL scale. Consider potentially reversible causes that contribute to frailty such as presence of hypothyroidism, vitamin D deficiency, anemia, etc., is advised [3].
4. In those over 65 years of age, an early diagnosis of mild cognitive alterations is recommended, at diagnosis and subsequently annually [2]. Pfeiffer questionnaire or Minimental test are validated tools. In patients with cognitive dysfunction, simplify treatment, and adapt care structure.
5. Patient safety, preferences and quality of life should be the main objectives.
Treatment objectives, therapeutic approach and the assessment of comorbidities, are shown in (Figure 1).
Treatment Objectives (ABCDEH):
A. Glycemic control (A1c)
General recommendation, which should always be individualized, is a target of HbA1c 7.5-8.5% (58-69 mmol/l) in advanced frailty, and HbA1c 7-8% (53-64 mmol/l) in mild to moderate frailty. In frailty subjects, HbA1c <7% (53 mmol/l) should be avoided, especially if drugs with risk of hypoglycemia are used [2]. Many frail subjects have medical conditions that can interfere with HbA1c determination (chronic kidney disease, anemia, transfusions), and capillary blood glucose measurement may be necessary for assessing glycemic control [2].
B. Blood pressure (BP)
The objective of elderly subjects with diabetes, including those with dementia, is <140/90 mmHg, avoiding values <120/70 mmHg. A goal of <150/90 mmHg may be more suitable for the frail and dependent elderly. Whenever possible, measure BP standing and sitting, to detect orthostatic hypotension that increase the risk of falls. Withdrawal of treatments should be evaluated as frailty progresses [2,3].
C. Hypercholesterolemia
Statin treatment is recommended in the same situations as in non-elderly subjects: secondary prevention and primary prevention with high cardiovascular risk. Treatment of hypercholesterolemia in elderly patients has some differential characteristics. Lifestyle changes may not be possible. Furthermore, statin myopathy is more frequent (up to 10%) due to sarcopenia, so it is advisable to use low or moderate doses of statins. Treatment of vitamin D deficiency can improve statin-associated myalgia [3]. In situations of advanced frailty and dependency, suspension of statins may be considered.
D. Assessment of chronic complications
It must be individualized, with particular attention to those with higher influence on functional state (retinopathy, diabetic macular edema and diabetic foot). Heart failure, chronic kidney disease, and vitamin B12 deficiency should not be forgotten [2,4].
E. Geriatric Evaluation
Consider the assessment of geriatric syndromes: polypharmacy (use of three or five drugs simultaneously or the need to indicate one drug to supply the side effects of another), cognitive impairment, depression (Yesavage scale annually), urinary incontinence, falls, chronic pain (visual analogue pain scale), and frailty [2,3].
F. Hypoglycemia
In older people prevention of hypoglycemia is especially important because of the repercussions on the risk of falls, fractures, and emergency department visits and hospitalization. Elderly patients have impaired recognition of hypoglycemia and difficulties in acquiring basic skills for self-care and for resolution of hypoglycemia, which determines a greater severity of the episodes. Also, there is a bi-directional relationship between hypoglycemia and cognitive decline [5].
Comprehensive Pharmacological Treatment in the Elderly with T2DM
In general terms, disease modifying therapies should be used in combination with metformin, that is, with benefit in morbidity - associated mortality, low risk of hypoglycemia, and benefits in terms of control of BP and excess of weight (if appropriate) [6].
The patient and their caregivers should be aware of the “sick days” rule for metformin and sodium-glucose transport protein 2 inhibitors (SGLT2i), to avoid the potential risk of impaired renal function, lactic acidosis, and euglycemic ketoacidosis. Also, simplification of complex regimens is recommended, especially in patients with insulin therapy, to reduce the risk of hypoglycemia and polypharmacy, always based on individualized HbA1c targets.
The use of SGLT2i in frail elderly patients with a diagnosis of heart failure (HF) with reduced ejection fraction (FEr), is a reasonable therapeutic option, given its potential benefits. Diuretic and blood pressure treatment must be revised to avoid volume depletion (hypotension, orthostatic hypotension, dizziness, syncope, and dehydration), and impaired kidney function.
DPP4 inhibitors (DPP4i) may be reserved for elderly people with renal function contraindicating other therapies, or those patients with normal weight, in whom the additional weight loss may be a problem; in this case, sitagliptin [7]. and linagliptin [8] must be prioritized. Sulfonylureas and glinides (hypoglycemia risk), and pioglitazone (risk of heart failure and fractures), must be avoided.
In frail elderly people with obesity, the use of weekly glucagonlike peptide-1 receptor agonists (GLP1ra) may be a good option given the low risk of hypoglycemia, the weight loss benefit, the potential benefits in comorbidities and the weekly administration [9]. Its use must be accompanied by adapted nutritional therapy, and appropriate physical activity recommendations (aerobic and resistance training) to avoid the loss of muscle mass, including strength, flexibility and balance exercises [10]. Also, the appearance of gastrointestinal effects should be monitored.
For more Diabetes and Obesity Journals please click on below link: https://lupinepublishers.com/diabetes-obesity-journal/
For more Lupine Publishers Please click on below link: https://lupinepublishers.com/
#Lupine Publishers#Lupine Publishers Group#ADO#Journal of Diabetes and Obesity#Archives of Diabetes and Obesity
0 notes
Text
Lupine Publishers| Identification of The Downregulation of TPD52-Like3 Gene and NKX2-1 Gene in Type 2 Diabetes Mellitus Via RNA Sequencing
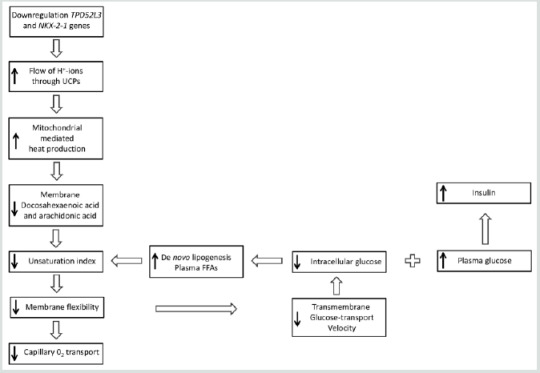
Lupine Publishers | Journal of Diabetes and Obesity
Abstract
A recent study using next-generation RNA sequencing was reported on genome-wide changes in gene expressing in the skin between patients with type 2 diabetes mellitus, compared to non-diabetic patients. Ex-post review, based in part on both the existence of lipid droplets, peridroplet mitochondria and cytoplasmic mitochondria, selected in the gene metabolism category the most downregulated gene TPD52L3, and in the gene regulation category the most downregulated gene NKX2-1. There is strong evidence that these two genes are involved in the disease process of type 2 diabetes mellitus.
Keywords: Gene Expression; Lipid Droplets; Mitochondria; RNA Sequencing; Type 2 Diabetes Mellitus
Opinion
In an earlier study, it was proposed that the final consequence of hereditary anomaly results in the development of type 2 diabetes, which already emerges in the prediabetic phase. It was thought to occur due to an increased flux, as compared to the healthy controls where protons (H+-ions) from the mitochondrial intermembranespace re-enter the matrix via uncoupling protein-1 (UCP1). This causes hyperthermia in and around the mitochondria [1].
But the key question that remains to be answered here is for the connection between the increased flow of protons and type 2 diabetes mellitus. In the past decade, a study reported on the visual documentation of the possible interaction of lipid droplets with mitochondria. This interaction was found to be quite intimate with the involvement of membrane attached receptor proteins such as SNAP23 [2]. Also, the cellular population of mitochondria in brown adipocytes tissue could be divided into two subpopulations; i.e. mitochondrial population having physical evidence of adherence to a lipid droplet or peridroplet mitochondria, and a non-lipid droplet-bound cytoplasmic mitochondrial population without any adherence to lipid droplets [3,4].
Although both the peridroplet mitochondria and cytoplasmic mitochondria are similar in their cell membrane composition they differ in other fundamental respects [3,4]. A comparison of the purified peridroplet mitochondria to cytoplasmic mitochondria suggests that peridroplet mitochondria are more elongated, whereas cytoplasmic mitochondria tend to be smaller. Also, peridroplet mitochondria have enhanced oxidative phosphorylation capacity, TCA cycle activity, ATP synthesis, as well as increased ATP-dependent triglyceride synthesis compared to cytoplasmic mitochondria. The measured fatty acid-driven respiration and UCP1 content in the isolated mitochondria suggests that for thermogenic fat oxidation peridroplet mitochondria are not specialized compared to cytoplasmic mitochondria [3]. This signifies that, under healthy conditions, in the peridroplet mitochondria the protons derived from free fatty acids (FFAs) and generated by the electron-transport chain during the oxidation process of FA are used for the production of ATP without any escape of protons via UCP1 to produce heat. On the other hand, the protons generated by the oxidation of cytoplasmic mitochondrial FA are mainly used for the production of heat. So, peridroplet mitochondria have an increased coupled respiration, while cytoplasmic mitochondria have an increased uncoupling activity. The existence of peridroplet mitochondria demonstrates that the essential processes of fat metabolism can be selectively confined to exclusive and segregated subsets of mitochondria. The fatty acids intended for storage undergo synthesis of triacylglycols followed by their storage in the lipid droplets.
Most eukaryotic cells can store lipids in the form of droplets [5]. Lipid droplets are cytosolic storage organelles at the center of the lipid and energy homeostasis. They have a unique architecture consisting of a hydrophobic core of neutral lipids, mostly triacylglycerol and sterol esters and are enclosed by a phospholipid monolayer membrane. This single layer is derived from the endoplasmic reticulum, whereby triacylglycerols are synthesized between the two leaflets of the endoplasmic reticulum membrane. Associated with the monolayer is a specific set of proteins, which decorates the surface of the lipid droplet but is absent from the hydrophobic core [6]. These proteins associate with the membrane through hydrophobic hairpins, amphipathic helices and fatty acid modifications, and are also thought to control lipid droplet positioning inside the cell and association with other organelles.
In 2016, researchers demonstrated that the exogenous expression of human tumor protein D52 (TPD52) in the cultured 3T3 cells result in a significant increase in the numbers of lipid droplets [7]. Starting with the bulging of a triglyceride lens within the endoplasmic reticulum bilayer, lipid droplet biogenesis factors including TPD52 are recruited to the lens structure and facilitate the growth of the nascent lipid droplet [8,9]. Moreover TPD52- expressing 3T3 cells form more lipid droplets following oleic acid supplementation, which contributes to the lens formation [10]. As a previous study has shown, an increase in carbon-carbon double bonds in the acyl chains of phospholipids promotes the flexibility of cellular membranes [11]. So, TPD52 expression increases lipid storage, co-distributes with lipid droplets and is recruited to lipid droplets to stabilize lipid droplets [12]. Moreover, it is interesting to note that TPD52 knockdown decreased both lipid droplet sizes and numbers [12].
Tumor protein D52 is the founding member of the TPD52-like protein family representing four paralogous mammalian genes, i.e. TPD52, TPD52L1, TPD52L2, and TPD52L3 [7,13,14]. The group of Cao demonstrated that human TPD52L3 interacted with itself and with TPD52, TPD52L1, and TPD52L2 [14]. The four human linear proteins of this family are TPD52, TPD52L1, TPD52L2, and TPD52L3, which consist of 184, 204, 206, and 140 amino acid residues, respectively. Their first exon-coded protein located at the N-terminal side is unique to each isoform, and all the members contain a highly conserved coiled-coil motif located towards the N-terminus which is required for homo- and heteromeric interaction with other TPD52-like proteins [14,15] and share a sequence identity of ~50% [7]. Byrne et al. proposed that TPD52 may exert and/or regulate its activities through interaction with itself and its related proteins [15]. The coiled-coils were predicted by use of pairwise residue correlations and were not based on their crystal structures [16].
Figure 1: Alignment of the human TPD52 (upper row) and the human TPD52L3 (lower row) protein sequences. Amino acid residues are indicated by single letters. Vertical lines indicate identical residues and colons/dots indicate highly/weakly conserved residues.
The analysis was focused on the sequences of TPD52 and TPD52L3. The two sequences revealed an obvious similarity, they share 63 identical positions and 42 similar positions resulting in an overall homology of 57.1% (Figure 1). The coiled-coil motif near the N-terminus was found in all TPD52-like proteins. Uniprot predicts a coiled domain for residues 28-57 of TPD52L3, and also for residues 21-70 of TPD52 [17]. The common part of these two coiled-coil protein sequences has an overall homology of 67.9% (Figure 1). The information regarding the amino acid sequences of human TPD52 (P55327-2) and TPD52L3 (Q96J77-1) was retrieved from the UniProtKB/Swiss-Prot databank. Interestingly, although the coiled-coil motif is very important for the interactions mediated by TPD52-like proteins [15,18], the TPD52L3 shortened coiled-coil motif successfully interacted with TPD52-like proteins.
A recent study using next-generation RNA sequencing was reported on genome-wide changes in gene expression in the skin between patients with type 2 diabetes mellitus, compared to nondiabetic patients [19]. The most downregulated gene of patients with type 2 diabetes in the gene metabolism category is TPD52L3 with a “log2 fold change” value of -28, compared to skin samples from non-diabetic patients. So far, this gene has not been linked to type 2 diabetes or wound healing.
The fact that the exogenous expression of human TPD52 increases the number of lipid droplets [7], TPD52 knockdown decreases the number of lipid droplets [12], and the activity of TPD52 depends on the interaction with TPD52L3 [14], support the idea that the major function of TPD52L3 is the lipid storage at the center of the lipid and energy homeostasis [8,9]. In other words, in brown adipocytes tissue, it seems likely that the significant downregulation of TPD52L3 causes a reduction in the number of lipid droplets in the skin samples of type 2 diabetes mellitus patients.
This indicates that an essential reduction in the lipid droplets suggests a substantial decrease in the peridroplet mitochondria for patients with type 2 diabetes and consequently an increase in the saturated plasma FFAs. As the unsaturation index (UI; number of carbon-carbon double bonds per 100 fatty acyl-chains) of FFAs from human white fat cells is substantially lower compared to the UI of serum FFAs in the healthy controls (85.5 and 191.9, respectively), these events force a shift from unsaturated to saturated acyl chains in the phospholipids of both the erythrocyte and vascular membranes [20]. This reduction in UI translates into an increase in the attractive forces between the mutual membrane phospholipid acyl chains, which redistributes the lateral pressure profile of the cell membrane [21]. This redistribution reduces the pore diameter of the transmembrane glucose transport channels of all Class I glucose transporter proteins, leading to a marked reduction in the transmembrane glucose transport [22].
On the other hand, the increased uncoupling activity of the cytoplasmic mitochondria [4] takes up the remaining fatty acid oxidation, including the formation of protons. The rationale is that the overall balance between the number of protons which re-enter the matrix through ATP synthase on the one hand, and the number of protons which re-enter the matrix through UCP1 on the other hand, might shift to the latter side, which in turn promotes an increase in the production of heat. To keep a narrow range of mitochondrial temperature compatible with life, the slow-down principle enters into force, which also results in an essential reduction in UI [1]. This chain of events is a blueprint of the development of type 2 diabetes mellitus.
A second result of the earlier mentioned genome-wide analysis study is the most downregulated gene in the gene regulation category, NKX2-1, of type 2 diabetes patients with a “log2 fold change” value of -28 compared to skin samples from non-diabetic patients [19]. Notably, a study also reported a novel heterozygous mutation in exon 3 of the NKX2-1 gene, which is related to a reduction in the muscle mitochondrial respiratory chain complex activity, a characteristic of type 2 diabetes [23]. It is to be noted that the reduced mitochondrial activity is one of the characteristics of type 2 diabetes [24]. This may be in advance of the patients with type 2 diabetes mellitus as the reduced mitochondrial activity implies a reduction in heat production.
Finally, it is worth considering about the potential benefit of the use of (modified) synthetic TPD52L3 for combating the adverse effects of type 2 diabetes mellitus.
Briefly, the idea is that two genes are pertinently involved in the disease process of type 2 diabetes mellitus: one concerns the downregulation of human TPD52L3 gene expression, which yields a significant reduction in the lipid droplets, whereas the second one relates to the downregulation of human NKX2-1 gene expression which reduces the mitochondrial respiratory chain activity (Figure 2).
Figure 2: Although the results of genome-wide screen for type 2 diabetes susceptibility genes are still under debate, a refined working hypothesis proposes that the primary effect of the downregulation of the human genes TPD52L3 and NKX2-1 generates an increased flux of mitochondrial intermembrane-space protons through UCP1 into the matrix, which causes an increase of extra heat. This process initiates the slow-down principle. UCP: Uncoupling protein; FFA: Free fatty acid; GLUT: Glucose transporter.
For more Diabetes and Obesity Journals please click on below link: https://lupinepublishers.com/diabetes-obesity-journal/
For more Lupine Publishers Please click on below link: https://lupinepublishers.com/
#Lupine Publishers#Lupine Publishers Group#ADO#Journal of Diabetes and Obesity#Archives of Diabetes and Obesity#Diabetes
0 notes
Text
Lupine Publishers| Properties of Mitochondrial-Derived Peptides (Mdps), Type 2 Diabetes, and Relationship with Oxidative Stress
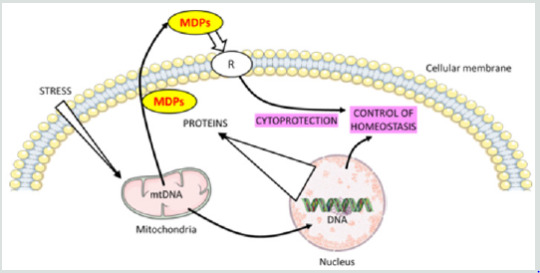
Lupine Publishers| Journal of Diabetes and Obesity
Abstract
Objective: In addition to its role in energy production and metabolism, mitochondria play a major role in apoptosis, oxidative stress, and calcium homeostasis. This review highlights the intricate role of mitochondria derived peptides (MPs), oxidative stress, and age-related disease such as diabetes.
Key Findings: The mitochondria produce MDPs: specific peptides that mediate transcriptional stress response by its translocation into the nucleus and interaction with DNA. MDPs are regulators of metabolism with cytoprotective effects through anti-oxidative stress, anti-inflammatory responses and anti-apoptosis. This class of peptides comprises: humanin (HN), MOTS-c, Small HN-like peptides. HN inhibits mitochondrial complex 1 activity and limits oxidative stress level in the cell. HN has been shown to prevent apoptosis by decreasing the reactive oxygen species production. Mitochondrial dysfunction and oxidative stress are implicated in the pathogenesis of diabetes. Data suggested that MDPs had a role in improving type 2 diabetes (T2D).
Summary: The goal of this review is to discuss the newly emerging functions of MDPs and their biological role in ageing and age-related diseases such as T2D.
Keywords:Mitochondrial-Derived-Peptides; Humanin; Oxidative Stress; Diabetes
Introduction
Mitochondria play a critical role in maintaining cellular function by ATP production. In addition to its role in energy production and metabolism, mitochondria play a major role in apoptosis, oxidative stress, and calcium homeostasis. A mitochondrial stress signal, or a ‘mitokine’, could confer protection and promote survival, while priming the cell’s readiness for subsequent insults with increasing severity. The term ‘mitohormesis’ for such a phenomenon has been created [1]. The mitochondrial unfolded protein response (UPRmt) is a central part of the “mitohormetic” response. The UPRmt may be an alternative way in relationship with mitochondria signal in the cell. The mitochondria produce some specific peptides that mediate transcriptional stress response by the translocation into the nucleus and interaction with DNA. Mitochondrial derived peptides (MDPs) are regulators of metabolism and various studies have shown that MDPs exerted cytoprotective effects through anti-oxidative stress, anti-inflammatory responses and anti-apoptosis [2,3]. The goal of this review is to discuss the newly emerging functions of MDPs and their biological role in ageing and metabolic diseases such as T2D.
Mitochondrial Metabolism Modulation
Functions in the Mitonuclear Communication Pathways
Mitochondria booked a portion of the original bacterial genomes that co-evolved with nuclear genome. However, mitochondria import over a thousand proteins encoded in the nuclear genome to maintain their diverse functions, reflecting their adjacent relationship [4].
The mitochondrial genome inherits bacterial-like traits: the DNA molecules (mtDNA) are circular, double stranded, small (16,569 nucleotides in humans) and compact. mtDNA contains 37 genes, including 22 tRNAs, 2 rRNAs (12S and 16S rRNA) and 13 mRNAs encoding the proteins of the electron transport chain [5]. The mtDNA has no introns but a few non-coding nucleotides between adjacent genes and small open reading frames that encode functional MDPs. This class of peptides comprises humanin (HN) and mitochondrial open reading frame of the 12S rRNA-c (MOTS-c) and expands the expression of mitochondrial proteome [6]. It has been established that mitochondria can export peptides and also import cytosolic peptides. It is the class of “cell-penetrating peptides” designed also as “mitochondrial cell-penetrating peptides” [7]. Many age-induced processes and degenerative diseases are related to mitochondrial dysfunction, further highlighting the critical importance of this organelle [8]. Complex human diseases, including diabetes, obesity, fatty liver disease and aging-related degenerative diseases are associated with alterations in mitochondrial oxidative phosphorylation (OXPHOS) function.
Overview on Concepts of Retrograde Signaling and Unfolded Protein
Numerous implications of these anterograde and retrograde signaling pathways between the mitochondria and the nucleus are appropriate for therapeutic exploitation with bioactive molecules.
Concept of Retrograde Signaling
The hallmark of mitochondrial retrograde signaling is the modification of the expression of nuclear genes induced by a signal from mitochondria [9]. Retrograde signaling must be triggered by a mitochondrial signal that in turn is relayed via molecules that finally reach the nucleus. In mammalian cells, altered nuclear expression in response to mitochondrial dysfunction is reported; a number of signaling pathways being implicated in this retrograde communication [10]. Mitochondrial retrograde signaling is a signaling pathway connecting mitochondria and the nucleus. Signal transducers in the yeast retrograde response are Rtg1p, Rtg2p, and Rtg3p proteins [11]. The outcomes of mitochondrial retrograde signaling go far beyond the maintenance or biogenesis of the organelle, affecting the homeostasis of the whole organism through body weight or immunity.
Concept of Unfolded Protein
Mitochondrial protein homeostasis is maintained through proper folding and assembly of newly translated polypeptides. Several factors challenge the mitochondrial protein-folding environment including reactive oxygen species (ROS) that are generated within mitochondria, as well as environmental situations such as exposure to toxic compounds. To promote efficient mitochondrial protein folding mitochondria possess molecular chaperones located in both the intermembrane space and matrix [12].
UPRmt is a mitochondria-to-nuclear communication mechanism that promotes adaptive regulation of nuclear genes related to mitochondrial response, and metabolism, implicated in the cellular homeostasis [13].
Mitochondrial-Derived Peptides: Classification
MDPs are a series of peptides encoded by mitochondrial DNA. This class of peptides comprises HN, MOTS-c, Small HN-like peptides (SHLPs) and expands the expression of mitochondrial proteome [6].
Humanin
The first MDP discovered back in 2001 was HN; the term based on the potential of this peptide for restoring the “humanity” of Alzheimer’s disease (AD) patients. HN promotes cell survival in response to a variety of insults.
It is a small, secreted, 24 or 21 amino acid peptide, depending on cytoplasmic or mitochondrial translation, respectively. If HN is translated within the mitochondria, the peptide will be 21 amino acids; and if it is translated in the cytoplasm, then the result is a 24 amino acid peptide [14]. HN is encoded by an HN open reading frame (ORF) within the gene for the 16S ribosomal subunit within the mitochondrial genome [15]. HN was discovered during a search for survival factors in unaffected areas of an AD patient’s brain. The initial studies were first performed in cell culture and then followed by in vivo studies using both pharmacological mimetics of AD as well as mutant gene: amyloid-β precursor protein. The most recent studies used transgenic models of AD. As HN is a relatively short peptide, exhaustive mutational analysis of the importance of each amino acid has been possible. Interestingly, single amino acid substitutions of HN can lead to significant alterations in its potency and biologic functions. S14G-HN in which the serine at position 14 is replaced by glycine, is a highly potent analogue of HN.
Finally, HN may be the first small peptide of its kind representing a putative set of MDPs, a novel concept that modifies the established concept about retrograde mitochondrial signaling as well as mitochondrial gene expression. HN is a neuroprotective peptide and a cytoprotective factor against oxidative stress [16].
Mitochondrial Open Reading Frame of the 12S rRNA-c ( MOTS-c)
In addition to HN, an in-silico search of the mitochondrial genome revealed additional potential MDPs. MOTS-c is expressed in various tissues and in circulation (plasma) in rodents and humans, suggesting both a cell-autonomous and hormonal role. Its primary target organ appears to be skeletal muscle and fat. The mitochondrially derived peptide MOTS-c was recently discovered. It is a 16 amino acid peptide located in the 12S rRNA gene. The first 11 amino acid residues of MOTS-c are highly conserved in 14 mammalian species [17]. MOTS-c has been identified as a gene expression regulator in the nucleus, leading to retrograde signaling via its interaction with transcription factors. MOTS-c polymorphism has been found to be associated with human longevity [18]. MOTS-c can prevent insulin resistance, dietmediated obesity, and ameliorate diabetes. MOTS-c oxidizes fatty acids and inhibits oxidative respiration [19]. MOTS-c increased the levels of carnitine metabolism, which transport activated fatty acids into the mitochondria for β-oxidation, increased the level of a β-oxidation intermediate. MOTS-c inhibited the folate cycle at the level of 5Me-THF, resulting in an accumulation of 5-aminoimidazole- 4-carboxamide ribonucleotide, an AMP-activated protein kinase (AMPK) activator. MOTS-c also increased cellular NAD+ levels, which are nucleotide precursors [17,20]. MOTS-c regulated a broad range of genes in response to glucose restriction, including those with antioxidant response elements (ARE), and interacted with ARE-regulating stress-responsive transcription factors [21].
Small HN-like Peptides
Recently, six additional peptides encoded within the mitochondrial 16S rRNA region of mtDNA have been discovered and designed as SHLP1-6. SHLP2 and SHLP3 share similar biological effects with HN. The circulating levels of MOTS-c and SHLP2 decline with age. Various studies suggest that SHLP2 and SHLP3 may participate in the pathogenesis of age-related neurodegenerative diseases. The anti-oxidative stress function of SHLP2, and its neuroprotective effect indicate that SHLP2 has a role in the regulation of aging and age-related diseases [5].
Ageing and Plasma MDPs Levels
Ageing and longevity are or are not characterized by high levels of MDPs? It is speculated that MDPs production turns from protective to detrimental adaptive response; in these conditions, the levels increasing during aging. In some studies, HN levels significantly decline with age in humans. Plasma HN level was significantly lower in the older group (1.3 ± 0.2 ng/mL) than that of the younger group (1.7 ± 0.1 ng/mL) [22]. In other studies, it is reported that HN levels significantly decline with age in humans and animals. HN levels in plasma were measured in young and old mice and across age in humans. HN levels decreased with age in both mice and human (Human plasma levels: 45-65 years: 1400 pg/mL; 80-110 years: 1000 pg/mL) [5].
New results are in contrast with these data. HN plasma levels are evaluated in 693 subjects aged from 21 to 113 years. HN levels increased in old age (>500 pg/mL), with the highest levels found in centenarians (> 1000 pg/mL). The plasmatic levels of HN are significantly positively correlated with age. No gender differences were observed for HN. HN plasma level is associated negatively with body mass index in elderly patients [23]. Concerning the other MDPs, it is reported that MOTS-c and SHLP2 circulating levels decline with age. The circulating SHLP2 levels significantly decreased with age in both male and female C57BL/6 mice (young, 3 months old: 3000 pg/mL; aged, 18 months old: 2500 pg/mL). Male mice had higher SHLP2 levels than female mice in both the young and old groups [5]. The results of these studies should be interpreted considering the following limitations. First, the relatively small sample size in each group represents a potential limitation. Second, mitochondrial diseases are an expanding group of disorders with many metabolic deficiencies. In the ideal case, the used patient cohort should display a homogeneous phenotype, disease stage, and organ specificity. Moreover, the discovery of ageing-related biomarkers is supported by the development of advanced proteomics technology. Changes in the circulating concentrations of human proteins can serve as predictive measures of health and disease [24].
Mechanisms of Action of MDPs
MDPs exert functions through binding to both intracellular molecules and putative cell membrane receptors.
MDPs Receptors
Emerging studies show that MDPs play important roles in cytoprotection and homeostasis. HN has been shown to increase extracellular signal-regulated kinase 1/2 (ERK1/2) phosphorylation through its receptor binding [25]. The ERK1/2 cascade serves as an essential mediator in a lot of cellular processes such as proliferation, cell migration, cellular metabolism, and survival. Upon stimulation, ERK1/2 is phosphorylated and becomes dissociated from its anchoring proteins, allowing the translocation of ERK1/2 to other subcellular compartments. HN has been shown to act as a ligand to two different types of receptors; the seven-transmembrane G-protein-coupled receptor formyl-peptide receptor-like-1 (FPRL1), and a trimeric receptor consisting of ciliary neurotrophic factor receptor (CNTFR), the cytokine receptor WSX-1 and the transmembrane glycoprotein gp130 (CNTFR/WSX- 1/gp130) [26,27].
The first HN receptor FPRL1 has been linked to AD. HN acts as an agonist for FPRL1 by inducing Ca2+ mobilization and activation of ERK1/2 signaling, the pathway of G-protein coupled receptors, which participate to its cytoprotective properties [26]. The second reported HN receptor is the trimeric CNTFR/WSX-1/gp130 complex. The activation of the gp130-STAT3 axis is essential for HN activity. HN induces STAT3 activation, which was required for its neuroprotective effects [27]. Gp130 is part of the receptor complex for several cytokines, including IL-6, IL-27.
Concerning the cytoprotective effects of HN or S14G-HN (HN derived), studies suggest that this protection may be mediated through activation of AMPK in thrombin-mediated activation of endothelial nitric-oxide synthase (eNOS) signaling as well as reduction of pro-apoptotic factors [28]. HN in actives proapoptotic peptides such as Bax. It prevents Bax translocation and activation in response to proapoptotic agents [29].
For more Diabetes and Obesity Journals please click on below link: https://lupinepublishers.com/diabetes-obesity-journal/
For more Lupine Publishers Please click on below link: https://lupinepublishers.com/
#LupinePublishers#LupinePublishersGroup#ADO#Journal of Diabetes and Obesity#Diabetes and Obesity#Archives of Diabetes and Obesity
0 notes
Text
Happy Thanksgiving!!

Today is the time to be thankful, remember good times, and embrace those who enrich our lives. I’m thankful for a lot of things. Happy Thanksgiving to all! from our Archives of Diabetes and Obesity (ADO)
#Lupine Publishers#Lupine Publishers Group#ADO Journal#Doabetes and Obesity Journal#Thanksgiving Day
1 note
·
View note
Text
Lupine Publishers| Variability in Plasma FGF21 Levels in Rats Fed A Standard 15% Protein Diet is not Sensitive Enough to Reflect Differences in Protein Requirements
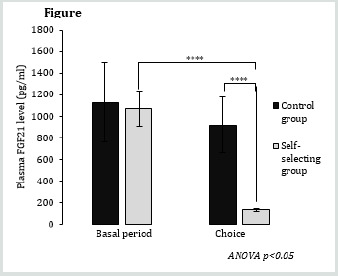
Lupine Publishers| Journal of Diabetes and Obesity
Introduction
Fibroblast growth factor 21 (FGF21) is a hepatokine member of a subfamily of “fibroblast growth factors” that responds to multiple metabolic stresses as protein deficiency [1-4]. FGF21 is produced in various tissues but the FGF21 circulating form is primarily of hepatic origin [1,2]. FGF21 affects numerous metabolic and behavioural parameters, and in particular, increases appetite for protein in subjects fed a protein-deprived diets [5,6]. In a recent still unpublished study, we observed that plasma FGF21 levels were higher in adult male Wistar rats fed a standard diet, formulated according the AIN93 recommendations for rats’ feed, containing 15% protein by energy [7] than in rats fed a 30% protein diet. In addition, inter-individual variability of plasma FGF21 levels was larger in rats fed the standard 15% protein diet than in rats fed the 30% protein diet. We therefore considered the hypothesis that higher levels and inter-individual variability in plasma FGF21 levels in rats fed a standard 15% protein diet would reflect the variability in protein requirements between individuals and thus, that measurement of plasma FGF21 levels can be used as a simple, rapid, and minimally-invasive test to estimate the adequacy of protein intake.
Dietary self-selection is a method that has been largely used in farm animals and laboratory rodents to study the requirements for macronutrients (carbohydrates, lipids and proteins), vitamins and minerals [8,9]. Many studies using this method, in our lab and others, showed that rats self-selecting between a protein diet and a protein-free diet often ingest up to 30-50% of total energy intake as protein [10-15], so much higher than the level considered as sufficient for an optimal growth in adult rats (10-15% by energy), which comforted our hypothesis that 15% dietary protein was possibly not the optimal dietary content.
The objective of this study was to verify that variability in plasma FGF21 levels in rats fed a standard 15% protein diet was indicative of differences in protein requirements. To this end, we have analyzed the relationship between FGF21 levels, and the level of protein subsequently selected during self-selection between a protein diet and a protein-free diet.
Experimental Procedure
24 adult male rats (215-240g) of the Wistar RccHan strain (ENVIGO) were used and individually housed (22°C ± 1°C, 12/12 L/D, cycle lights on at 08:00). After 1 week of adaptation to the laboratory conditions, the rats were fed for 12 days (Basal period) a standard diet formulated according to the AIN93 requirements [7] that contained 15% protein (15P); then, for 28 days (Choice period), 6 rats (Control group) continued to be fed with the standard diet and 18 (Self-selecting group) were given a choice between a pure protein diet (100P) and a protein-free diet containing a mix of fat (soy oil) and carbohydrate (corn starch and sucrose) in which carbohydrate amounted 60% by energy. The diets were provided, as necessary.
The food pellets were prepared twice a week by mixing the macronutrients, vitamins, and mineral mix with the amount of water required to make a thick dough. Food intake (g/day) was measured twice a week and converted in kJ/day based on the energy content of the diets (Table 1).
Table 1: Composition and energy content of the 3 used diets.
100P: diet containing only proteins; 60C: protein-free diet containing only lipids and carbohydrates and in which carbohydrates amounted 60% by energy; 15P: standard diet containing 15% of protein by energy.
Blood samples (0.5 mL) were collected from the tail vein in EDTA tubes: once during the basal period and once during the choice period. Blood collection was made in the morning (10:00- 12:00) in rats that were not previously fasted. Blood samples were centrifuged (5000g, 15min, 4°C) and the plasma stored at -20°C. Plasma FGF21 levels (pg/ml) were measured by ELISA tests using commercial kits from Bio Vendor (Mouse/Rat FGF-21 ELISA RD291108200R).
Statistical Analysis
Statistical tests were performed using RStudio software, 2015. Changes in protein intake and plasma FGF21 level were compared using mixed two-factor ANOVA tests (parameter ~ group*period), which were followed by the main effects analysis by Bonferroni adjusted pairwise comparisons. Values are presented as means ± standard error of the mean (SEM). Linear regression analysis was used to study the link between plasma FGF21 levels during the basal period and protein intake during the choice period and was performed using Excel software. Significance of correlations was assessed using the Pearson correlation coefficient. A threshold of P≤0.05 was chosen as significant.
Results and Discussion
Protein intake was similar between the control and selfselecting group during the basal period but increased by 80% in the self-selecting group during the choice period (+37.8 kJ/d, p<0.0001) (Figure 1). This response significantly increased the contribution of protein to total energy intake from 15.0% to 23.5% (p<0.001). Mean plasma FGF21 levels averaged ~1,100 pg/mL in both groups during the basal period and decreased to 131 pg/mL in self-selecting group during the choice period (P<0.001) (Figure 2). Finally, contrary to our hypothesis, not only did we not observe a positive correlation between plasma FGF21 levels during the basal period and protein intake during the choice period, but instead we observed a weak and inverse correlation (Figure 3).
Conclusion
In conclusion, inter-individual variability in plasma FGF21 levels in rats fed a standard 15% protein diet did not appear to be a parameter sensitive enough to reflect inter-individual differences in protein requirements. Therefore, plasma FGF21 level cannot be used as a test to determine inter-individual variability in protein requirements in individuals. Nevertheless we observed that plasma FGF21 levels in P15 fed rats were ~7 fold higher than in selfselecting rats ingesting 23.5% protein, which points on the fact that changes in plasma FGF21 levels are very sensitive to dietary protein intake, even when protein intake is well above essential protein requirements (~8-10 % in adult male rats).
For more Diabetes and Obesity Journals please click on below link: https://lupinepublishers.com/diabetes-obesity-journal/
For more Lupine Publishers Please click on below link: https://lupinepublishers.com/
#Lupine Publishers#Lupine Publishers Group#ADO#Journal of Diabetes and Obesity#Archives of Diabetes and Obesity
0 notes
Text
Lupine Publishers| Excess Weight, Obesity, Diabetes and Coronavirus Disease
Lupine Publishers| Archives of Diabetes and Obesity

Introduction
SARS-CoV-2 virus has created an unprecedented public health and global economic crisis. Despite the fact, that this virus was discovered half a century ago, earlier version of this RNA virus (SARS-CoV) was less virulent than the 2019 version of the virus (CoV-2), which turned out to be the most potent killer virus. According to the Johns Hopkins University (JHU) Coronavirus Resources Center (coronavirus.jhu.edu), globally there are 28 million Covid-19 infected individuals and 900,000 deaths. In the USA, we have over 6.4 million infected individuals and 192,000 confirmed covid-related deaths. The response from the public health perspective is important, to prevent further escalation of the SARS-CoV-2 epidemic. Having said that, it is important to note, that each country has responded differently. Vietnam, and Taiwan have done well in keeping the Covid-19 infection rate and death to a minimum. Public health experts worldwide, should study the response of Taiwan, in preventing the spread of this highly contagious disease, without massive tests and lockdowns. Currently the oldest (USA) and the youngest (India) democracies, are competing for the number one position, interns of highest number of infected individuals. India has over 4.5 million infected individuals and 76,000 deaths. According to the JHU report dated September 10, 2020, Mexico has the highest observed case-fatality ratio (CFR) of 10.7%, compared to the USA (3.0%), and India (1.7%). In earlier articles we have discussed the role of comorbidities such as hypertension, excess weight, obesity, diabetes (Type-2) and vascular diseases, on the severity of Covid-19 infection [1-6]. However, if one looks at this situation from a historic perspective, in the last four decades cardiometabolic disease such as hypertension, excess weight, obesity, diabetes (Type-2), and vascular diseases, have increased in prevalence and incidence to epidemic proportions worldwide [7-16]. Added to this global burden of metabolic diseases, a killer virus has taken advantage of the existence of these metabolic risks, which are known to promote, oxidative stress, inflammation, vascular and immune dysfunction.
China Medical Treatment Expert Group for Covid-19, reported in January of 2019, that on admission, 20-51% of patients reported as having at least one comorbidity, with diabetes (10-20%), hypertension (10-15%), and other cardiovascular diseases (7-40%) being the most common [17]. In this guest editorial, we will briefly discuss the role of metabolic diseases such as hypertension, obesity, and diabetes in the progression and severity of the coronavirus disease. According to news reports, the first group of people to get hit by the virus in Italy were the elderly. They also noted that Italy has the second oldest population in the world, after Japan. Irony of this comparison is, that Japan did not suffer such devastating effect from the SARS-CoV-2 as Italy and Spain. In China, of the 1590 patients hospitalized in the early days of Covid-19 pandemic, the mean age was 48.9 years. In the USA, rates were highest among persons aged 65 years (12.2%), 65-74 (17.2%), and population older than 85 (54.4%). Public health experts believed that younger population was less susceptible for the SARS-CoV-2 infection. As is with any prediction about the Covid-19, the story keeps changing as the timeline changes. Currently there are over 500,000 infected young students in the USA. Earlier reports from China, indicated hypertension and diabetes (Type-2) as the two major comorbidities. However, in the recent months, dozens of studies have reported that many of the sickest patients have been people with obesity [18]. Furthermore, studies have demonstrated that even people who are merely overweight, also are at higher risk for Covid-19. The study by Ogden et al reported, the prevalence of childhood and adolescent obesity, and noticed grater increases (2-fold) in non-Hispanic Black and Mexican American adolescents [19]. This is particularly concerning, because adolescents with severe obesity are at high risk for the development of serious comorbidities including hypertension, diabetes as well as Covid-19. In a recent editorial in JAMA, Rodgers and Gibbons discuss the role of obesity and hypertension as comorbidities of Covid-19. SARS-CoV-2 pandemic has brought out the susceptibility of minority communities of color, and has exposed the complex interplay of contributing factors, that are rooted in the social determinants of health, and racial inequities. A 6-fold increase in the rate of death for African Americans, living in the USA due to a ubiquitous virus should be deemed unconscionable, as reported in the recent issue of JAMA (April15, 2020). What is currently known about these differences in disease risk and fatality rates? In Chicago, more than 50% of COVID-19 cases and nearly 70% of COVID-19 deaths involve African American individuals, although they make up only 30% of the population. This trend can me tracked down in various US Cities. Poor living conditions, health care disparity, unhealthy nutrition, and high incidence of metabolic diseases, seem to contribute to the excess CFR in this ethnic group, as well as in other minority communities [20, 21].
Considering the contribution of comorbidities to the progression and severity of the coronavirus disease, one would expect that China and India, with the largest populations of diabetic subjects, should have the highest CFR (Deaths per 100,000 population) for Covid-19. On the other hand, Mexico (10.7%), Iran (5.8%), and Spain (5.4%) have lot more mortality than the USA (3.0%) and India (1.7%). Since the two major populations with highest number of diabetics have not shown comparatively high case fatality rate, it is worthwhile discussing the other two comorbidities (hypertension and obesity) as the chief contributors for the Covid-19 progression and severity. Trends in the prevalence of hypertension in the USA, according to the NHANCE survey of age standardized prevalence, decreased from 48.4% in 1999-2000 to 45.4% in 2015-2016. However, absolute burden of hypertension consistently increased, from 87.0 million in 1999-2000 to 108 million in 2015-2016 [22]. Hypertension appears to be more common in Mexico, than among Mexican Immigrants in the United States. As far as the obesity goes, the number of obese children and adolescents aged five to 19 years, has risen tenfold in the past four decades and if current trends continue, there will be more obese children and adolescents than those moderately or severely [23]. Among adolescents, obesity prevalence in the USA was 16.8% in 2007 and 18.5% in 2016. Age standardized obesity in adults increased from 33.7% in 2007 to 39.6% in 2015. Whereas, 62% of the participants in Mexico reported, at least, being overweight [24]. When considering obesity data based on the BMI, we should keep in mind that South Asians have a different body fat distribution, compared to the European and Western population. South Asians in general have central abdominal obesity.
Data from 6916 patient records that researchers from Kaiser Permanente reported, compared to normal body mass index (BMI) of 18-24 Kg/m2, the risk of death more than doubled for patients with a BMI of 40-44 Kg/m2 and nearly doubled again, for those with a BMI of 45kg/m2 or more [25] In an accompanying editorial, David A Kass, a Cardiologist at the Johns Hopkins University, wrote, “that these findings taken with prior research -should put to rest the contention that obesity is common in severe COVID-19, -because it is common in the population.” The pathophysiology of hypertension involves, complex interaction of multiple vascular effectors, including activation of the sympathetic nervous system, of the renin-angiotensin-aldosterone system, and of the inflammatory mediators. Oxidative stress and endothelial dysfunction are consistently observed in hypertensive subjects [26]. As we have discussed earlier, obesity has reached epidemic proportions worldwide. In the USA alone, the prevalence of obesity has increased 50% in the past three decades, with 70% of all adults being classified as either overweight or obese [27]. Beyond an impaired response to infections, people with obesity also suffer from chronic, low grade inflammation. Fat cells secrete inflammation triggering chemical messengers called cytokines, and more come from immune cells called macrophages, that clean up dead and dying fat cells. These in turn, impair vascular homeostasis and lead to endothelial dysfunction [28].
If we carefully analyze a series of clinical events, that develop post SARS-CoV-2 infection, we can begin to understand, why metabolic diseases serve as independent risk factors for the progression and severity of coronavirus disease. Initial route of entry is via nasal and oral mucosa, -the preferred receptor that facilitates the transmission seems to be the ubiquitous ACE2, which is found in multiple types of cells and tissue including vascular endothelium. Recent findings, that following the injury to the lung tissue, the virus gets entry into the endothelium, opens a whole new avenue for the progress of the disease and its severity. Endothelium is the largest organ of the body, covering a large surface area and reaching out to every tissue and organ. As such, the injury to the endothelium could introduce a cascade of events, leading to platelet activation, thrombin generation, and promotion of both thrombotic and thrombolytic events [3]. Furthermore, people with metabolic diseases such as, hypertension, excess weight, obesity, diabetes (Type-2), and vascular disease, already have a compromised endothelium and invasion of the SARS-CoV-2 virus leads to further injury to the vascular system, by the disruption of vascular integrity and endothelial cell death. These events lead to the exposure of the subendothelial basement membrane, and results in the activation of thrombotic and clotting cascade of events.
The question of why China and India with the largest populations of diabetics, have relatively low rates of Covid-related mortality, is quite puzzling. In China, -Covid-19 pandemic’s epicenter, Wuhan, and its province, Hubei, Chinese Center for Disease Control-network, formed 1300 epidemic investigation teams, in addition to the 40,000 doctors and nurses. They used very clever tracing tools with big data support. In the first week of January the novel coronavirus infection was detected, and on 23 January 2020, they locked down the city of 11 million people and soon the rest of the Hubei-a province of nearly 60 million. The WHO-China Joint Mission on Coronavirus Disease 2019 Task Force concluded, “In the face of unknown virus, China has rolled out perhaps the most ambitious, agile, and aggressive, disease containment effort in history.” The strategy that underpinned this containment effort was initially a national approach, that promoted universal temperature monitoring, masking, and hand washing [29]. As far as India is concerned, the general population thinks, that they have innate immunity, as they are exposed to a variety of Asian viruses. On the other hand, some scientists speculate that the SARS-CoV-2 in India is a milder version, compared to the European and US strains. According to a news report by Rajesh Nair in ‘The Hindu’ of September 11, 2020, “Diabetes seems to be the main cause of COVID-19 deaths in the Union Territories (UT) of India. A survey conducted by the Jawaharlal Institute of Postgraduate Medical Sciences and Research (JIPMER) showed 30% of the government servants in Puducherry (UT) were diabetic.
In the same report by Nair, Emergency Surgeon of New Medical Center, Dr T. Arjun Sundaram expresses his optimism by saying, “It is an obedient (SARS-CoV-2) virus, if treated early for even people with comorbidities. But people with comorbidities try to ignore early symptoms, as part of their existing medical conditions, - just as flu-like symptoms.” Comorbidities such as hypertension, excess weight, obesity, diabetes, and vascular diseases increase COVID-19 related hospitalization by 6-fold and deaths, by 12-fold. In a recent report from the USA, underlying conditions were reported in 71% of individuals admitted to hospital with COVID-19 and in 94% of the deaths [30]. In a study done at Westchester County, New York, among Covid-19 patients, who presented with a comorbid condition, more than 57% had high blood pressure, while 41.7% were obese and 33.8% had diabetes. This study also found 90% of coronavirus patients, who were put on ventilators died. A recent global estimate published in Lancet, estimated that one in five individuals worldwide are at risk for infection by SARS-CoV-2 virus. A recent report by Jain and associates from New Delhi, India, discusses differential mortality in COVID-19 patients from India and Western Countries [31]. The authors discuss the age of the population, genetics of the virus, mutation of the virus, immune variations of Indian subjects and the expression of the ACE2 receptor in the adipose tissue.
Authors claim that they have investigated and identified the possible reasons and hypotheses for this disparity in observed or reported Covid-19 related mortality. However, we feel strongly, that there may be other, as yet unknown causes, and only future history will reveal all the mysteries of coronavirus disease.
https://lupinepublishers.com/diabetes-obesity-journal/fulltext/excess-weight-obesity-diabetes-and-coronavirus-disease.ID.000152.php
For more Lupine Publishers Open Access Journals Please visit our website: https://lupinepublishersgroup.com/
For more Archives of Diabetes & Obesity(ADO) Please Click Here: https://lupinepublishers.com/diabetes-obesity-journal/ To Know more Open Access Publishers Click on Lupine Publishers
Follow on Linkedin : https://www.linkedin.com/company/lupinepublishers Follow on Twitter : https://twitter.com/lupine_online
0 notes
Text
Lupine Publishers| Factors Responsible for Diabetes Elevated Blood Pressure Among Bangladesh Adults
Lupine Publishers| Archives of Diabetes and Obesity (ADO)
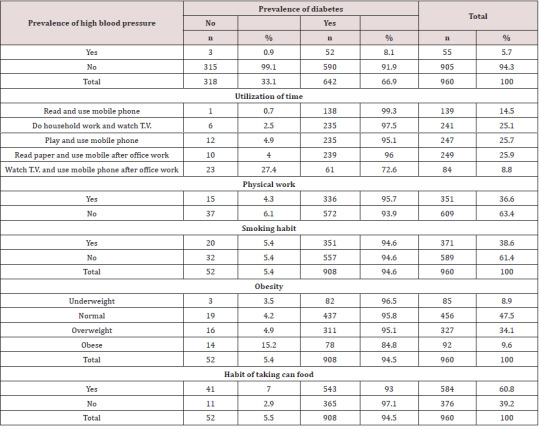
Abstract
The analytical results presented here were based on data collected from 960 adults of ages 18 years and above residing in both urban and rural areas of Bangladesh. The data were collected by some doctors and nurses from and nearby their working places according to quota sampling plan. The objective of the study was to investigate the impacts of different socioeconomic variables on simultaneous sufferings of adults from diabetes and high blood pressure and to identify the most responsible variables for this suffering. The analysis indicated that 5.4 percent adults were simultaneously suffering from both diabetes and elevated blood pressure. The most responsible variable for the diseases was occupation followed by gender variation, income and expenditure. The results of risk ratio and factor analysis indicated that the females and physically inactive adults had the more chance of affecting by the disease. Males, non- user of can food and skilled or unskilled working group had less chance of affected by the disease. The variables were identified by factor analysis.
Keywords: Diabetes; Elevated Blood Pressure; Socioeconomic Variables; Risk Ratio; Standard Error of ln (Risk Ratio); Factor Analysis; Factor Loading
Introduction
Diabetes is one of the most risky health hazard which can enhance many non-communicable diseases like cardiovascular diseases, hypertension, kidney diseases, retinopathy, sensory system and so –fourth. Again, hypertension and or elevated blood pressure, though it is curable NCDs, is the primary risk factor for cardiovascular disease including stroke, heart failure, heart attack and aneurysm [1-8]. The elevated blood pressure is considered if systolic blood pressure is greater than or equal to 140 mmHg and diastolic blood pressure is greater than or equal to 90 mmHg [9,10]. In 2015, I in 4 men and 1 in 5 women had hypertension [1]. Number of adults with hypertension increased from 594 million in 1975 to 1.13 billion in 2015 [1,11]. The increase was noted in low-and middle-income countries. The prevalence rate was 28.6 percent among adults of ages 18 years and above [3]. Prevalence was increased significantly with age, ranging from 6.8 percent among individuals aged 18 to 39 years to 30.4 percent in those aged 40 to 59 years and 66.7 percent in individuals aged 60 years and above [4]. In Bangladesh, according to JNC 7 guidelines the prevalence of hypertension was 17.9 percent [10].
Urban adults, elderly adults, adults with physical inactivity, obese and diabetic adults were more likely to have hypertension [10]. People with both diabetes and hypertension have approximately twice the risk of cardiovascular diseases compared to the people with non-diabetic hypertension [12]. The prevalence of hypertension among diabetic patients is around three times compared to the people of non-diabetic hypertension [13]. Diabetes is the targeted disease by WHO as it has some social and economic consequences [14-17]. Accordingly, the problem is addressed to reduce the prevalence of the disease. Still, upward trend in deaths due to diabetes is noted [16]. This is true for both home and abroad [17]. It was reported that, approximately 463 million adults of ages 20-79 years worldwide were diabetic [17]. This figure will be increased up to 700 million in 2045. In a separate report, it was mentioned that 1 in 5 diabetic patients were at the age above 65 years and 2 in 3 were urban residents [18,19].
In one study, it was observed that most of the Bangladeshi urban adults (36.3%) were suffering from diabetes [20]. Both diabetes and hypertension are in alarming stage for elderly people in both home and abroad. Thus, the simultaneous impact of diabetes and elevated blood pressure needs to be considered and how these diseases are influenced by different socioeconomic variables are needed to be studied. For this reason, the objective of the study was to observe the association of the prevalence of both the diseases simultaneously with different socioeconomic variables and to identify the variables responsible for both the diseases among adults. The responsible variables were identified by factor analysis.
Methodology
The present work was done by analyzing the data collected from adults of ages 18 years and above residing in both urban and rural areas of Bangladesh. The investigated adults were 960. They were available for investigation nearby the working places of some doctors and nurses when they were doing their Master of Public Health degree in American International University- Bangladesh during the academic session 2017-18. These adults were investigated by quota sampling method to cover around 70% diabetic patients [21]. The objective to cover this number of diabetic patients was to ensure a good amount of elevated blood pressure people simultaneously suffering from diabetes [1]. For comparative study, a good number of normal subjects were also investigated. Finally, 960 adults were interviewed, and data were recorded through a pre-designed and pre-tested questionnaire.
The questionnaire contained different questions related to different socioeconomic variables of the respondents and of the families. The main questions for families were related to the monthly family income and monthly family expenditure. The questions for the diabetic adults were related to the duration of disease, disease related health hazard, i.e. eye problem, kidney problem, heart problem, blood pressure, blood sugar, treatment stage of disease, admission into hospital, etc. Beside these, the other questions were related to personal habit, viz. food habit, working habit, physical activity, utilization of time, etc. The collected personal information were residence, religion, marital status, age, height, weight, education, and occupation. Some of the above-mentioned variables were qualitative and some were quantitative in nature. All the recorded variables were measured in nominal scale by assigning numbers. Height and weight were used to measure the level of obesity and level of obesity was measured by the value of BMI, where BMI was calculated by weight (in kg) divided by height (in meter2). The respondents were classified as underweight (BMI < 20), normal (BMI = 20 and above but less than 25), overweight (BMI = 25 and above but less than 30) and obese (BMI ≥ 30).
At the first step of analysis, association of level of prevalence of diabetes and prevalence of elevated blood pressure [if diastolic blood pressure ≥ 90 mmHg and systolic blood pressure ≥ 140 mmHg] was investigated. The association of socioeconomic variables and prevalence of diabetes and high blood pressure were investigated by Chi-square test, where significant association was decided if the p-value of Chi-square statistic is less than or equal to 0.05. Some diabetic adults were at higher risk of elevated blood pressure compared to others. To study this characteristic the risk ratio (R.R.) along with standard error of ln (R.R.) for a particular level of a social variable compared to the level of the variable which did not create problem for the disease was calculated. Factor analysis was done to identify the most responsible variables to create problems simultaneously for diabetes and high blood pressure among the adults. Important variables which did not create simultaneously problem of diabetes and higher blood pressure among adults were also detected. The importance of the variables were decided by the highest absolute value of factor loading [22, 23]. The analysis was done using the SPSS [Version 25].
Results
The investigated adults were classified into two groups according to the prevalence of diabetes. There were 66.9 percent diabetic respondents and 8.1 percent of them were suffering from high blood pressure (Table 1) also. The prevalence of diabetes and prevalence of high blood pressure were significantly associated as is observed by Chi-square test [χ2 = 20.17, p –value = 0.000]. The diabetic patients were at higher risk of high blood pressure by 45 percent compared to the risk of non-diabetic adults [R.R =1.45, S.E. ln (R.R.) = 0.0405]. It was also observed that 5.7 percent adults were suffering from elevated blood pressure but 94.5 percent of them were the patients of diabetes also. They were suffering for different periods. Eight of them were suffering for less than 5 years, 18 were suffering for 5 but less than 10 years, 11 were suffering for 10 to less than 15 years and 15 were suffering for 15 years and above.
https://lupinepublishers.com/diabetes-obesity-journal/fulltext/factors-responsible-for-diabetes-elevated-blood-pressure-among-bangladesh-adults.ID.000151.php
For more Lupine Publishers Open Access Journals Please visit our website: https://lupinepublishersgroup.com/
For more Archives of Diabetes & Obesity(ADO) Please Click Here: https://lupinepublishers.com/diabetes-obesity-journal/ To Know more Open Access Publishers Click on Lupine Publishers
Follow on Linkedin : https://www.linkedin.com/company/lupinepublishers Follow on Twitter : https://twitter.com/lupine_online
0 notes
Text
Lupine Publishers| Combination Therapy Using Sodium-Glucose Co- Transporter 2 Inhibitors and Glucagon-Like Peptide-1 Receptor Agonists for Treatment of Type 2 Diabetes
Lupine Publishers | Archives of Diabetes & Obesity (ADO)

Abstract
Background:The 2 drug classes of glucagon-like peptide-1 receptor agonists (GLP-1RAs) and sodium-glucose co-transporter 2 (SGLT2) inhibitors are approved for type 2 diabetes, but their concomitant use was not sufficiently studied.Aim: To assess the safety and efficacy of the combination of GLP-1RAs and SGLT2 inhibitors in type 2 diabetes.
Methods: Systematic review of English literature by search of electronic databases: Pub/MEDLINE from 2000 until July 2, 2020. Search terms included GLP-1 receptor agonists, SGLT2 inhibitors, combination therapy, add-on therapy, type 2 diabetes, efficacy, safety. Randomized trials were included with more focus on double-blind, placebo-controlled trials. Post-hoc analysis and consensus guidelines are also reviewed.
Results: One randomized trial evaluated the co-initiation of weekly exenatide plus dapagliflozin in patients with type 2 diabetes uncontrolled on metformin. After 52 weeks, the reduction in glycated hemoglobin (HbA1c) levels with the combination therapy was less than additive being 1.75%, 1.36%, and 1.23% with weekly exenatide + dapagliflozin, weekly exenatide + placebo and dapagliflozin + placebo, respectively. Two randomized trials evaluated the sequential addition of GLP-1 RA to ongoing SGLT2 inhibitor therapy. Both trials reported greater HbA1c reduction averaging 0.8-1.4% compared with SGLT2 inhibitor + placebo. The combination of GLP-1 RA + SGLT2 inhibitor caused significant weight loss of approximately 3.3 kg, which was slightly less than additive, and 4.5 mmHg reduction in systolic blood pressure (SBP), which was more than additive. In general, the adverse effects of combination therapy were expected, with no emergence of unusual adverse effects. The least tolerated combination included semaglutide due to relatively high rates of gastrointestinal adverse events and mild hypoglycemia.
Conclusions: Combination therapy of GLP-1 RA plus SGLT2 inhibitor is overall effective and safe. Further studies are needed to examine the effects of this combination on cardiovascular (CV), renal and mortality outcomes.
Keywords: Glucagon-like peptide-1 receptor agonist; SGLT-2 inhibitor; combination; efficacy; safety
Introduction
The rationale of using a combination of a GLP-1RA plus SGLT- 2 inhibitor relies on many factors. First, these 2 classes of drugs have different mechanisms of actions. Thus, GLP-1 RAs stimulates insulin secretion, decrease glucagon secretion, slow gastric emptying, and promotes early satiety, whereas SGLT2 inhibitors increase urinary glucose excretion [1,2]. Second, both drug classes are associated with minimal risk of hypoglycemia [1,2]. Third, and most importantly, several drugs in both classes were shown in welldesigned clinical trials to reduce CV and renal events and mortality in patients with type 2 diabetes and atherosclerotic vascular and renal diseases [3-6]. Unfortunately, data regarding the GLP-1RA/ SGLT-2 inhibitor combination is limited. The main purpose of this article is to review clinical trials that evaluate the efficacy and safety of the use of GLP-1RA plus SGLT-2 inhibitor in patients with type 2 diabetes.
Results from Randomized Double-Blind, Placebo- Controlled Trials
There are 3 randomized trials specifically designed to examine the efficacy and safety of the combination of GLP-1 RAs and SGLT2 inhibitors [7-9]. In the DURATION-8 trial [7], the authors evaluated the simultaneous addition of drugs from both classes, whereas in the AWARD-10 [8] and SUSTAIN-9 [9] trials, the investigators used a sequential approach. Overview of these trials are presented below and summarized in (Table 1).
Table 1: Overview of randomized trials of GLP-1 receptor agonist plus SGLT2 inhibitor.
Data are means.
* Most common SGLT2 inhibitors are empagliflozin 10 mg/d, and dapagliflozin 10 mg/d.
**Minor hypoglycemia defined as blood glucose < 54 mg/dl, and no loss of consciousness.
Simultaneous Addition of GLP-1 RAs and SGLT2 Inhibitors
In the DURATION-8 trial, Jabbour and colleagues randomized patients with type 2 diabetes uncontrolled on metformin (mean baseline HbA1c 9.3%) to 3 drug regimens: weekly exenatide 2 mg subcutaneously plus once daily dapagliflozin 10 mg, exenatide + oral placebo, and dapagliflozin plus injected placebo [7]. After 52 weeks, mean reductions in HbA1c levels were -1.75%, -1.38%, and -1.23%, respectively [7]. Although the reduction in HbA1c values was statistically significant in the combination group compared with the other 2 groups, the decrease in HbA1c values was clearly less than additive.
Sequential Addition of GLP-1 RAs to Ongoing SGLT2 Inhibitors
In the AWARD-10 trial, Ludvik et al evaluated the GLP-1 RA, dulaglutide, in 2 doses 1.5 mg sc once weekly and 0.75 mg sc once weekly versus placebo as add-on therapy to ongoing SGLT2 inhibitors [8]. After 24 weeks, the reductions in mean HbA1c levels were 1.34%, 1.21%, and 0.54% in patients randomized to dulaglutide 1.5 mg, 0.75 mg, and placebo, respectively: (P<0.0001 for both dulaglutide groups vs placebo) [8].
In the SUSTAIN 9 trial, Zinman, et al. evaluated another GLP-1 receptor agonist, semaglutide 1.0 mg sc once weekly, vs placebo [9]. After 30 weeks, the decreases in mean HbA1c values were 1.5% and 0.1% in the semaglutide and placebo group, respectively; P< 0.0001 vs placebo [9].
Sequential Addition of SGLT2 Inhibitors to Ongoing Therapy With GLP-1 RAs
Limited data from Japanese non-placebo, controlled studies examined the addition of the SGLT2 inhibitors: empagliflozin, canagliflozin and luseogliflozin to ongoing therapy with GLP-1 RA liraglutide 0.9 mg sc day, the maximum approved dose in Japan [10-12]. These 3 studies showed further reduction in mean HbA1c levels (approximately 0.7%), weight (2.7-3.3 kg), and SBP (7.9-8.4 mmHg) 52 weeks after the addition of SGLT2 inhibitors [10-12]. The previous combination therapy was well tolerated with no safety concerns [10-12].
Effect on Weight
The GLP-1 RA/SGLT2 inhibitor combination, whether given simultaneously or sequentially, is associated with weight loss. The magnitude of weight loss is slightly less than additive [8]. The latter finding is expected since mechanisms of weight loss are different between the 2 drug classes. Thus, GLP-1 agonists delay gastric emptying and promote early satiety, whereas weight reduction with use of SGLT2 inhibitors is mainly attributed to caloric loss secondary to glycosuria [1,2]. Using bioelectrical impedance analysis, Seino at al [12] investigated patterns of weight loss in 21 Japanese patients with type 2 diabetes 52 weeks after addition of the SGLT2 inhibitor luseogliflozin to ongoing liraglutide treatment. They found that weight loss was mostly due to loss of fat mass (2.49 kg), whereas reduction in lean mass was minimal (0.44 kg) [12]. Likewise, in a small group of Swedish 25 obese subjects (mean weight 106.4 kg) without diabetes, Lundkvist et al [13] reported a mean weight loss of 5.7 kg after 52 weeks of administration of dapagliflozin 10 mg/d + weekly exenatide 2 mg sc. By using magnetic resonant imaging, they found that most of this weight loss was due to loss of adipose tissue (5.31 L), and to a lesser extent lean tissue (1.36 L) [13].
Effect on Blood Pressure
The addition of GLP-1 RA to SGLT2 inhibitors in simultaneous or sequential manner consistently exerts further reduction in SBP [7-12]. Unlike reduction in HbA1c levels, this reduction in SBP was more than additive [7]. On the other hand, no significant difference in diastolic blood pressure was reported in most trials between monotherapy and combination therapy [7-9].
Effects on Other Intermediate Outcomes
Changes in lipid panel are minor with combination therapy compared with monotherapy. Combination therapy is associated with mild reduction in plasma triglycerides levels (10-12% lower than monotherapy) [6,9]. In SUSTAIN-9 trial, levels of low-density lipoprotein cholesterol (LDL-C) are 10% lower in the combination group formed of semaglutide + SGLT2 inhibitor than in the group receiving SGLT2 inhibitor monotherapy, but no inter-group changes were reported with respect to high-density lipoprotein cholesterol (HDL-C) [9].
Post-hoc analysis of the DURATION-8 study showed that the combination of exenatide once weekly plus dapagliflozin showed stronger effects on markers of liver steatosis and fibrosis compared with each drug alone after 28 weeks of treatment [14].
SGLT2 inhibitors are known to enhance ketosis and increase serum ketones leading uncommonly to development of diabetic ketoacidosis. Interestingly, the addition of exenatide once weekly to dapagliflozin abolished the dapagliflozin-induced rise in serum ketones. Meanwhile, the addition of exenatide maintained beneficial effects of dapagliflozin such as glycosuria and increase hematocrit after 52 weeks of treatment [15].
Effects on CV outcomes and mortality
Clinical trials designed to evaluate the effects of the combination of GLP-1 RAs and SGLT2 inhibitors on CV, renal and mortality outcomes are lacking. However, the available limited data suggest that this combination might reduce CV events. Thus, in the DURATION-8 trial, adjudicated CV events were reported in 1 (0.4%), 3 (1.3%), and 3 patients (1.3%) randomized to exenatide + dapagliflozin, exenatide + placebo, and dapagliflozin + placebo, respectively after 52 weeks [7]. In addition, post hoc subgroup analysis of the EXSCEL, a large CV trial, showed nominally significant reduction in risk of all-cause mortality among patients who received combination of weekly exenatide plus a SGLT2 inhibitor as compared with placebo (hazard ratio 0.38, 95% CI 0.16-0.90), or with weekly exenatide alone (hazard ratio 0.41, 95% CI 0.17-0.95) [16]. Rates of CV death showed similar direction [16]. Moreover, the previous drug combination was more effective than placebo or weekly exenatide alone in slowing progression of diabetic nephropathy as reflected by the improvement in slope of estimated glomerular filtration rate (eGFR) [16]. Although these preliminary results are encouraging, they have to be confirmed by dedicated randomized trials.
Safety of the Combination of GLP-1 RA Plus SGLT2 Inhibitor
The combination of SGLT2 inhibitors and GLP-1 RAs are generally well-tolerated, with no evidence of emergence of unexpected adverse effects or safety signals. The least tolerated combination includes semaglutide, as reflected by the relatively high discontinuation rates due to adverse effects (Table 1). The most common adverse effects occurring after the addition of GLP-1 RAs to SGLT2 inhibitors are gastrointestinal, mainly nausea and diarrhea, generally described as mild to moderate in intensity (Table 1). However, 6.7% of semaglutide-treated patients discontinued treatment prematurely due to gastrointestinal adverse effects compared to none in the placebo group [9]. Incidence of hypoglycemia was minimally increased with addition of exenatide or dulaglutide to SGLT2 inhibitors (Table 1) [7,8]. Yet, risk of hypoglycemia was substantially increased with the addition of semaglutide to SGLT2 inhibitors [9]. In fact, 17 patients (11.3%) randomized to semaglutide reported hypoglycemia compared with 3 patients (2.0%) receiving placebo [9]. Severe or blood glucoseconfirmed hypoglycemia < 55.8 mg/dl occurred in 4 patients (2.7%) in the semaglutide group and in none in the placebo group [9]. Diabetic ketoacidosis, an uncommon adverse effect of SGLT2 inhibitors, was not reported so far with the use of the agents with GLP-1 RAs.
Conclusion
The combination of GLP-1 RA/SGLT2 inhibitor represents a promising approach for treatment of type 2 diabetes. However, this approach is not without limitations (Table 2). The concomitant use of this combination provides significant reduction in HbA1c levels, body weight and SBP beyond that achieved by monotherapy alone. Hence, the best candidate for this combination would be a patient with type 2 diabetes uncontrolled on metformin who suffers from weight gain and/or hypertension. Recently, the American Diabetes Association (ADA) and the European Association for the study of diabetes (EASD) recommended using the combination therapy of SGLT2 inhibitor + GLP-1 RA in a subgroup of patients with type 2 diabetes [17]. This subgroup consists of patients with suboptimal glycemic control on monotherapy and has established atherosclerotic CV disease, heart failure or chronic kidney disease [17]. In the meantime, both Associations admitted lack of evidence for the latter recommendation from randomized clinical trials. Such trials are urgently needed to evaluate the effects of the GLP- 1 RA/SGLT2 inhibitor combination on cardio-renal outcomes and mortality, to determine the optimum drug combination, and characterize patients likely to derive most of the benefit from this combination.
Table 2: Advantages and limitations of combination of GLP-1 RAs and SG LT2 inhibitors.
https://lupinepublishers.com/diabetes-obesity-journal/fulltext/combination-therapy-using-sodium-glucose-co-transporter-2-inhibitors-and-glucagon.ID.000149.php
For more Lupine Publishers Open Access Journals Please visit our website: https://lupinepublishersgroup.com/
For more Archives of Diabetes & Obesity(ADO) Please Click Here: https://lupinepublishers.com/diabetes-obesity-journal/ To Know more Open Access Publishers Click on Lupine Publishers
Follow on Linkedin : https://www.linkedin.com/company/lupinepublishers Follow on Twitter : https://twitter.com/lupine_online
0 notes
Text
Lupine Publishers| Inequalities in Diabetes in the USA
Lupine Publishers | Archives of Diabetes & Obesity (ADO)

Abstract
Background: Diabetes disproportionably impacts minorities in the USA.
Objective: To review the latest data regarding diabetes epidemiology and management among different ethnic groups in the USA.
Methods: PubMed research of all pertinent articles up to June 29, 2020. Search terms included diabetes, ethnicity, African Americans, Blacks, Hispanics, Latinos, Asians, minorities, glycemic control, obesity, lifestyle changes, treatment, metformin, sodiumglucose co-transporter 2 inhibitors. Type of studies included are randomized, observational, epidemiological, consensus guidelines, and review articles.
Results: Diabetes prevalence and incidence in adults continue to increase among African Americans and Hispanics. In youths, the fastest increase in type 1 and type 2 diabetes occurs among Asians/Pacific Islanders followed by Hispanics and African Americans. The gap in glycemic control between Whites and minorities is widening. Whereas mortality rates decreased in patients with diabetes overall, the least mortality reduction was observed among Hispanics and non-Hispanic blacks. The diabetes epidemic among nonwhites patients is mainly due to obesity and physical inactivity. Lifestyle changes are generally effective for both prevention and treatment of diabetes among minorities. Metformin may be particularly effective among African Americans. Metformin and sodiumglucose co-transporter 2 (SGLT2) inhibitors are the most convenient drugs for treatment of diabetes in minorities.
Conclusion: Substantial disparities still exist in the USA with respect to diabetes incidence, glycemic control, and mortality.
Keywords: Ethnicity; Disparities; Diabetes; Obesity; Prevention; Treatment; Lifestyle changes
Introduction
According to the World Health Organization, equity is the absence of avoidable, unfair, or remediable differences among groups of people, whether those groups are defined socially, economically, demographically or by other means of stratification [1]. Therefore, health equity implies that everyone should have a fair opportunity to attain his/her full health, and that no one should be disadvantaged from achieving this potential [1]. Unfortunately, marked ethnic/racial disparities in the USA exist with respect to almost all aspects of diabetes and its care. Thus, minority groups are disproportionately affected in terms of diabetes incidence and prevalence, metabolic control, complications, prevention, and treatment. The causes of these disparities are complex but obesity among minorities play a major role. The main purpose of this article is to provide an update on ethnic/racial disparities in diabetes in the USA and to discuss the most effective ways of diabetes prevention and treatment among minorities. We used the same terminology for the racial/ethnic group (e.g. Hispanics versus Latinos) as it appears in the corresponding reference.
Disparities in Diabetes Prevalence
According to 3 surveys conducted by the National Health and Nutrition Examination Surveys (NHANES) between 2011 and 2016, weighted age and sex-adjusted prevalence of total diabetes i.e. diagnosed and undiagnosed was 12.1% for non-Hispanic white, 20.4% for non-Hispanic black, 22.1% for Hispanic and 19.1% for non-Hispanic Asian adults (overall P<0.001) [2]. The prevalence of undiagnosed diabetes generally followed similar pattern: 3.9% for non-Hispanic white, 5.2% for non-Hispanic black, 7.5% for Hispanic, and 7.5% for non-Hispanic Asian adults (overall P < 0.001) [2]. Marked heterogeneity in diabetes prevalence are present within the same ethnic group (Table 1).
Table 1: Estimated prevalence of diabetes, diagnosed and undiagnosed, in the USA among persons 20 years or older among different ethnic groups [adapted from reference 2].
*Weighted age- and sex-adjusted (95% confidence interval).
** Central America: Costa Rica, Guatemala, Honduras, Nicaragua, Panama, Salvador.
*** South America: Argentina, Chile, Columbia, Ecuador, Paraguay, Peru, Uruguay, Venezuela.
■East Asia: China, Japan, Korea.
●South Asian: India, Pakistan, Sri Lanka, Bangladesh, Nepal, Bhutan.
■●Southeast Asia: Philippines, Vietnam, Cambodia, Thailand, Indonesia, Malaysia, Singapore.
Disparities and Trends in Diabetes Incidence
Following a steady increase in diabetes incidence in adults from 1990 to 2007, it started to decrease from 2008 through the last National Health Interview Survey (NHIS) conducted in 2017 [3]. However, this decrease in incidence was driven primarily by non- Hispanic whites (annual percentage change of -5.1% (P=0.002) followed by Asians (annual percentage change -3.4% (P=0.06), whereas incidence rates among Hispanics and non-Hispanic blacks did not decrease [3]. In fact, the latest age-adjusted data for 2017- 2018 indicated that incidence of diagnosed diabetes in adults were highest in Hispanics (9.7 per 1,000 persons), followed by non- Hispanic blacks (8.2 per 1,000 persons), and Asians (7.4 per 1,000 persons), whereas non-Hispanic whites had the lowest incidence (5.0 per 1,000 persons) [4].
Prevalence of Pre-Diabetes
The most recent National Diabetes Statistics Report showed that 34.5% of all US adults had prediabetes (defined as HbA1c 5.7% to less than 6.5%, or fasting plasma glucose 100 to less than 126 mg/dl, or 2-hr postprandial plasma glucose 140 to less than 200 mg/dl) [4]. The prevalence of prediabetes was stable from 2005-8 to 2013-2016 [4], and not statistically significant between racial/ ethnic groups and various education levels: 31.0 % among Whites, 36.8% among non-Hispanic blacks, 36.1% among Hispanics and 33.0% among Asians [4].
Disparities in Diabetes in Youths
According to the SEARCH for Diabetes in Youth Study, a population-based registry study covering 5 states in the USA, incidence of both type 1 and type 2 diabetes is increasing in youths (defined as persons aged < 20 years) [5]. From 2002 to 2015, the annual relative percent increase was 1.9% and 4.8% in type 1 and type 2 diabetes, respectively [5]. Like the adult population, there were clear ethnic/racial differences in the rate of increase of diabetes in youths [5]. In type 1 diabetes, the steepest increase in incidence was among Asians/Pacific Islanders (4.4% per year), followed by Hispanics (4.0% per year), then Blacks (2.7%/year), and finally Whites 0.7% per year [5]. In type 2 diabetes, similar order was observed. Thus, the fastest increase was among Asians/ Pacific Islanders (7.7% per year), followed by Hispanics (6.5% per year), Blacks (6.0%/year), American Indians (3.7% per year), and finally Whites (0.7% per year). The latter increase among Whites was not statistically significant (95% CI, -1.35 to 2.94) [5]. Reasons of increase in type 1 diabetes are unclear. Meanwhile, the increased incidence in type 2 diabetes is likely due to the increase in obesity in US youths, particularly among minorities [6].
Disparities in Prevalence of Gestational Diabetes
In 2016, the crude (unadjusted) national prevalence of gestational diabetes was 6% [7]. In terms of ethnicity, prevalence of gestational diabetes follows a characteristic pattern. The lowest prevalence exists among non-Hispanic blacks 4.8%, followed by Whites 5.3%, then Hispanics 6.6%, then American Indians/Native Alaskans, and highest in Asians 11.1% [7]. However, despite the fact that prevalence of gestational diabetes is lowest among black women, their risk of developing subsequent type 2 diabetes was the highest compared with other racial/ethnic/groups [8]. For instance, the adjusted hazard ratio of developing diabetes after gestational diabetes was 7.6 and 4.4, among Black and White women, respectively, P=0.028) [8].
Diabetes Prevalence Among African Immigrant Population
The African immigrant (African-born) is one of the fastest growing immigrant groups in the USA [9]. Using data from the NHIS, Alma-Ruth et al [10] reported that age-standardized diabetes prevalence was significantly lower in African immigrants than in African- Americans (US-born), 7% and 10%, respectively (P< 0.01) [9]. Furthermore, African immigrants who had lived in the USA for ≥ 10 years were significantly less likely to have diabetes with a prevalence ratio (PR) of 0.61; 95% CI 0.43-0.79), less likely to have overweight/obesity (PR 0.87; 95% CI 0.77-0.96), hypertension (PR 0.69; 95% 0.61-0.78), and to be physically inactive (PR 0.21, 95% 0.15-0.28) [9]. Hence, African immigrants seem to have a more healthy and distinct metabolic profile compared with African Americans.
Disparities in Glycemic Control
Studies have consistently shown that diabetes control, as reflected by hemoglobin A1c (HbA1c) concentrations, is worse in Blacks and Hispanics compared with White race. In a national cohort of persons older than 65 years enrolled in Medicare Advantage Health plans in 2011, Ayanian et al [11] examined the proportions of patients with HbA1c levels ≤ 9.0%. They found this goal was achieved by 84.0%, 80.6%, and 74.6% among White, Hispanic, and Black enrollees, respectively (P<0.001 for the difference between any 2 groups) [11]. Furthermore, available data suggest that the ethnic/racial gap in HbA1c continues to widen. In fact, analysis of NHANES conducted between 2003 and 2014 showed that HbA1c values tend to worsen among African American and Mexican American patients with type 2 diabetes, whereas corresponding values tend to improve among White patients [12]. It should be emphasized, however, that the difference in HbA1c levels between Black and White persons may be attributed in part to racial factors possibly due to difference in glycation of hemoglobin [13]. Thus, on average, HbA1c levels are 0.4 percentage points (95% CI, 0.2-0.6% percentage points) higher among Blacks compared with White individuals for a given mean blood glucose concentrations [13].
Trends and Disparities in Diabetes Care in the US
Serial analysis of the NHANES data between 2005 and 2016 suggests that diabetes care cascade has not significantly improved during that period [14]. Indeed, only 23-25% of patients met the composite goal of targets of HbA1c (<7-8.5%, depending on age and complications), blood pressure (<140/90 mmHg), low-density lipoprotein cholesterol (<100 mg/dl), and no smoking [14]. These proportions of patients did not change between 2005 and 2016 [14]. Furthermore, there were obvious ethnic disparities in achieving this goal [14]. For example, in 2013-2016, 25% of non-Hispanic white patients attained he previous composite goal, compared with only 14% of non-Hispanic blacks, and 18% of Hispanic patients [14].
Disparities in Diabetes-Related Complications
In general, ethnic/racial minorities have more frequent macrovascular and microvascular diabetes complications compared with Whites [10,15]. The largest available National data showed that in 2010, incidence (cases per 10,000) of end-stage renal disease (ESRD) were more than double in Blacks versus Whites 36.6 versus 16.0 [10]. Corresponding rates for lower-extremity amputation were 40.0 versus 20.4, for stroke 63.1 versus 39.0, and for hyperglycemic death 2.2 versus 1.4. A notable exception was the incidence of acute myocardial infarction, which was lower in Blacks compared with Whites, 32.5 versus 37.5, respectively [10]. No corresponding data regarding the Hispanic patients were reported [10].
Disparities in Diabetes-Related Mortality
Mansour et al [16] reported significant ethnic disparities in mortality rates in patients with diabetes who participated in the NHANES surveys during 1999-2010. Follow-up of this cohort revealed that all-cause and cardiovascular (CV) mortality decreased in all ethnic groups with diabetes. However, the magnitude of reduction in CV mortality significantly differed between various ethnic groups [16]. Thus, Whites experienced the largest reduction in CV mortality from 20.4% down to 14.5%, followed by Non- Hispanic Blacks from 20.6% to 16.3%, whereas Hispanics had only a marginal reduction from 18.4% to 17.5% [16]. Similarly, recent analysis of NHIS conducted from 1997 to 2017 showed a significant decline in CV complications among White patients only, whereas no significant decline was observed among Black or Hispanic patients [17]. Taken together, while mortality rates decreased in patients with diabetes overall, the least mortality reduction was observed among Hispanics and non-Hispanic blacks. This finding is in accord with NHANES data mentioned above showing that diabetes care during 2005-2016 was worst among minorities [14].
Causes of Ethnic/Racial Diabetes Disparities: Role of Obesity
Causes of high prevalence of diabetes in minorities are multi-factorial [18]. The growing obesity epidemic is likely the main driver of diabetes among minorities. In fact, non-Hispanic blacks have the highest prevalence of obesity, whereas Mexican Americans have the highest annual increase in obesity and in waist circumference [6]. Likewise, there is steady increase in obesity in US youths (2-19 years) among non-Hispanic blacks and Mexican Americans, but recent decline among non-Hispanic whites [6]. In 2030, it is predicted that severe obesity defined as body mass index (BMI) ≥ 35 kg/m2 will be highest among non-Hispanic blacks 31.7% (95% CI, 29.9-33.4), followed by Hispanics 24.5% (95% CI, 22.8-26.2), and non-Hispanic whites 23.4% (95% CI 22.1-24.8) [19]. Other causes of diabetes disparities include high-sugar diet, food insecurity [20], physical inactivity, increase insulin resistance independent of adiposity [18], health illiteracy, low education and socio-economic levels [4], lack of health insurance, decrease adherence to medications [21], and communication/language barriers. Genetic factors for diabetes susceptibility contribute similarly to diabetes risk across race/ethnicities [18]. Therefore, genetic differences are unlikely to play a major role in ethnic/racial diabetes disparities
Guidelines for Diagnosis of Diabetes Among Minorities
In subjects pertaining to minority groups, the American Diabetes Association (ADA) recommends screening for diabetes and prediabetes by fasting plasma glucose, HbA1c, or oral glucose tolerance test if they have a BMI ≥ 25 kg/m2 (or ≥ 23 kg/m2 in Asian Americans) [22]. If results are normal, testing should be repeated at a minimum of 3 year-intervals [22]. Patients with prediabetes should be tested yearly [22].
Prevention of Diabetes Among Minority Groups
Lifestyle changes
Since obesity is the main cause of high incidence of type 2 diabetes in general, and among minorities in particular, weight loss strategies including diet and exercise are essential to prevent or at least to delay onset of diabetes. In the landmark trial of Diabetes Prevention Program (DPP) that included 3234 multiethnic individuals at high risk for diabetes, participants were randomized to a lifestyle modification program, metformin 850 mg bid, or placebo [23]. After an average follow-up of 2.8 years, incidence of diabetes was reduced by 58% and 31 % by lifestyle changes and metformin, respectively compared to placebo [23]. It was encouraging that sub-group analysis of the DPP showed that lifestyle intervention tended to be more effective among minority groups with 61-71% reduction in incidence of diabetes compared with 51% reduction among white subjects [24]. Due its success, the DPP approach was implemented in several studies including Hispanics [24] American Indians/Alaska Natives [25], African American [26] and as part of faith-based lifestyle intervention in African American churches [27]. In addition, culturally adapted lifestyle intervention was attempted for prevention of diabetes among Hispanics [28]. In general, the previous studies were met with limited or partial success because of short duration of followup, high attrition rates, and female preponderance [24-28].
Metformin
Although metformin, was inferior to lifestyle changes in prevention of diabetes in the DPP [23], its use in this setting may be considered when lifestyle changes are not feasible or successful. In fact, in the DPP, metformin appears more effective in reduction of new-onset diabetes among minorities than among Whites [23]. Thus, African Americans had 44% reduction, followed by Hispanics 31% reduction, then finally Whites 24% reduction (statistical significance between the 3 groups was not reported) [23]. Moreover, studies showed that metformin is particularly effective with respect to diabetes prevention in women with prior history of gestational diabetes, subjects younger than 60 years, and those with higher baseline fasting glucose (≥ 110mg/dl versus 95- 109mg/dl), or HbA1c (6-6.4% versus < 6.0%) [29]. In addition, the ADA recommends consideration of metformin for patients with prediabetes and BMI ≥ 35kg/m2 [29].
Management of diabetes among minorities
Lifestyle intervention: In ‘The Action for Health in Diabetes (Look Ahead)” trial, 5,145 (36% minorities, 40% men) overweight/ obese subjects with type 2 diabetes were randomized to intensive lifestyle intervention and a control group of diabetes support and education [30]. The objective of the lifestyle intervention is a weight loss of 10% by decreased caloric and fat intake and increased physical activity [30]. After 8 years of intervention, all female patients from different ethnic groups lost weight similarly [30]. Among men, there was a trend toward less weight loss among African American and Hispanic men compared with Whites [30]. A more recent randomized trial conducted in Illinois evaluated culturally tailored diet changes and increase physical activity in low-income African American patients with type 2 diabetes [31]. Compared to standard care group, HbA1c levels were significantly lower at 6 months, but the difference was no longer significant at 12 and18 months [31].
The ADA recommends diabetes self-management education (DSME) in all patients with diabetes. The goal of DSME is to increase the patient’s self-efficacy to manage diet, physical activity, glucose monitoring, and stress management [32]. In one meta-analysis of 20 randomized trials of African Americans and Hispanics, DSME programs resulted in modest but significant HbA1c reduction of 0.31% (95% CI, -0.48 to -0.14%) compared with standard care [33]. However, another meta-analysis of 8 African American studies did not find any significant impact of DSME in improving HbA1c values [34]. Overall, data suggest that long-term lifestyle intervention adopted in the Look Ahead trial is generally effective in all ethnic groups [30]. However, culturally adapted diet and DSME strategies had limited or no benefit in terms of glycemic control.
Drug therapy for treatment of diabetes among minorities
Metformin: Data derived from electronic health records suggest that African-Americans (n=7,429) with type 2 diabetes have better glycemic response to metformin compared with European Americans (n=8,783), reduction in HbA1c levels being 0.9% and 0.4%, respectively (P<0.001 for the interaction between metformin exposure and race) [35]. These results are generally in agreement with those of the DPP showing superior efficacy of metformin in prevention of diabetes among African Americans (44% reduction of new-onset diabetes versus placebo) [23]. In addition, a subgroup analysis from the DPP showed that African American subjects with prediabetes treated with metformin have significantly greater decrease in fasting plasma glucose concentrations versus Whites up to 2 years after intervention [36].
Sodium-Glucose Co-Transporters Type 2 Inhibitors
Sodium-glucose co-transporters 2 (SGLT2) inhibitors are effective, safe, and easy to administer (once a day orally). In addition, they reduce systolic blood pressure and body weight. Furthermore, they significantly decrease CV and renal events in patients with type 2 diabetes and high cardiovascular risk [37,38]. Therefore, these agents are well-suited for treatment of type 2 diabetes in minorities. Unfortunately, ethnic minorities remain underrepresented in the major CV trials of SGLT2 inhibitors [39]. Nevertheless, it is reassuring that the 2 SGLT2 inhibitors empagliflozin and dapagliflozin decreased incidence of CV events in all ethnic groups, including the black patients that constituted approximately 5% of the study populations [37,38]. In a recent randomized trial formed exclusively of African Americans with type 2 diabetes and hypertension, empagliflozin reduced HbA1c levels by 0.78%, mean ambulatory systolic blood pressure by 8.4 mmHg, and body weight by 1.2 kg compared with placebo after 6 months [40].
Glucagon-Like Peptide-1 Receptor Agonists
Like SGLT2 inhibitors, glucagon-like peptide-1 receptor (GLP- 1) agonists decreased weight, systolic blood pressure, and CV events in patients with type 2 diabetes and established CV disease [41]. Main limitations of these agents are the subcutaneous way of administration (once daily or weekly) and high cost. Secondary analysis of phase III trials showed that glycemic efficacy, weight reduction, and safety of the GLP-1 agonist liraglutide are generally similar between African American, Latino/Hispanic, and White patients [42,43]. In the LEADER trial in which Blacks constituted 8.3% of the study population, CV benefits of liraglutide were similar irrespective of the race [41].
Amelioration of Patient-Provider Communication
Patient-provider communication is a critical element in health care provision. In one study, Latino patients who switched from language-discordant to language-concordant primary care physician had significant improvement in their glycemic control [44]. Current efforts aiming at standardization of Medical Spanish in Medical Schools represent a step forward to enhance communication and trust between physicians and Hispanic patients with limited English proficiency [45].
Summary and Current Needs
In the last decade, ethnic/racial disparities in diabetes incidence, prevalence, metabolic control, complications, and mortality continue to worsen. With respect to incidence of type 2 diabetes, the gap between Whites and minorities has widened in both adults and youths [2-5]. The latter observation is largely due to the steady increase in prevalence of obesity among minorities [6]. The DPP showed that weight loss and increased physical activity were effective in preventing diabetes among all racial groups [23]. Therefore, targeting obesity should be an absolute priority to diminish diabetes incidence in general and among minorities in particular. It is the time to take serious actions nationwide to change the pattern of current diet in the US. Specifically, sweetened beverages, refined carbohydrates, red and processed meats should be minimized as far as possible, and replaced by non-sweetened beverages, whole grain, and fibers [46]. Government should provide incentives for production and promotion of affordable healthy food. Any economic or political barriers that interfere with implementation of these diet changes should be removed. Intensive efforts are urgently needed from Federal and local authorities to reduce socioeconomic and educational discrepancies between Whites and disadvantaged minorities. Unfortunately, the recently recorded disproportionate high rates of infection and mortality caused by COVID 19 among African Americans have uncovered the deep and chronic wounds of health inequities that long existed and still persist in this country [47].
https://lupinepublishers.com/diabetes-obesity-journal/fulltext/inequalities-in-diabetes-in-the-usa.ID.000148.php
https://lupinepublishers.com/diabetes-obesity-journal/pdf/ADO.MS.ID.000148.pdf
For more Lupine Publishers Open Access Journals Please visit our website: https://lupinepublishersgroup.com/
For more Archives of Diabetes & Obesity(ADO) Please Click Here: https://lupinepublishers.com/diabetes-obesity-journal/ To Know more Open Access Publishers Click on Lupine Publishers
Follow on Linkedin : https://www.linkedin.com/company/lupinepublishers Follow on Twitter : https://twitter.com/lupine_online
0 notes
Text
Lupine Publishers | Is there Association Between Dislipidemia and Diabetes Type 2 in the Population of Castilla-La Mancha?
Lupine Publishers | Archives of Diabetes & Obesity (ADO)

Summary
Background and objective: The dislipidemia are one of the main factors of risk of cardiovascular illness in patients with diabetes mellitus type 2 (DM2). The aim of this study is to evaluate the prevalence and factors of risk associated to the dislipidemia in the population with DM2 of the Community of Castile-La Mancha.
Material and methods: It are a longitudinal study made in centers of Attention Primaria of the Service of Health of Castilla- La Mancha (n=70). It selected a representative sample of the population with DM2 of 18 to 85 years by means of a procedure polyetapic. They obtained the clinical history and by means of interview the data of the factors of risk to study. It analyzed the association with the dislipidemia by means of linear regression.
Results: 52.1% were men, the half age was of 69-84 years, the evolution of the diabetes of 999 years, 84.3% had HTA, 76.6% sobrepeso/obesigive and the HbA1c half was of 69.6%. The prevalence of dislipidemia was of 85.3% and in the analysis bivariado associated with antecedent of peripheral vascular illness, diabetes controlled, treatment antihypertensive, filtered glomerular, HbA1c>7%, grasto corporal estimated in sobrepeso and obesity, antecedent of cardiovascular illness, age and HbA1c. In the univariant analysis the independent factors were the feminine sex and the antecedent of cardiovascular illness.
Conclusion: The prevalence of dislipidemia in our study was of 85.3%. The factors of risk associated of independent form were the feminine sex and the personal antecedent of cardiovascular illness.
Keywords: Dislipidemia; Diabetes mellitus Type 2; Prevalence; Factors of risk
Introduction
The diabetes mellitus type 2 (DM2) is an illness that has purchased a character pandemic because of the increase of the hope of life, that supposes an increase of the aging of the population, to the increase of the obesity and to the change in the lifestyles to some habits no cardiosaludables (sedentarism and bad feeding) [1].
The prevalence of DM2, according to the study diabetes, emplaza in 13.79% of the Spanish population elder of age. According to data of the Organization Mundial of the Health (2016), in Spain the DM finds between the causes of death more frequent. The proportional mortality that attributes to this illness is of 3% of the total of deaths for all the groups etarios. The DM comports notable costs socioeconomics. Crespo Et al. They signaled that, in 2013, the annual cost of the DM was of 5. 890 million euros: 8.2% of the sanitary cost total [2].
In the patients with diabetes, the complications microvascular are the main cause of morbimortalidad to level mundial. Near of 3/4 parts die by cardiac illness or cerebrovascular. Likewise, the frequency of deaths by cardiovascular reasons in adult’s diabetes in comparison with the no diabetes is of 2 to 4 greater times [3]. The importance of the quilomicrones for the reduction of the cardiovascular risk in the DM2 has been showed in different studies and metanalysis [4]. The association between dislipidemia and cardiovascular illness (ECV) remained showed in the “United Kingdom Prospective Diabetes Study (UKPDS 23)”, where observed that an increase of 38.5 mg/dl in the concentration of quilomicrones associates to an increase of 15.7% to present coronary arterial illness and that an increase of 4 mg/dl of the cHDL associates to a descent of 15% of events cardiovascular [3]; like this then , the factor of risk of greater weight to develop coronary illness were the quilomicrones, followed of the levels of cHDL. It is necessary to diagnose and treat temperamental the dislipidemia of effective form for like this reduce the risk of cardiovascular events futures [1].
In Spain, diverse studies epidemiological have analyzed the prevalence of the alterations lipidic, that oscillate between 56.2% in the one of Domínguez and 92.6% in the study OBEDIA8; however, it is scarce the information on the prevalence and the factors associated to the dislipidemia in patients with DM2 in Castile-La Mancha [5].
The present study has like aims:
a. Estimate the prevalence of the dislipidemia.
b. Investigate the factors of risk associated to the dislipidemia and
c. Investigate the factors of risk associated of independent form to the dislipidemia.
Material and Methods
Longitudinal study of populational base on a sample of 70 patients with DM2, between November of the 2019 and February of the 2020. It made a procedure polyetapic by means of the employment of a sample of the conglomerates of some centers of health. Of the 60 centers of health registered in the Service of Castile-La Mancha of Health, selected 30. The greater part of this in the province of Albacete (where selected 20), in Cuenca selected 4, in Ciudad Real 3 and in Toledo other 3. Later there was a second selection of a submaster of the contingents of patients of the doctors of each center of health elegido. If any of the centers of health rejected to participate in the study, was replaced by another inside the same stratum.
Of each included patient in the study collected information of the following variables: age, sex, year of diagnostic of DM2, habitat, level of education, familiar economic level, labor situation, habit tobacco, weight, size, perimeter abdominal waist, corporal fat estimated, index of corporal mass (IMC), arterial systolic pressure, arterial diastolic pressure, abdominal obesity, antecedents of ECV, arterial hypertension (HTA), antihypertensive treatment, dislipidemia, hypolipidemia treatment, renal insufficiency and retinopathy.
Besides, they collected the analytical parameters of quotient albumin/creatinine, filtered glomerular (FG), hemoglobin glycosylate (HbA1c), plasmatic glycemia, total cholesterol (CT), cLDL, cHDL, triglycerides (TG) and creatinine. For the register of the periarterial ion made 2 measurements of arterial pressure systolic and diastolic in 2 successive visits and with monitor of validated arterial pressure. For the analysis, the average of the two measurements is used.
For the analysis of data used the program statistician SPSS V23.0.0.0. The qualitative variables expressed like absolute value and percentage, with the estimate of the interval of confidence to 90% (IC 90%). The quantitative variables expressed like half ± typical deviation and IC 90%. For the relation of the quantitative and qualitative variables between himself employed an analysis bivariado with t of Student. It made the analysis multivariate of binary linear regression no conditional with the dislipidemia like dependent variable, having in unit the variables that in the analysis bivariado associated with the presence of the dislipidemia or were clinically notable, that were the following: age, sex, HTA, personal antecedent of peripheral vascular illness, diabetes controlled, antidiabetic treatment, HbA1c≥7%, quotient albumin/creatinine, FG, personal antecedent of ECV, years of evolution of DM, glycemia basal, creatinine and retinopathy. All the statistical analyses were of 1 tail and considered estimated signification a value of < p 0.05.
Results
Of the 70 patients, 68.9% were 65 years old or more, with average of age of 69-84 years and average of years of evolution of the diabetes of 999 years. 68.2% of the participants were of urban habitat, 50% had primary studies, 74% were jubilates and 75% had annual income <18.000 D. There was a light predominance of men (52.1%) and the women were of greater age (70.8 years). The tabaquismo active and the obesity according to the IMC was significantly greater in men; the abdominal obesity was significant and greater in women. The prevalence of dislipidemia was of 85.3%; the one of HTA, of 84.3%; renal insufficiency, of 22.9%; sedentarism, of 48.2%; logo albuminuria and proteinuria, 31.3%; sobrepeso and obesity according to IMC, of 76.6%; obesity according to the corporal fat estimated by means of CUN-BAE, of 93%; abdominal obesity, of 67.6% and the retinopathy was of 29.3%. The prevalence of dislipidemia was similar in women and men (87.7% in women in front of 83.1% in men; p = 0.085). Of the subjects dilapidations, 79.5% were dilapidations for receiving hypolipidemic treatment and 20.5%, dilapidations that did not receive hypolipidemic treatment and that presented values of cLDL>160mg/dl, cHDL < 40mg/dl in men or <50mg/dl in women, or TG≥150mg/dl. The 75.3% received hypolipidemic treatment; 71.1%, statins; 5.4%, ezetimibe; 3.3%, fibrates; 0.8%, resins of ionic exchange and 0.5%, esters etarios of sour grass omega 3. 69.6% received treatment in monotherapy and 5.7% in bitherapy. In the subject’s dilapidations for receiving hypolipidemic treatment, 96.5% received statins or ezetimibe; 4.3%, fibrates and 2%, statins and fibrates. In the subjects with diagnostic of dislipidemia and without hypolipidemic treatment, the 14.3% had the cLDL > 160mg/dl; 79%, cHDL < 40mg/ dl in men or <50mg/dl in women and 51.3% had TG>150mg/dl. The average of glycemia plasmatic basal was of 137.85 ± 46.59mg/ dl, of CT 178.17±38.18mg/dl, of cHDL. 47.09±12.10mg/dl, of cLDL 108,10±36.44mg/dl, of TG 136.6±66.3mg/dl and of creatinine 0.96±0.55mg/dl.
68.7% of the patients had normoalbuminuric; 23.8%, logo albuminuria and 7.5%, self-evident proteinuria. 77.1% of the patients had a tax of filtered glomerular (MDRD) TFGe>60ml/ min/1.73m2 and 22.9%, renal insufficiency (TFGe<60ml/ min/1.73m2). Of the patients with renal insufficiency, 19.1% had TFGe of 30-59 ml/min/1.73m2; 2.9%, of 15-29ml/min/1.73m2 and 0.9%, <15ml/min/1.73m2. The average of leukemia plasmatic basal, TG and creatinine was significantly greater in men and, the average of CT, cHDL and cLDL was significantly greater in the women. To his time, the logo albuminuria and proteinuria was significantly more prevalent in the men. They obtained the parameters lipidic complete of 70 patients that had registered one or more parameters. Of them, 26.6% did not reach the aims of CT (<200mg/ dl) neither 54.9% the ones of cLDL (<100mg/dl). They documented TG high (≥150mg/dl) in 33.7% and cHDL low (<40mg/dl in men and <50mg/dl in women) in 46%. With regard to the alterations combined, cLDL out of aims and cHDL low detected in 23.7%; cLDL out of aims, cHDL low or TG elevated in 14% and cLDL and CT future of aims, cHDL low or TG elevated in 6.6%. In the analysis bivariado, the variables associated to the presence of dislipidemia are: antecedent of peripheral vascular illness, diabetes controlled, pharmacological treatment for HTA, HbA1c ≥ 7%, FG, corporal fat estimated in sobrepeso and obesity, personal antecedent of ECV, age and HbA1c (Table 1). The antecedent of peripheral vascular illness is included in the variable antecedent of ECV.
Clinical diagnostic of dislipidemia*
*Dislipidemia: In treatment of hypolipidemia or those that do not follow treatment hypolipidemia and present figures of cLDL > 160 mg/dl; cHDL < 40 mg/dl in men and <50 mg/dl in women or TG > 150 mg/dl. cHDL: Cholesterol joined to lipoproteins of high density; cLDL: cholesterol joined to lipoproteins of low density; CT: total cholesterol; DM: diabetes mellitus; HbA1c: hemoglobin glycosylate; IC: interval of confidence; OR: odds ratio; TG: triglycerides.
We have not found significant differences in the presence of dislipidemia with the following variables: sex, familiar economic level, level of education, labor situation, habitat, habit tobacco, HTA, HTA controlled, pharmacological treatment DM, quotient albumin/ creatinine, IMC, obesity abdominal, retinopathy diabetic, years of evolution, glycemia basal neither creatinine. In spite of have not found significant differences, objectives that the subjects with dislipidemia had greater time of evolution of his DM, greater levels of glycemia basal and creatinine and greater values of IMC. To his time, the feminine sex, the black race, the familiar economic level “annual incomes < 18.000 D”, the low level of education (without studies and primary studies), the labor situation “retired” and the urban habitat were more prevalent in the subjects dyslipidemias. Likewise, the habit tobacco (smoker and exfumador), the HTA, the oligoalbuminuria, the proteinuria and the retinopathy diabetic were more prevalent in dislipidemic patients that in no dislipidemic. He also objectified that the prevalence of the dislipidemia was elder to measure that increased the oligoalbuminuria and the degree of retinopathy diabetic, as well as, when the TFGe diminished.
The model contains the following variables: sex (woman vs. man), personal antecedents of ECV (ictus, cardiopathy ischemic and peripheral arteriopathy), HbA1c>7% and age (continuous, by every year of more).
B: Coefficient of regression; ECV: cardiovascular illness; EE: standard error of B; H: men; HbA1c: glycosylated hemoglobin; IC: interval of confidence; M: women; OR: odds ratio.
In the analysis multivariable, identify that the variables that associate of independent form with the dislipidemia are the feminine sex and the personal antecedent of ECV (Table 2).
Discussion
The results indicate that the prevalence of dislipidemia in patients with DM2 of Castile-La Mancha is elevated and that less than 15% of the patients show the lipidic values normal or recommended by the main guides of clinical practice. Said findings of prevalence are consistent with the found in other works so much in Spain as in the international field. When we compare these results with different publications, observe that it exists a big variability. In the majority of the studies the prevalence of dislipidemia finds above 50%, with a rank that oscillates between 56.2% in the one of Dominguez and 92.6% in the study OBEDIA. On the other hand, the variability found in the prevalence of dislipidemia can be due to the heterogeneity in the form to diagnose it and to that is in relation with the different criteria diagnostics. In this context, the greater prevalence observed in the study OBEDIA could be in relation with the point of court of the cLDL considered in the definition of dislipidemia, that is lower that the used in the present study. These discrepancies are something usual in the medical bibliography, since the methodologies used to the hour to carry out the studies (is possible that other studies use distinct criteria diagnostics, methods of laboratory or different points of cut to determine the diverse factors lipidemic and his cardiovascular risk), as well as the populational diversity, affect to the results ends of the studies. Also it is important emphasize that the studies from populational samples can have the inconvenient that, in spite of his randomness in the selection of the subjects, the sample do not represent the population of reference or that this find very delimited in the space and the time and, therefore, was not comparable with other studies. This prevalence so high could be related with the profile of the patients studied (high taxes of obesity, sick age, bad metabolic control of the diabetes, etc.), since in the sample studied 69% were greater of 65 years. These analytical values do not depend of the register made by the professionals and are a faithful reflection of the reality. Although in multiple studies epidemiological longitudinal has analyzed the prevalency of dislipidemia in populations diabetics with distinct levels of cardiovascular risk, east is the first study in Spain that analyses the characteristics, prevalence and factors associated to the dislipidemia of a representative sample of patients with DM2 of Castile-La Mancha. Besides, the previous studies to the moment to value the prevalence of dislipidemia center usually in the isolated alteration of the CT or cLDL according to the recommendations of the NCEP ATP III, without a complete analysis of the lipid profile and without taking into account to patients in treatment lipid lowering.
In the subjects with diagnostic of dislipidemia and without treatment lipid lowering we objectify that the low values of cHDL is the alteration lipidic more frequent (79%). Of the same way, observe a considerable increase of the levels of TG (51.3%) beside a discreet increase of the values of cLDL (14.3%). These results are concordant with the quantitative alterations described in the dislipidemia in the patient with DM “dislipidemia atherogenic”. The dislipidemia atherogenic is a characteristic element of the vascular residual risk of origin lipidic no associated to changes in the neither of them of cLDL and is a dislipidemia very prevalent in the people with DM2, in the patients with high risk or very high risk, with visceral obesity or metabolic syndrome.
In the sample studied observes that a high proportion of patients do not reach the aims of cLDL. Also, objectives that an important proportion of cases has TG high and cHDL low, which saves concordance with the described in the bibliography, where finds elevation of the TG and decrease of the cHDL in approximate mind the half of the patients with DM2. These data signal an important residual risk (levels of cLDL, cHDL and TG suboptimal) that probably have to be controlled with more intensity of what does in the daily clinical practice and that perhaps was in relation with the inertia and therapeutic fulfillment; in patients with DM2, the percentage of breach therapeutic is very high, and is of the 32, 36 and 38% for the lipid lowering, antidiabetics and antihypertensives. If we examine the fulfillment of objectives according to the recommendations of the guides of clinical practice, objectives that the 2/3 parts of the subjects have suitable levels of TG (67.2%) and less than the half do not reach the optimum levels of cLDL (45.1%) and cHDL (46%).
If we compare these results with the obtained in a transversal study made in the 17 autonomous communities of Spain, observe that the subjects studied attain more frequently the aims lipidics recommended. In patients with DM2 and dislipidemia the approach global therapeutic has to consider, in addition to cLDL, the control of the levels of cHDL and of TG like secondary therapeutic aims, what can involve a change in our therapeutic attitude to achieve such aims. The main contribution of this work is the knowledge of the high prevalence of dislipidemia (85.3%) in patients with DM2 of the Community of Castile-La Mancha and that the factors associated of independent form to the dislipidemia were the feminine sex and the antecedent of ECV. This knowledge is the first stair to implant the necessary means that make possible to improve the group of the profile lipidic, and, therefore, would have to be useful to establish strategies of continuous improvement that involve to all the agents involves (medical personnel, personnel of infirmary and sanitary authorities) in the implementation of the clinical guides and in improving the adherence of the patients. Our results indicate that frequently it exists more than an alteration of the values of plasmatic lipids. Like this, 23.7% showed conjoint alterations of cLDL and cHDL; 14.7%, of cLDL, cHDL and TG and, 6.6%, of the 4 parameters. On the other hand, the CT, cHDL and cLDL were significantly greater in women and the TG were significantly Minimal in men; these findings are similar to the described in a study made in Catalonia. In the Or.K. Prospective Diabetes Study 27, observed that the CT, cHDL and the cLDL were significantly greater in women, what saves relation with encountered in our study.
By means of the analysis multivariable, identify that the feminine sex and the personal antecedent of ECV associate of independent way with the dislipidemia, above the age and of the HbA1c. The prevalence of dislipidemia sand associated with the feminine sex, what was consistent with other studies [4]. Regarding the association between sex and dislipidemia, in the current investigation the feminine sex was the most affected by dislipidemia, although 52.1% of the participants were of masculine sex. The association of both categorical variables by means of the analysis multivariant allowed to estimate that belong to the feminine sex in this group of patients increased in almost 3 times the relative risk to present dislipidemia. The lipid profile altered is a characteristic of the DM and confers greater risk to present ECV, especially EAC. The relative risk of coronary cardiac illness fatal associated with the DM is 50% higher in the women that in the men. The caused the greater risk of coronary cardiopathy in women with DM still does not know completely. However, the changes induced by the DM2 in some factors of cardiovascular risk, like the cLDL, cHDL, TG and the PA, have found more pronounced in the women that in the men, and this can explain the greater increase in the risk of arteriosclerosis in women diabetics. Besides, the differences between the sexes in the lipid profile could exert a paper in the most negative impact that has gave diabetes on the cardiovascular risk in the women in comparison with the men. Likewise, it has posited that the increase of the prevalence of the dislipidemia in the women of age advanced can be related with the hormonal changes in the pre- and post-menopausal. The prevalence of dislipidemia associated with the personal antecedent of ECV [6]. In the current investigation, the antecedent of ECV was significantly more prevalent in the masculine sex (39.5%) and almost 4 of each 10 of patients with dislipidemia had the antecedent of ECV (35.8%). The association of both categorical variables by means of the analysis multivariant allowed to estimate that have the personal antecedent of ECV in this group of patients increased in 3.5 times the risk to present says lipidemia [7]. In this sense, is important to emphasize that the hypercholesterolemia is a factor of risk very prevalent in patients with ECV and confers special risk to suffer it, especially ischemic cardiopathy. Likewise, the high levels of CT and cLDL are between the most important factors of risk of ECV, the cHDL low and the TG high are independent factors of risk of ECV and the treatment with statins has a beneficial effect in the incidence of the ECV atherosclerotic [8]. Our studies presents diverse limitations and fortresses. Between the main limitations find the inherent to the type of study (longitudinal) and of analysis of the information; in this sense has to recognize the presence of the bias of survival, the impossibility to generalize the results to populations with different characteristics to the described; to his time, is necessary to make studies perspectives that can confirm these results and analyze with greater precision the variables associated tool to prevalence of dislipidemia.
Of the present study fits to stand out the sampling in which it is based, that is a representative sample of Castile-La Mancha, as well as the fact that it have been objective by several observers, what does it more damtativo in the recollection of data. In comparison of our results with the studies published to national and international level allows us to see the consistency of the data. Besides, other variables could be predictors valid of dislipidemia. Our study did not take into account the possible modifications of the therapy lipid lowering and the therapeutic fulfillment of the patients. Finally, the longitudinal design is very used, since his cost is relative inferior body to the of other epidemiological designs, like the transversal studies, and provide notable information and of fast form for the management of the services of health. Because of the importance of the object of analysis that occupies us, believe necessary emphasize the importance to follow investigating in this line.
Conclusion
This investigation shows that in the patients with DM2 of Castile- La Mancha there is a high prevalence of dislipidemia. The factors of risk associated of form independent were the feminine sex and the personal antecedent of ECV. In sight of these results, exists the need of a handle integral and intensive of the dislipidemia, for which has to try improve the metabolic control of the diabetes, decrease the obesity and promote changes in the lifestyles (cessation of the habit tobacco, physical exercise and decrease of the consumption of saturated fats and of alcohol), with the end to diminish the ECV and to improve the quality of individual and collective life of the population.
https://lupinepublishers.com/diabetes-obesity-journal/fulltext/is-there-association-between-dislipidemia-and-diabetes-type-2-in-the-population-of-castilla-la-mancha.ID.000147.php
https://lupinepublishers.com/diabetes-obesity-journal/pdf/ADO.MS.ID.000147.pdf
For more Lupine Publishers Open Access Journals Please visit our website: https://lupinepublishersgroup.com/
For more Archives of Diabetes & Obesity(ADO) Please Click
Here: https://lupinepublishers.com/diabetes-obesity-journal/
To Know more Open Access Publishers Click on Lupine Publishers
Follow on Linkedin : https://www.linkedin.com/company/lupinepublishers
Follow on Twitter : https://twitter.com/lupine_online
0 notes
Text
Lupine Publishers| Comparative Wound Healing Effects of Honey, Olive Oil, Pawpaw Fruit Extract and Iodine in Diabetic Rats: an Evaluation and Prioritization of Potential Alternative Therapeutic Options
Lupine Publishers| Journal of Diabetes and Obesity
Abstract
High cost of conventional diabetic wound management is of public interest due to their social and economic burden on the individuals and care givers. This experimentally-controlled designed study compared the wound healing potentials of natural products: Honey, Olive oil, Pawpaw fruit (unripe mesocarp) extract (PFE) and Iodine (positive control) in diabetic rats. Twenty-eight male Wistar rats categorized into four groups (n = 7, each) weighing between 150 - 200g were used for this study which lasted four weeks. A full thickness excision wound of circular area 300 mm2 and 2 mm in-depth was inflicted on all rats after light anesthesia with i.v. ketamine (90mg/kg b.w.). Aliquot portions of Olive oil, Honey, Iodine and PFE were topically applied to the opened wounds twice a day. Wound areas were measured on days 1, 7, 14, 21 and 28 using a transparent sheet and a permanent marker. Wound healing activity was assessed using percentage area of wound contraction, epithelization period and granulation tissue integrity. Data were analyzed using Microsoft Excel and SPSS v. 22. Comparison between groups was made using one way ANOVA. P values < 0.05 were considered significant. Significant wound contraction occurred on 14th day of treatment in all groups: Iodine (99.4%), Olive oil (98.4%), Honey (92.4%) and PFE (90.2%) with different remarkable epithelization periods (days): Iodine (14), Olive oil (15), Honey (16) and Pawpaw extract (17). Granulation tissue integrity improved respectively in the order of PFE, Honey, Olive oil and Iodine. The results of this study revealed that honey, olive oil and PFE as natural products have varying beneficial effects on wound healing process in diabetic rats.
Keywords: Natural Products; Wound Healing; Diabetic Rats; Alternative Therapeutic Options
Introduction
Wound healing is an intricate and dynamic process of replacing devitalized and missing cellular structures and tissue layers following injury [1,2]. This complex process involves phases of hemostasis, inflammation, proliferation and remodeling [3]. Though, the exact pathogenesis of poor and delayed wound healing in diabetics is not clearly understood, evidences from human and animal studies however, have revealed several abnormalities in the various phases of wound healing process. Individuals with diabetes demonstrate reduced capability in acute wound healing associated with susceptibility to chronic diabetic foot ulcer development, a serious complication reported to affect 15% of people with diabetes and accounts for 85% of all diabetes-related lower leg amputations [4]. This impaired healing abilities of diabetics result from multiple pathophysiological mechanisms involving hypoxia, fibroblast and epidermal cell dysfunction, impaired angiogenesis and neovascularization, high levels of metalloproteases, damage from reactive oxygen species and AGEs (advanced glycation endproducts), decreased host immune resistance and neuropathy [5]. Delayed wound healing and chronic wound management in diabetics is of public interest due to their social and economic burden on the individuals and care givers. To abate such burden, a paradigm shift to beneficial alternative therapy which is affordable, accessible, available and competitively effective compared to conventional wound management, is recently attracting focus. This study therefore, compared the wound healing effects of iodine, honey, olive oil and pawpaw fruit extract (locally available, accessible and affordable in our environment) in experimental diabetic rats with rationale to evaluate and prioritize their therapeutic potentials as alternative remedies in wound healing.
Methodology
The unadulterated original Honey, Olive oil, Iodine and Pawpaw (unripe) used in this study were identified and purchased at a local market in western part of Nigeria with the assistance of an agriculturist and a chemist. The pawpaw (Carica papaya) fruit extract was prepared by washing and properly cleaning the fruit with distilled water while the outer green thin layer (exocarp) was peeled and discarded to expose the underlying mesocarp which was cut and weighed. 200g of the peeled mesocarp was blend with 50 ml of distilled water to a fine texture form using a laboratory blender. The mixture obtained was filtered using a fine muslin cloth to produce a residue that was oven dried at 40°C to a white colored powdery form. The residue was weighed and stored in waterproof container.
Twenty-eight (28) male albino Wistar rats (Rattus norvegicus) weighing about 150 - 200g used for this study were obtained from the disease-free stock of Olu farm, Ibadan, Oyo State, Nigeria. The animals were kept in polypropylene cages with stainless wire mesh top in a well-ventilated animal house maintained at normal and standard laboratory conditions of temperature and relative humidity with access to standard rat pellets and water ad libitum for the entire experimental period. Animal Ethical Committee of the institution approved the study protocol. After 15 hour overnight fast following acclimatization, all rats were injected by single intraperitoneal injection of 150 mg/kg body weight of freshly prepared 2% Alloxan monohydrate (Sigma chemicals, USA) dissolved in sterile 0.9% normal saline in a standard volumetric flask strapped with foil to prevent alloxan instability. Diabetes was confirmed 4-7 days later by use of commercial glucometer (On Call Plus Blood Glucose Monitoring System, ACON Laboratories, Inc. San Diego, USA.) and compatible strips. Rats with Fasting Blood Glucose (FBG) level > 150 mg/dl were considered diabetic and used for this study since the level of serum glucose considered to be normal in Rattus norvegicus ranges from 50 - 135 mg/dL [6]. Diabetes was allowed to stabilize for 5 days before animal grouping and wound infliction. Fasting blood glucose levels of all rats in each experimental group were measured on weekly basis for the four week study period. After diabetes induction, the animals were categorized into four groups of seven rats each. Thereafter, the rats were inflicted with excision wounds treated according to the experimental design as shown below:
Group A: Diabetic rats with wounds treated with Iodine (Positive control)
Group B: Diabetic rats with wounds treated with Honey
Group C: Diabetic rats with wounds treated with Olive oil
Group D: Diabetic rats with wounds treated with Pawpaw fruit extract
A modified method of Anyakudo and Erinfolami [7] was used to excise wound in the rats. Animals were anaesthetized with 0.48 ml of intravenous ketamine hydrochloride (90 mg/kg body weight) and shaved on the dorsolateral side of the thoracic region using scissors. The area of the wound to be created was outlined on the shaved part of the animals with a blue ink marker while a full thickness excision wound of circular area 300 mm2 and 2 mm in depth was created along the markings after disinfected with 70% ethanol. Animals were allowed to stabilize for 24hrs from the surgery. Thereafter, the treatment (test) materials were topically applied to the wounds without covering with any wool or plaster. Animals were carefully observed and cages kept clean to prevent infection. The treatment materials were applied topically twice a day. Wound areas were measured on days 1, 7, 14, 21 and 28 using a transparent sheet and a permanent marker. Wound healing activity was assessed using percentage area of wound contraction, epithelization period and granulation tissue integrity. Data were analyzed using Microsoft excel and SPSS v. 22. Results were expressed as mean ± SEM. Comparison between groups was made using one-way ANOVA while P values < 0.05 were considered significant.
Results
The profile of wound healing contraction and epithelization in various groups is shown in Table 1 and 2 below. On 14th day of the study, a comparable significant (p < 0.05) increase in the area of wound contraction was observed within all groups: Iodine (99.4%), Olive oil (98.4%), Honey (92.4%) and Pawpaw extract (90.2%) while on the 28th day, all wounds were observed to be completely healed. Difference in areas of wound contraction when compared across groups was also significant. Attainable period (expressed in days) for observed remarkable epithelization during wound healing differs with treatment option: Iodine (14), Olive oil (15), Honey (16) and Pawpaw extract - PFE (17). These results reflected their differential healing rate potentials. Also, well-organized granulation tissues were formed during the healing process in all groups. However, granulation tissue integrity was remarkably highest in iodine-treated group followed by olive oil, honey and PFE respectively. Plate A shows the typical representation of all grouped diabetic rats on Day 1 after wound infliction while Plate B1- 4 and C1- 4 depict the wound healing processes of PFE and honey respectively on Days 7, 14, 21 and 28. The honey and pawpaw fruit extract pictures were chosen for display here because they are readily available and accessible to a common individual in our environment. The iodine in this study serves as a positive control (Figure 1).
Figure 1:
Discussion
This experimentally controlled designed study which lasted four weeks compared the wound healing activities of Honey, Pawpaw fruit extract, Olive oil and Iodine in grouped experimental diabetic rats. In this study, the different treatment options comparatively investigated caused significant different effects on area of wound contraction, degree of epithelization and granulation tissue formation used to assess their potentiality and benefit in wound healing. Wound healing activities was remarkably highest in iodinetreated group (positive control) followed by olive oil, honey and PFE respectively (Tables 1,2). The observed therapeutic effect of pawpaw fruit extract in this study on wound healing in diabetic rats correlates with the finding of previous study [7] which proved the alternative benefit of aqueous mesocarp extract of pawpaw fruit in wound treatment in healthy and diabetic individuals. Topical use of Carica papaya fruit in chronic ulcers treatment was considered to be more effective than other topical applications according to Hewitt et al [8]. However, in this study, Olive oil and Honey showed better improvement on wound healing process over that of papaya. Different parts (fruit, leaf, stem, latex, root) of this tropical tree called Carica papaya Linn (family: Caricacaea) with over 1000 species worldwide have long been reported and recently reviewed to be useful as herbal medicines or concoctions in the management of various disorders including diabetes and wound infection [9, 10]. Carica papaya various parts are variably rich in Vitamin A and C and other several biochemical compounds that may explain the mechanism of its beneficial impact on wound healing process [11]. Pawpaw is a common fruit in various human habitats especially in the tropic and subtropic areas. Therefore, planting of pawpaw should be encouraged because of its various health benefits including wound treatment.
Table 1: Wound healing activities of treatment materials in grouped diabetic rats (n = 5/group).
Values are expressed in mean ± SEM
Table 2: Period of observed remarkable epithelization in grouped diabetic rats (n = 5/group).
Values are expressed in mean ± SEM
The use of honey as a nutraceutical has become of increasing interest in the recent years largely due to an increase in the availability of evidence-based findings demonstrating the health beneficial effects of honey in treating diverse disease conditions including diabetes mellitus. In this study, honey showed a remarkable wound healing activities better than PFE but less effective compared to olive oil based on the criteria used for assessing wound activities in this study. Previous studies [12,13] carried on human subjects with diabetic foot ulcers revealed that use of honey remarkably improved wound healing process and reduce associated pain and cost of healthcare. These findings are similar to that observed in this study using animal model. The healing properties of honey based on various research studies can be attributed to its antimicrobial and anti-inflammatory effects, wound bed moisturizing, osmotic effects, decreasing edema in the cells of the wound, accelerating the process of angiogenesis and granulation in the wound, accelerating collagenases and epithelialization in the wound, increasing activities of lymphocytes and phagocytes and accelerating debridement of necrotic tissue [14,15]. Based on the above evidences, use of honey as a treatment option in wound healing should be given high consideration especially in diabetic wounds for expected maximum outcome. However, precautions should be taken to avoid the use of adulterated honey sold in the market which can complicate wound healing process.
Olive oil and Iodine demonstrated excellent wound healing effects in this study as revealed by their shorter periods of epithelization, faster rate of healing process and very high percentage area of wound contractions compared with honey and PFE. Application of oil in wound treatment has long been reckoned with human existence. Though, different types of oil exist in nature, preference for olive oil by man for various uses including spiritual have been established. In our environment, olive oil is almost found in every home with poor knowledge of its use in wound management. This study therefore proved the efficacy of olive oil in the treatment of wounds with beneficial outcome as also agreed by findings of other studies [16,17] which revealed the remarkable wound healing effect of olive oil in the management of diabetic foot ulcers. Therefore, olive oil use in diabetic wound treatment should be highly encouraged and considered. Though the mechanism of wound healing effect of olive oil is inexplicit, It appears that it achieves its wound healing effect through mechanisms that stimulate cell healing and acceleration of wound healing process possibly by its constituent essential fatty acids such as linoleic acid and linolenic acid and improve granulation tissue formation by its antioxidant, antimicrobial, and anti-inflammatory properties [18]. Iodine use in the treatment of wound has long gained recognition in various homes and schools and can be seen as an orthodox or conventional therapeutic remedy for acute wound management. However, Iodine is inaccessible to most people in our environment especially those in the rural areas. Therefore, use of alternative remedies such as honey, pawpaw fruit extract and olive oil in open wounds treatment should be encouraged in place of expensive and inaccessible conventional therapies.
In future, it is hoped that the study on the effect of the combination of the above natural products may be considered to assess their synergistic or complementary effects in wound healing. Meanwhile, with the above findings, use of Olive oil, Honey and mesocarp extract of unripe pawpaw should be recommended for wound healing and be considered as alternative therapeutic options in place of expensive conventional options.
Conclusion
Diabetic wound healing has been reported generally slow if inappropriately cared for; and in the face of financial constraint as common with conventional management, this might last for weeks or even months with possibility of risk of amputation. To minimize these financial burden and associated risks based on the findings of this study, use of honey, olive oil and pawpaw fruit extract which are readily available, accessible and affordable as alternative therapeutic options should be given consideration and prioritization in our environments as recommendation for wounds care especially in diabetics.
For more Lupine Publishers Open Access Journals Please visit our website:
http://lupinepublishers.us/
For more Open Access Journal on diabetes and Obesity articles Please Click Here:
https://lupinepublishers.com/diabetes-obesity-journal/
#Diabetes#diabetes care#Type-2 Diabetes#diabetes journals#Diabetes and Obesity Journals#obesity#Journal of Diabetes and Obesity#metabolism#Lupinepublishers#Lupine publishers#Lupine Publishers Group
0 notes
Text
Lupine Publishers| New Year Wishes
Lupine Publishers| Journal of Diabetes

Wave goodbye to the old and embrace the new with hope, dreams, and ambition. Wishing you a Happy New Year full of happiness!
#Diabetes#diabetes care#Type-2 Diabetes#diabetes journals#Diabetes and Obesity Journals#obesity#Journal of Diabetes and Obesity#obese#extremely obese#Lupinepublishers#Lupine publishers#Lupine Publishers Group#newyear#new year 2021
0 notes