
Last Seen Blogs

2kyears
maurice toussant

yossieyossie-blog
YOSSIE ♥ YOSSIE

astrophileous
astrophile
hedgemont
Tumblr life

sincere85
Untitled
Text
Week 10 - The Home Stretch
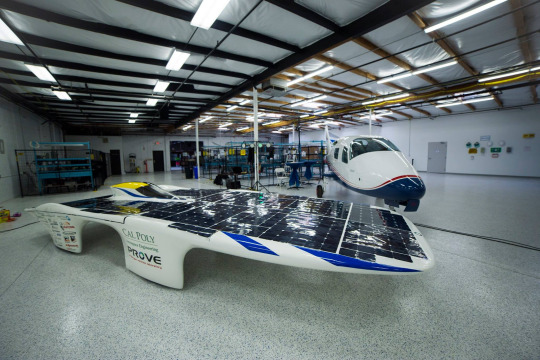
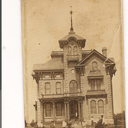
Figure 1: This photo is of Dawn, PROVE’s solar car, and the X-57 ,which is one of NASA’s new x-planes and is being built by ES Aero.

Figure 2: This is a stock photo of the same car that my group used for preliminary, stand in testing.
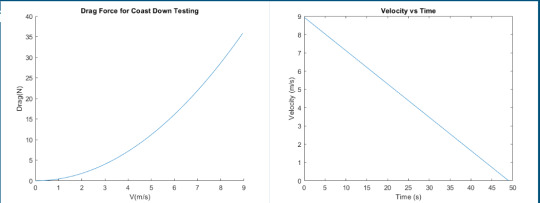
Figure 3: These graphs are of the data gathered during the stand in testing.
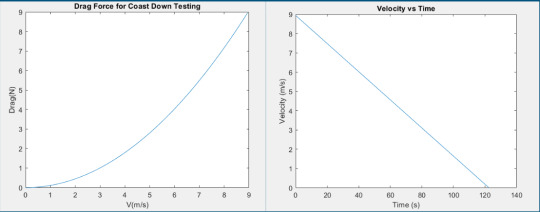
Figure 4: These graphs represent what we would expect once the solar car is up and running.
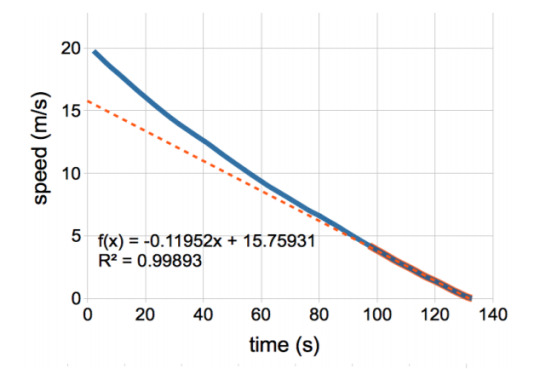
Figure 5: This graphs was taken from the report for Sunswift IVy, UNSW.
Week 10 we had class on Monday, June 4th, and Wednesday, June 6th. On Monday my group and I analyzed some sample data that was provided to us by the team from PROVE, we fleshed out our test plan so that someone who did not know what was going on could pick up the test plan and conduct the test, and we worked on our presentation to be delivered in class on Wednesday.
Personally I worked on putting the presentation together, which included inserting restructured sections from the test plan to illustrate our testing procedure and making sure the layout and format of the slides was consistent. I also helped aid one of groupmates in the analysis of the sample data we were provided by PROVE.
This week there was no testing because the kinks with the solar car are still being worked out therefore it could not be taken out to the EFR or Santa Margarita Ranch. In place of the data that would have been gathered from the solar car being tested my group requested from the solar car team and received a sample data file that is the same output file type and also has the data organized in the order in which our code is able to read it in and analyze it. The analysis of the sample data went well because we were able to replicate the graphs that we produced from the data collected when we tested one of my groupmate’s cars, as well as the graph included in the report for Sunswift IVy which is the fourth solar car from the University of New South Wales.
There are no plans for the week ahead as the regular part of the quarter is done and because we had our culminating experience for this class on Wednesday when we gave our presentations on the mini-projects that we were assigned to.
Something aerodynamically interesting that I witnessed this week is when I was in my car and driving at speed and only had one window down I heard a thumping noise, similar to that of a helicopters blades. When I lowered another window the thumping noise was minimized.
Something about aerodynamics that I feel I understand more about is that attached flow is preferred because once flow detaches it causes an increase in drag. I was able to increase my understanding of this topic during the NACA 4412 “infinite” wing section and NACA 4412 finite wing span labs.
Something that still confuses me about aerodynamics is why a wing stalls and why the reattachment angle of attack is lower than the detachment angle of attack. I am still confused about this topic because we ran tests to find the stall angle of a wing and what its reattachment angle is, but we did not really go into the theory as to why this occurs.
My 307 highlight was being able to be a part of the group that developed the procedures to experimentally characterize the drag of Dawn, PROVE’s solar car.
My 307 lowlight was not being able to go out and actually conduct the necessary tests with Dawn in order to characterize her drag, due to complications that were outside the control of myself and my groupmates.
My future in aerospace engineering includes taking AERO 406, which is Dr. Doig’s applied Computational Fluid Dynamics class, during the first week session of Summer Quarter 2018. I am also signed up to take ME 542, which is Dynamics and Thermodynamics of Compressible Flow with Dr. Westphal, during Fall Quarter 2018.
3 notes
·
View notes
Text
Week 9 Post
Week 9 we had no lab on Monday, May 28th, because of Memorial Day, but we still had class on Wednesday, May 30th. On Wednesday my lab group for lab 4 wrote code to output a graph of velocity vs. drag force as well as the coefficient of rolling resistance. We then gathered experimental data by conducting coast down testing in one of my groupmate’s cars. We set up on a straight road then he accelerated to a predetermined speed and then shifted into neutral. Another of my groupmates recorded deceleration on his phone for each speed and I input the speed into our MATLAB code to see what the predicted Crr would be. After the coast down testing we tufted the rear left fairing of the solar car so that we could conduct flow visualization via tufts.
My roles for this week were helping troubleshoot the code as well as inputting and running MATLAB in real time while the coast down testing was being conducted. I also helped to cut and attach the tufts.
This week’s testing went about as well as the circumstances allowed. Since we were not able to conduct testing with the solar car during the week we had to go with the next best option which was testing with one of my groupmate’s cars so that we could have experimental data to input into our code to see if it actually worked with real data. Something that I found intriguing was the second order relationship between velocity and drag force
My group and I still hope conduct some type of testing with the solar car during the upcoming week or weekend so that we can have results to present during Wednesday of week 10.
Something aerodynamically cool I saw this week was Dr. Doig trying to use the fog machine to produce enough smoke so that a car could drive through the cloud, but the wind was dispersing the smoke so this was not viable. This also caused a couple of IME professors to come out of their labs to see if anything was on fire.
1 note
·
View note
Text
Week 8
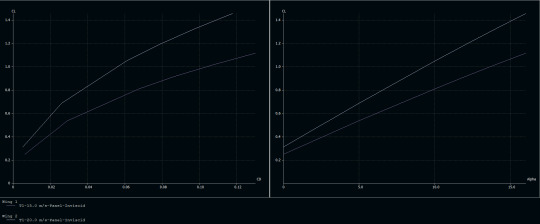
Figure 1: These plots were produced from the simulations run in XFLR5.
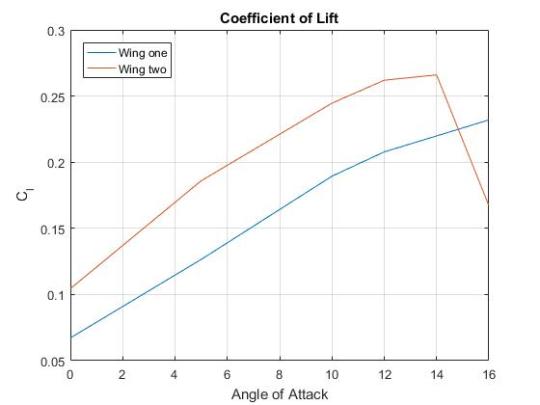
Figure 2: This plot was produced in MATLAB from the experimental data of the two wings.
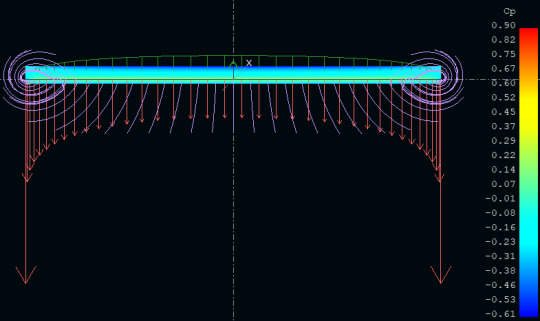
Figure 3: This surface plot is of Wing 1 at an AoA of 0 deg.
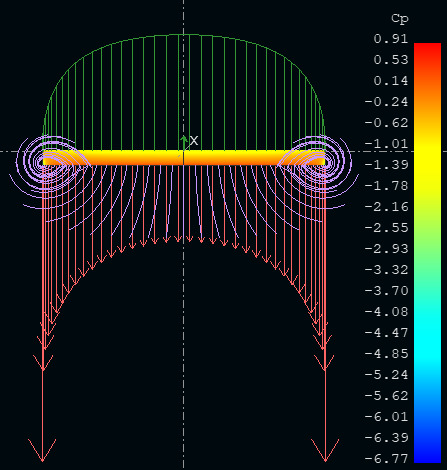
Figure 4: This surface plot is of Wing 2 at an AoA of 16 deg.
Week 7 my group for lab 3, force balance, continued work on our technical report on Monday the 21st. Since we had collected data during week 7 we were able to process and analyze the data and then compare it to the simulations run in XFLR5.
Personally this week I worked to finish outputting the rest of the XFLR plots and graphs for both wings at AoAs of 0, 5, 10, 12, 14, and 16 degrees. Once all the graphs were outputted from XFLR I was able to compare them to the graphs produced in MATLAB with the data collected from the wind tunnel runs. Something interesting that I noted when comparing the Cl vs. alpha graphs from XFLR to MATLAB is that the starting Cl for both wings is higher because I assumed inviscid when running simulations in XFLR because I found out through trial and error that XFLR does not cooperate when viscous flow is assumed for the simulation.
This week no testing was conducted for either my group for lab 3 or my group for lab 4 since testing for lab 3 concluded last week and the opportunity to test for lab 4 has not arisen yet. Analysis wise though, this week could be considered successful because I was able to get XFLR to output graphs and surface plots for both the high and low aspect ratio wings because previously I was having trouble with XFLR crashing whenever I tried to start a new simulation, beyond a couple of test case runs based off the data provided by the TAs.
For the coming week, week 9, my group’s goal is to have everything prepped in case my group for lab 4, mini projects, is able to go testing with PROVE. As we have not been able to test yet with PROVE given that they are taking care of issues that are outside of our control, we want to be ready with the material and clear instructions necessary to run the test because we may have a time conflict with the time slot when PROVE wants to go testing. As a result they may have to set up and run our tests without us there. Like I said in my post for week 7, I’m still eager to be in person at a testing day for the solar car because it would be cool to see in person the source of the data that is being analyzed by my group.
Something aerodynamically cool that I “saw” this week was the pressure wave that forms on the front of a car as it travels at high velocities. I experienced this phenomenon as I was sitting in my car at a standstill when a car went past me at a close distance and high velocity. My car moved slightly due to the compression of air around the front of the car and as a result the pressure wave that was shed off the other car was strong enough to move my car a noticeable amount.
1 note
·
View note
Text
Week 7 - Force Balance and Mini Project
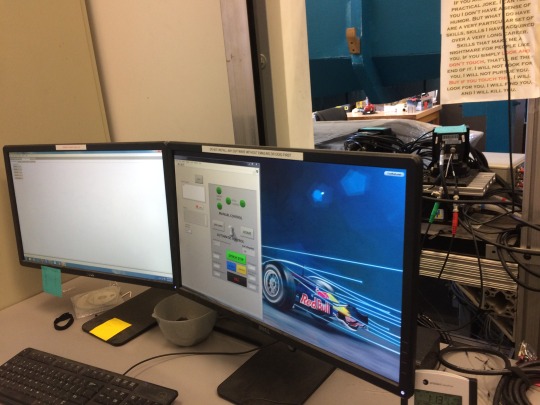
Figure 1: This photo is of the LabView VI used to control the angle of attack of the force balance.
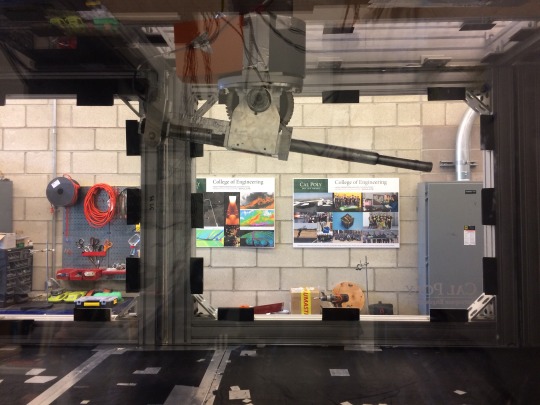
Figure 2: This photo shows the force balance without a wing section attached.

Figure 3: This photo shows the force balance with a wing section attached.
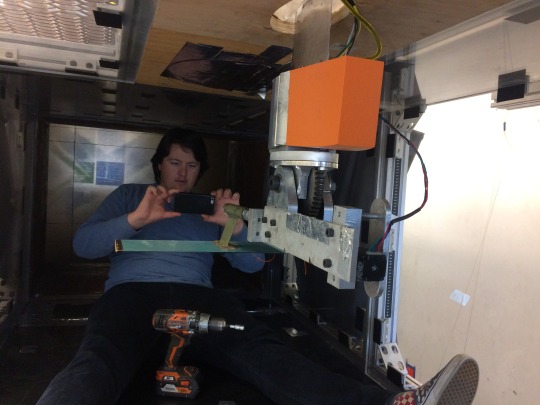
Figure 4: This photo is of one of my group mates, Alec, after he mounted the second wing section with the impact drill.
Week 7 my group for lab 3, force balance, tested two NACA 4412 wing sections of different aspect ratios on Monday the 14th. Right before we started to test we decided to narrow down our test matrix by one angle of attack so that we could complete all of our testing within the allotted time. We also ran at one velocity, therefore one Reynolds number, for each wing section instead of two so that we could finish in time. On Wednesday the 16th my group for lab 4, mini projects, drew up our test plan to help PROVE Lab calculate the force of drag, with experimental data, of the solar car. We set a stretch goal of putting tufts on specific parts of the solar car to visualize any zones of recirculating air and also to see if the air flow around a specific section was laminar, transitioning, or turbulent.
My roles for the force balance lab included mounting a wing section onto the force balance, changing the angle of attack of the force balance/ wing section via a LabView VI, and changing the RPM of the wind tunnel. To mount the wing section I used a cordless impact drill to tighten a bolt that went through the arm that was attached to the wing section and that went into the arm of the force balance. Changing the angle of attack is done by inputting the difference in current angle of attack versus the desired angle of attack of the force balance/ wing section; something to note is that the wing section is mounted upside down which means that when you want to sweep through positive angles of attack you input negative angles of attack into the LabView VI and vice versa. Increasing or decreasing the RPM is done via the control panel on the left hand side of the control room; the reason why my group decided to not use the same RPM for both wing sections is because we wanted to match the Reynolds numbers of the two wing sections which meant that we had to have the freestream flow be at a different velocity since their characteristic length differed. My roles this week for the mini project lab included reading through a report on the solar car Sunswift IV, that was built by the University of New South Wales, to research their methods of calculating the force of drag and to help put together our test plan. Reading through the report on Sunswift IV my group found out that in order to calculate the coefficient of rolling resistance for the tires of the solar car we needed to run the car at speeds around 11 mph or less so that we could assume that aerodynamic drag has a negligible effect on the power consumption. With some algebraic manipulation of the power equation in their report they arrived at an equation for C_d A, aerodynamic drag area, of 2m(a-C_rr g)/(ρϑ^2 ). All the rest of the values were either then calculated from the data collected during the test run below 11 mph, like the rate of deceleration, or measured, like the density of the ambient air.
This week’s testing could be considered a success because my group for lab 3 was able to collect data at all of the points we specified in our test matrix with time to spare, but we decided to not add back the additional angle of attack and Reynolds number for each wing section because we were satisfied with the data that we had already collected and because we did not want to potentially cut short the additional testing since we did not have much time left over. What I found interesting for lab 4 is that the coefficient of rolling resistance for a tire is dependent not only on the condition/ type of surface the tire is rolling on, but also the pressure inside the tire and the velocity of the solar car.
For this week my goal for lab 3 is to have the technical memo completed before the long weekend so that my group does not have to stress about it over the weekend. For lab 4 my goal is to have a successful day of testing on Sunday the 20th, which is contingent on the solar car being ready for testing, so that we could collect good data in order for us to accurately calculate the force of drag. I’m looking forward to testing with the solar car team because it would be cool to say that I helped to calculate the force of drag for the world’s fastest solar car.
A connection that I made between lab work and my other studies is that it doesn’t matter which fluid an object is moving through, be it air or water, a smoother surface finish on the object will correlate to a reduction in drag. I saw an example of the concept of drag reduction due to a smoother surface finish at UCSD, specifically their human powered submarine. I visited UCSD this weekend, as a member of Cal Poly’s human powered submarine project so that we could learn from the team at UCSD. What we learned from the team at UCSD is that when they did the lay up for their composite hull and then pulled vacuum the hull developed deformations. As a result they had to do a lot of body work to ensure an even surface across the entirety of the hull. They also painted their submarine to give it a smoother finish.
1 note
·
View note
Text
Week 6
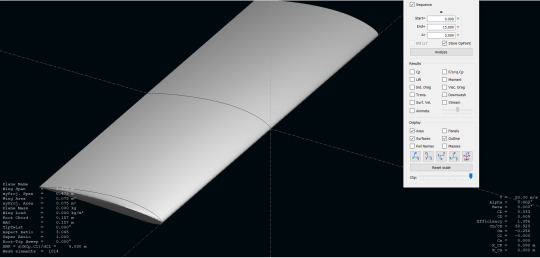
Figure 1: This screen capture shows one of my simulation runs in XFLR5.
Week 6 my team and I finished and delivered our presentation for lab 2 on Monday the 7th and then my new group for lab 3, on Wednesday the 9th, started writing code and running simulations for lab 3 FORCE BALANCE. Our presentation for lab 2 went well as we were able to succinctly deliver the analysis that was conducted on the data from the flow visualization of Arash’s, Ryan’s, and Tej’s quadcopters.
My roles for this week included presenting the test plan, test goals, and mounting set up for the flow visualization lab. Additionally I ran simulations in XFLR5 for the FORCE BALANCE lab. Even though my group has not run the FORCE BALANCE lab yet I was able to run test cases based on the test matrix that was run by the TA’s. I had issues with trying to run the simulations with the assumption that the flow is viscous so instead I assumed inviscid in order to get results. This coming week I will be working out the kinks in my simulations so that I can select viscous as my assumption so that the results from the simulations will be closer to reality than if inviscid was assumed.
This week’s analysis had mixed results because I was able to produce numbers from XFLR5, but was unable to produce the final results that I wanted. As a result I need clarification on how to get my simulations to run when I select viscous flow. My teams for lab 2 and for lab 3 both worked well this week; for lab 2 my team gave a good presentation and my group for lab 3 was productive because they developed and ran MATLAB code to analyze and create plots from the sample data that was uploaded by the TA’s. Something that I found cool was the visualization of the data on the wing section in XFLR5.
My goal for the week ahead is to make sure that my simulations in XFLR5 work for viscous assumptions so that I can compare the results to what my group gets experimentally. I am looking forward to running the FORCE BALANCE lab because I want to use the new force balance since the one we used in 302 was not the best.
Something cool that I saw this week that relates to aerodynamics is the waves at MDO. The waves at the shores of MDO were white, thus the water was turbulent.
1 note
·
View note
Text
Week 5 - Flow Viz cont.
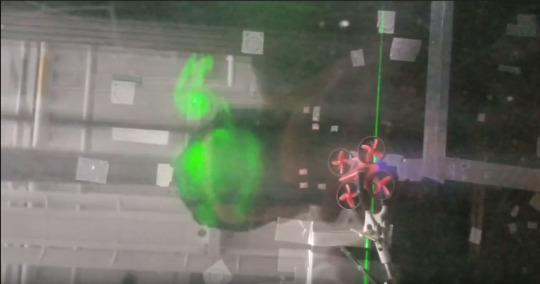
Figure 1: This photo shows Ryan’s drone at a high alpha with smoke and laser.
Week 5 my team and I started work on our presentation for lab two, Flow Viz Challenge Part 2. In addition to working on the presentation for lab two we conducted a third day of testing. The third day of testing consisted of positioning Ryan’s drone at a high alpha, versus the drones being in SLF (Steady Level Flight) for the first two days of testing, and visualizing the flow with smoke and the green line laser. Our reasoning behind orienting Ryan’s drone at a high alpha with the smoke and laser is that we saw cool flow patterns with the tuft grid during the second day of testing and wanted to replicate said flow patterns with the smoke and laser combination.
My roles for this week included controlling/ adjusting the green line laser so that it intersected the stream of smoke at the cross section of the drone we wanted to visualize flow at, controlling/ adjusting the flood lamp so that it illuminated the smoke around the drone while allowing for photos to be taken with minimal glare, and adjusting the smoke so that it flowed over the region of the drone where we wanted to visualize flow.
Testing this week was middle of the road. As a team we did not realize that we shouldn’t run the fog machine for more than 15 min. at a time so we ended up having smoke flow that wasn’t consistent for part of the testing, as a result of the fog machine starting to overheat. Additionally, we had the same problem with the green line laser. We unplugged it when we took a 30 min. break to let the fog machine cool and when we came back to start testing again we discovered that the laser would not turn back on. The team believes that the laser may have also overheated, as we had it running for the duration of our testing before we gave the fog machine a break. Something that we got clarification on was how to calculate Reynolds number for a quadcopter, since it is a different method than if you were to calculate the Reynolds number for a wing.
Our plan for this week is to give a stellar presentation on Monday about lab two. I am looking forward to lab three and being able to use the new force balance assembly, which will hopefully give more accurate and consistent data than the force balance assembly from AERO 302 with the old load cell.
Some cool flow viz that I saw this week was the interaction of cars with the dense fog on the way to see the launch of the Mars InSight mission.
1 note
·
View note
Text
Week 4 - Flow Viz

Figure 1: This photo shows the tuft grid being constructed.

Figure 2: This photo shows the tuft grid being tested to see what is an appropriate length of tuft.

Figure 3: This photo shows flow visualization using a green line laser with smoke.

Figure 4: This photo shows flow visualization using a flood lamp with smoke.

Figure 5: This photo shows flow visualization using tufts.
Week 4 my team and I finished the technical memo for the first lab, NACA 4412 wing section, and also conducted two test sessions for lab two, Flow Viz Challenge Part 2. Before the tests were conducted we constructed a frame from 2’x4’s in order to mount a tuft grid in the wind tunnel. The tuft grid is being used as another method of flow visualization, in conjunction with smoke with a green line laser, and smoke with a flood lamp. For the tuft grid we had to take into account that we were running a test matrix with three different sized drones so we made sure that the tufts made a fine enough grid so that we could accurately capture the flow features of the smallest drone. Another consideration that was made was that because we wanted to use the line laser and flood lamp we decided to run our first test session at night so that we could get clear video and photos of the flow features around the drones; we decided as a team that the second test session could be run during the day because the tuft grid does not require low light to maximize its potential.
My roles this week included controlling the line laser and flood lights while smoke was going through the test section, positioning the stream of smoke so that it flowed over the drones, taking photos and video of the flow features, and controlling the speed of the wind tunnel. I also helped to run through the safety checklist that all groups must use when starting up the wind tunnel.
Testing this week went according to plan since we were able to record data (video of the flow visualization) of all three flow visualization techniques for all three drones. It took a couple of tries to get the correct speed for the smoke to flow properly over the drones. For the smoke we were looking for flow that was not dispersed before the drones so that we could decipher the effect that the drones had on the flow. Something that I found cool was that the flow pattern behind the drones changed depending on what maneuver the drone was commanded to do. Our team members were assigned specific roles so we were able to communicate well which led to us being able to complete our test matrix in the time allotted.
Our plan for the week ahead is to compile and analyze the data that was collected so that we can put together the presentation that we will be giving to the entire section. We are also interested in running a third test session because we would like to gather data at test points that we thought of after we ran for the second time. As a team we’re looking forward to presenting the data collected because we want to show that aerodynamics matter for all flying vehicles, even if they’re a toy.
Something cool “related” to aerodynamics that I saw this week was a group testing model animals in the water tunnel. We were able to see the stagnation point at the nose of the animals and the vortex patterns that formed off the back of them.
3 notes
·
View notes
Text
Week 3
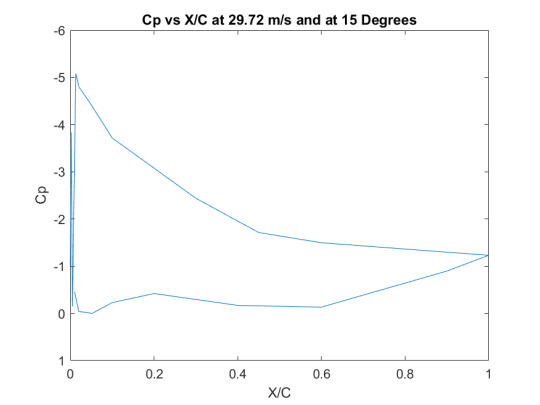
Figure 1: This Cp plot is an example of the analysis that was completed for the tech memo.
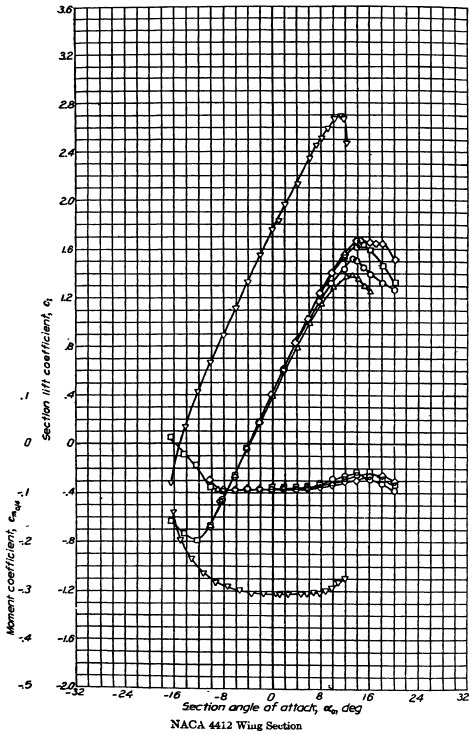
Figure 2: This plot is the one that is being digitized.
Week 3 my team and I continued work on the technical memo for the first lab, NACA 4412 wing section, and then also planned out our test for lab two, Flow Viz Challenge Part 2.
I personally helped to write the error analysis section of the technical memo along with inputting the equations used for analysis of the data collected from the wind tunnel runs. I am also currently in the process of digitizing a plot from TOWS in order to compare our simulation and empirical data to a trusted source. For lab two our test plan was drawn up, shown to and approved by Kyle. My group decided on analyzing the aerodynamic characteristics of quadrotors.
My group was productive because we fully fleshed out what we wanted to conduct our flow viz on and what techniques of flow viz we are going to utilize.
Our plan is to build a tuft grid tomorrow and then to test Monday evening.
Something cool that I saw this week was the visualization of turbulence on the pond out by the EFR. You could see where the water was still and where the wind met the water you could clearly see the propagation of a disturbance along the surface of the water, also known as a wave.
1 note
·
View note
Text
Traverse Arm Installation

Figure 1: This photo shows the traverse arm, which has the pitot probe mounted onto the end of it.
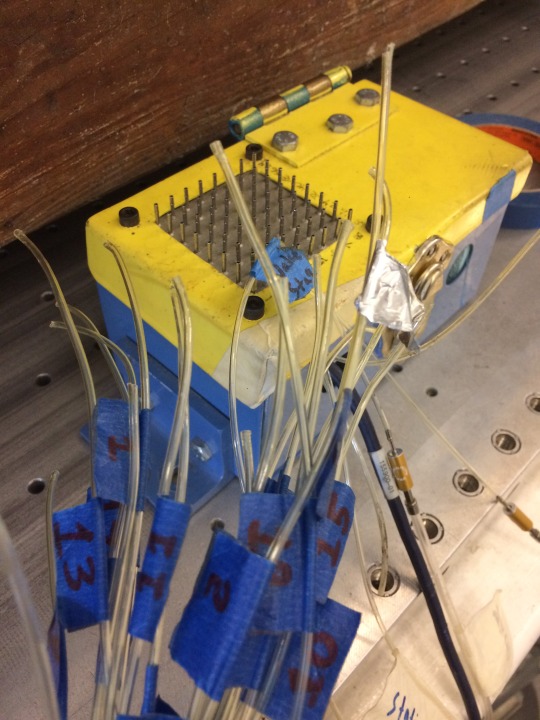
Figure 2: This photo is of the Scanivalve box and the pressure tap tubes before installation.
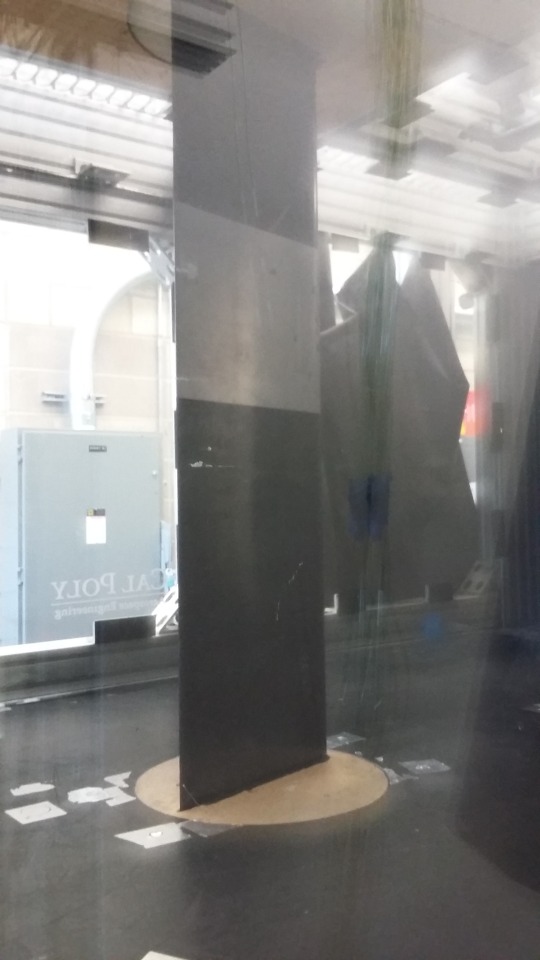
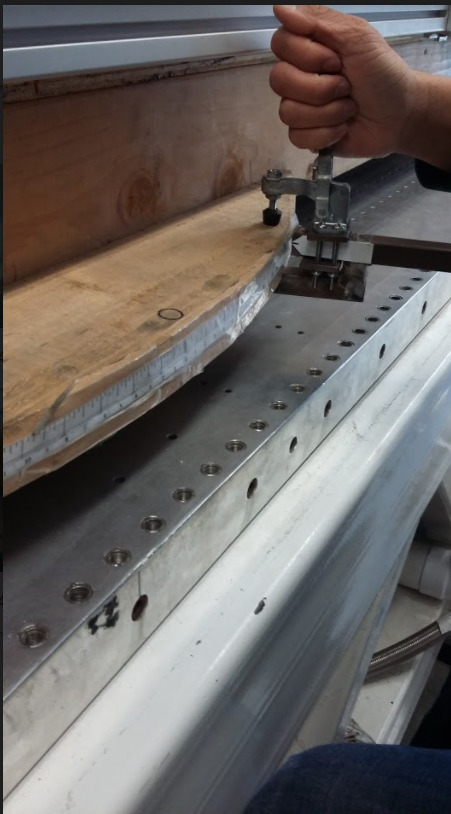
Figure 3: This photo is of the NACA 4412 wing section after installation.
This week I helped to re-install the traverse arm, re-mount the pitot probe, setup the Scanivalve box, and place the NACA 4412 wing section into the wind tunnel. The reason behind the need to re-install the traverse arm is that it was taken out of the wind tunnel for a new fairing to be designed for it and also for a group of students to complete a test in the wind tunnel that required the traverse to be removed.
I personally helped to design the new fairing for the traverse arm, along with Tej Modi and input from Dr. Doig. Additionally, I helped to mount the traverse arm back onto the plate with connects it to the step motors that move it. Also I helped to put the pressure tap tubing back onto the Scanivalve box so that pressure data could be collected from the wing section and the wind tunnel itself.
What I learned from this experience of re-installing the traverse arm is that it is good practice to have a manual about how to complete a non-standard procedure so that in the event that the person(s) who know what to do are not available, someone else can step in and complete the task at hand. Something that will be cool is to see the difference in the flow quality in the test section once the new traverse arm fairing is installed.
A goal for the week ahead is to make sure that the traverse arm fairing is done being 3D printed so that we can complete integration of it with the traverse arm by the end of next weekend. I’m looking forward to seeing how the traverse arm fairing performs, but at the same time I’m not looking forward to the problems that may arise during the integration, installation, and testing of the new fairing design.
2 notes
·
View notes
Text
Week 2 - NACA 4412 Wake Measurements

The above picture shows the traverse arm that has the pitot probe mounted on it.
Week 2 the team ran the Cal Poly Low Speed Wind Tunnel once again. This lab section the time allotted to the team was used to take pressure measurements of the wake of the NACA 4412 “infinite span” wing. The pressure measurements that were collected during this round of testing will be used to calculate viscous drag, which will then factor into the calculation for total drag.
My roles included changing the AoA of the wing along with deciding which increments the traverse arm would move, thus positioning the pitot probe where the team believed the wake started and ended.
This week’s testing went according to our test matrix. The team was able to collect data at the Reynolds number we wanted and the AOAs that we wanted as well. Some that I found interesting was that the pressure on the top surface of the wing saw a drop in pressure, which translates to less lift and therefore drag. A constant pressure across the top surface of the wing at the stall AoA translates to flow separating from the wing. What the team needed clarification on was how viscous drag can be calculated from the pressure data. Our team has a good dynamic because every team member knows their roll so we are able to work our way through a test matrix without confusion and miscommunication.
The team plans to analyze the data from the prior two weeks of testing so that we can fully describe and report back, via a technical memo, what the results of our test goals 1 and 2 plus the wake measurements were. We’re looking forward to moving onto the next lab which is flow viz part 2.
Something aerodynamically cool that I heard about was that NASA has awarded its low-boom x-plane contract to Lockheed Martin. This x-plane is meant to demonstrate that it is possible to have a supersonic transport that is relatively quiet, thus allowing it to go supersonic over land.
1 note
·
View note
Text
Week 1 - NACA 4412 Infinite Span Wing
Week 1 the team ran the Cal Poly Low Speed Wind Tunnel to test for the positive stall angle of attack, zero lift angle of attack, and the reattachment angle of attack of a NACA 4412 "infinite span" wing.
My roles consisted of running Xfoil code to generate Cp plots of the airfoil and adjusting the angle of attack of the wing section in the wind tunnel.
This week's testing showed that it is important to have a well thought out test matrix and test plan to ensure that the goals of the test campaign are realized.
Goals for the week ahead are to analyze the data collected from the week 1 test and then to prep for wake refinement testing. The team is looking forward to continued testing of the NACA 4412 wing section.
Something aerodynamically interesting that I saw was the solar car from PROVE.
The picture above depicts a member of the team changing the AoA of the wing.
4 notes
·
View notes