
Last Seen Blogs

meinnameistviictoria-blog
istviictoria

unaexpresionpoetica
JAMIE MIRELLE

rtbangla
Untitled

k414lt
Fork

1happyflower-blog
NCT trash
Text
Daily Market Analysis with Trading Signals
This is our daily updated market analysis of the development of investments such as stock indices, currencies and commodities. The charts show our trading signals and indicators on a weekly and daily basis.
USE ONLY FOR EDUCATION OR TRADING SIMULATION, NOT FOR REAL TRADING.
Charts updated: 24.03.2021
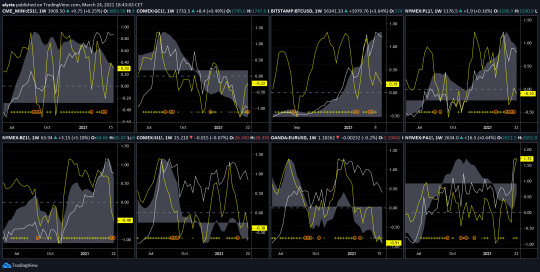
Weekly Charts with Trading Signals of S&P E-mini Futures ES1!, Brent Financial Futures BZ1!, Gold Futures GC1!, Silver Futures SI1!, Bitcoin in US Dollar BTCUSD, Euro in US Dollar EURUSD, Platinum Futures PL1! and Palladium Futures PA1!.
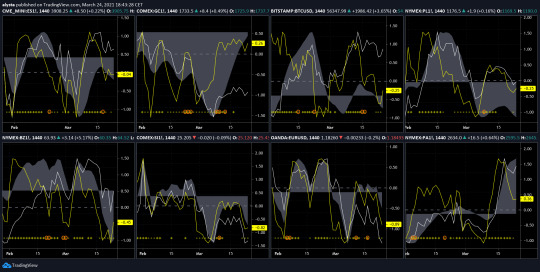
Daily Charts with Trading Signals of S&P E-mini Futures ES1!, Brent Financial Futures BZ1!, Gold Futures GC1!, Silver Futures SI1!, Bitcoin in US Dollar BTCUSD, Euro in US Dollar EURUSD, Platinum Futures PL1! and Palladium Futures PA1!.
How to read the charts
The graphs above show charts of S&P 500 Futures, Brent Crude Oil Futures, Gold Futures, Silver Futures, Bitcoin in US Dollar BTCUSD, Euro in US Dollar EURUSD, Platinum Futures and Palladium Futures. The white line shows the price of these assets. The gray area is a multi-timeframe MACD (Moving Average Convergence/Divergence) indicator. A positive or rising value usually indicates a main long trend with upmoving prices, a negative or falling value usually indicates a main short trend with downmoving asset prices. The yellow line is our trading algorithm that calculates several indicators against each other. A value above the horizontal line or a rising usually means rising asset prices, a value below the horizontal line or a falling usually indicates falling asset prices. The symbols at the bottom summarizes the results of the analysis of our algorithm and show our trading signals.
USE ONLY FOR EDUCATION OR TRADING SIMULATION, NOT FOR REAL TRADING.
Our latest analysis results for free (delayed)
Last update time shown on the first row of the table. REVlong means the main direction is downward, but it just comes to a temporary reversal in the opposite direction. REVshort means the main direction is upward, but it just comes to a temporary reversal in the opposite direction. It is always to be expected that the price moves back into the actual main trend direction.
Market Forecast Archive:
Chart Archive:

Weekly Chart 2021-03-23. The results may differ from the current chart due to a development of our analysis indicators.

Daily Chart 2021-03-23. The results may differ from the current chart due to a development of our analysis indicators.
Here we document our analytic results.
analysta market forecast archive.
Hong Kong Stock Exchange HKEX is a trademark of it's specific owner.
Dow Jones DJCFD is a trademark of it's specific owner.
Chicago Board of Trade CBOT is a trademark of it's specific owner.
New York Stock Exchange NYSE ARCA & MKT is a trademark of it's specific owner.
OANDA Corp. is a trademark of it's specific owner.
NASDAQ is a trademark of it's specific owner.
STOXX Limited is a trademark of it's specific owner.
European Exchange EUREX is a trademark of it's specific owner.
Chicago Mercantile Exchange CME is a trademark of it's specific owner.
New York Commodities Exchange COMEX is a trademark of it's specific owner.
Chicago Board Options Exchange CBOE is a trademark of it's specific owner.
New York Mercantile Exchange NYMEX is a trademark of it's specific owner.
WISDOMTREE is a trademark of it's specific owner.
London Stock Exchange LSE is a trademark of it's specific owner.
Intercontinental Exchange ICE is a trademark of it's specific owner.
Standard and Poor's S&P is a trademark of it's specific owner.
FXCM is a trademark of it's specific owner.
No advice on investment is given here
Disclaimer: All opinions, charts, messages, news, research, analysis, pricing, or other information available on this site are for general education and training purposes only. analysta is not responsible for any loss or damage, including without limitation, any loss of profit that may arise, directly or indirectly, from the reliance on such information. Please be fully informed regarding the risks and costs associated with trading the financial markets, it is one of the riskiest investment forms possible. Please note: Trading and investing is associated with a significant risk and may lead to a total loss of the capital invested or even an obligation to make additional payments.
Read the full article
0 notes
Text
Daily Market Analysis with Trading Signals
This is our daily updated market analysis of the development of investments such as stock indices, currencies and commodities. The charts show our trading signals and indicators on a weekly and daily basis.
USE ONLY FOR EDUCATION OR TRADING SIMULATION, NOT FOR REAL TRADING.
Charts updated: 23.03.2021

Weekly Charts with Trading Signals of S&P E-mini Futures ES1!, Brent Financial Futures BZ1!, Gold Futures GC1!, Silver Futures SI1!, Bitcoin in US Dollar BTCUSD, Euro in US Dollar EURUSD, Platinum Futures PL1! and Palladium Futures PA1!.

Daily Charts with Trading Signals of S&P E-mini Futures ES1!, Brent Financial Futures BZ1!, Gold Futures GC1!, Silver Futures SI1!, Bitcoin in US Dollar BTCUSD, Euro in US Dollar EURUSD, Platinum Futures PL1! and Palladium Futures PA1!.
How to read the charts
The graphs above show charts of S&P 500 Futures, Brent Crude Oil Futures, Gold Futures, Silver Futures, Bitcoin in US Dollar BTCUSD, Euro in US Dollar EURUSD, Platinum Futures and Palladium Futures. The white line shows the price of these assets. The gray area is a multi-timeframe MACD (Moving Average Convergence/Divergence) indicator. A positive or rising value usually indicates a main long trend with upmoving prices, a negative or falling value usually indicates a main short trend with downmoving asset prices. The yellow line is our trading algorithm that calculates several indicators against each other. A value above the horizontal line or a rising usually means rising asset prices, a value below the horizontal line or a falling usually indicates falling asset prices. The symbols at the bottom summarizes the results of the analysis of our algorithm and show our trading signals.
USE ONLY FOR EDUCATION OR TRADING SIMULATION, NOT FOR REAL TRADING.
Our latest analysis results for free (delayed)
Last update time shown on the first row of the table. REVlong means the main direction is downward, but it just comes to a temporary reversal in the opposite direction. REVshort means the main direction is upward, but it just comes to a temporary reversal in the opposite direction. It is always to be expected that the price moves back into the actual main trend direction.
Market Forecast Archive:
Chart Archive:

Weekly Chart 2021-03-22. The results may differ from the current chart due to a development of our analysis indicators.

Daily Chart 2021-03-22. The results may differ from the current chart due to a development of our analysis indicators.
Here we document our analytic results.
analysta market forecast archive.
Hong Kong Stock Exchange HKEX is a trademark of it's specific owner.
Dow Jones DJCFD is a trademark of it's specific owner.
Chicago Board of Trade CBOT is a trademark of it's specific owner.
New York Stock Exchange NYSE ARCA & MKT is a trademark of it's specific owner.
OANDA Corp. is a trademark of it's specific owner.
NASDAQ is a trademark of it's specific owner.
STOXX Limited is a trademark of it's specific owner.
European Exchange EUREX is a trademark of it's specific owner.
Chicago Mercantile Exchange CME is a trademark of it's specific owner.
New York Commodities Exchange COMEX is a trademark of it's specific owner.
Chicago Board Options Exchange CBOE is a trademark of it's specific owner.
New York Mercantile Exchange NYMEX is a trademark of it's specific owner.
WISDOMTREE is a trademark of it's specific owner.
London Stock Exchange LSE is a trademark of it's specific owner.
Intercontinental Exchange ICE is a trademark of it's specific owner.
Standard and Poor's S&P is a trademark of it's specific owner.
FXCM is a trademark of it's specific owner.
No advice on investment is given here
Disclaimer: All opinions, charts, messages, news, research, analysis, pricing, or other information available on this site are for general education and training purposes only. analysta is not responsible for any loss or damage, including without limitation, any loss of profit that may arise, directly or indirectly, from the reliance on such information. Please be fully informed regarding the risks and costs associated with trading the financial markets, it is one of the riskiest investment forms possible. Please note: Trading and investing is associated with a significant risk and may lead to a total loss of the capital invested or even an obligation to make additional payments.
Read the full article
0 notes
Text
Volatility Analysis 16.05.2020
Before it's here, it's on analysta.net ;-)
...read the full text on http://www.analysta.net
This analysis update is for volatility of stock and commodity markets. Here we look at some of the world's most-important volatility indices to give you an forecast of current developments in the stock and commodity markets. As you know, volatility is a measure of risk and shows the fluctuation in the price of an underlying. The greater this fluctuation range, the more volatile and therefore riskier an investment is.

A single arrow indicates a beginning long (↑) or short (↓) trend. An arrow in a circle indicates a large strength of the expected price movement.
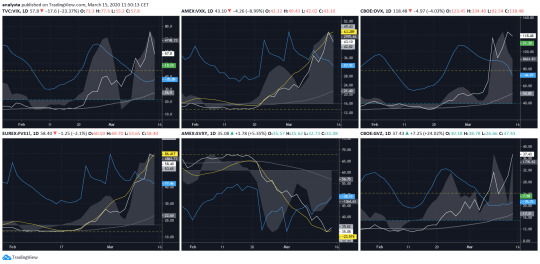
The graph shows today`s charts of CBOE Volatility Index (VIX), VSTOXX MINI INDEX FUTURES (FVS1!), GOLD VOLATILITY INDEX (GVZ), CBOE CRUDE OIL VOLATILITY INDEX (OVX), PROSHARES TRUST SHORT S&P 500 NEW ETF (SH), PROSHARES TRUST ULTRAPRO SHORT S&P 500 ETF (SPXU) and CBOE VIX Volatility Index (VVIX). The white line shows the price. The white line shows the price. The blue area is a volume indicator: a positive value usually predictes an upmoving price, a negative value predictes a downmoving price. The yellow line shows the moving average (MA) of the the VWMA (Volume Weighted Moving Average) in multiple timeframes, it is predictive for a long-term view. The gray line shows the 55 days EMA (Exponential Moving Average) for the price. ONLY ON FEW CHARTS: The green area is a modification of a FSK (Fast/Slow Kurtosis) indicator. It uses RSI in the calculation. A positive value usually predictes an upmoving price, a negative value predictes a downmoving price. The red line shows the moving average (MA) of the CCI (Commodity Channel Index) of the FSK indicator. The blue line calculates the EMA (Exponential Moving Average) and the SMA (Simple Moving Average) of the price to indicate a long or a short wave trend.
GVZ GOLD VOLATILITY INDEX analysis and forecast
Every week we look at the volatility of stock and commodity markets and give you our assessment. Let's look at the current GVZ GOLD VOLATILITY INDEX chart. The graph above shows the weekly chart of GOLD VOLATILITY INDEX, traded with the product symbol "GVZ" at Chicago Board Options Exchange CBOE.
The main price trend is SHORT.
For this week our indicators show a SHORT setting, so the GVZ GOLD VOLATILITY INDEX will probably move lower next week than closing price last week.
You can get trading signals for a long or a short entry by signing our trading alert service.
GVZ GOLD VOLATILITY INDEX is probably a trademark of it`s specific owner. Please check analysta market forecast table for latest price updates.
S&P 500 VIX FUTURES analysis and forecast
Every week we look at the stock markets and give you our assessment. Let's look at the current S&P 500 VOLATILITY FUTURES chart. The graph above shows the weekly chart of S&P 500 VIX FUTURES, traded with the product symbol "VX1" at Chicago Board Options Exchange CBOE.
The main price trend is SHORT.
For this week our indicators show a SHORT setting, so the S&P 500 VOLATILITY FUTURES will probably move lower next week than closing price last week.
You can get trading signals for a long or a short entry by signing our trading alert service.
S&P 500 VOLATILITY FUTURES is probably a trademark of it`s specific owner. Please check analysta market forecast table for latest price updates.
CBOE VIX VOLATILITY INDEX analysis and forecast
Every week we look at the volatility of stock and commodity markets and give you our assessment. Let's look at the current CBOE VIX VOLATILITY INDEX chart. The graph above shows the weekly chart of CBOE VIX VOLATILITY INDEX, traded with the product symbol "VVIX" at Chicago Board Options Exchange CBOE.
The main price trend is SHORT.
For this week our indicators show a REVlong setting, so the Chicago Board Options Exchange CBOE will probably move higher next week than closing price last week.
You can get trading signals for a long or a short entry by signing our trading alert service.
Chicago Board Options Exchange CBOE is probably a trademark of it`s specific owner. Please check analysta market forecast table for latest price updates.
PROSHARES TRUST ULTRAPRO SHORT S&P 500 ETF analysis and forecast
Every week we look at the volatility of stock and commodity markets and give you our assessment. Let's look at the current PROSHARES TRUST ULTRAPRO SHORT S&P 500 ETF chart. The graph above shows the weekly chart of PROSHARES TRUST ULTRAPRO SHORT S&P 500 ETF, traded with the product symbol "SPXU" at NYSE ARCA & MKT.
The main price trend is SHORT.
For this week our indicators show a SHORT setting, so the PROSHARES TRUST ULTRAPRO SHORT S&P 500 ETF will probably move lower next week than closing price last week.
You can get trading signals for a long or a short entry by signing our trading alert service.
PROSHARES TRUST ULTRAPRO SHORT S&P 500 ETF is probably a trademark of it`s specific owner. Please check analysta market forecast table for latest price updates.
PROSHARES TRUST SHORT S&P 500 NEW ETF analysis and forecast
Every week we look at the volatility of stock and commodity markets and give you our assessment. Let's look at the current PROSHARES TRUST SHORT S&P 500 NEW ETF chart. The graph above shows the weekly chart of PROSHARES TRUST SHORT S&P 500 NEW ETF, traded with the product symbol "SH" at NYSE ARCA & MKT.
The main price trend is SHORT.
For this week our indicators show a SHORT setting, so the PROSHARES TRUST SHORT S&P 500 NEW ETF will probably move lower next week than closing price last week.
You can get trading signals for a long or a short entry by signing our trading alert service.
PROSHARES TRUST SHORT S&P 500 NEW ETF is probably a trademark of it`s specific owner. Please check analysta market forecast table for latest price updates.
VOLATILITY INDEX analysis and forecast
Every week we look at the volatility of stock and commodity markets and give you our assessment. Let's look at the current VOLATILITY INDEX chart. The graph above shows the weekly chart of CBOE VOLATILITY INDEX, traded with the product symbol "VIX" at Chicago Board Options Exchange CBOE.
The main price trend is SHORT.
For this week our indicators show a REVlong setting, so the VOLATILITY INDEX will probably move higher next week than closing price last week.
You can get trading signals for a long or a short entry by signing our trading alert service.
VIX and S&P 500 are probably trademarks of it`s specific owner. Please check analysta market forecast table for latest price updates.
OVX CBOE CRUDE OIL VOLATILITY INDEX analysis and forecast
Every week we look at the volatility of stock and commodity markets and give you our assessment. Let's look at the current OVX CBOE CRUDE OIL VOLATILITY INDEX chart. The graph above shows the weekly chart of CBOE CRUDE OIL VOLATILITY INDEX, traded with the product symbol "OVX" at Chicago Board Options Exchange CBOE.
The main price trend is SHORT.
For this week our indicators show a SHORT setting, so the OVX CBOE CRUDE OIL VOLATILITY INDEX will probably move lower next week than closing price last week.
You can get trading signals for a long or a short entry by signing our trading alert service.
OVX CBOE CRUDE OIL VOLATILITY INDEX is probably a trademark of it`s specific owner. Please check analysta market forecast table for latest price updates.
VSTOXX MINI INDEX FUTURES analysis and forecast
Every week we look at the volatility of stock and commodity markets and give you our assessment. Let's look at the current FVS1! VSTOXX MINI INDEX FUTURES chart. The graph above shows the weekly chart of FVS1! VSTOXX MINI INDEX FUTURES, traded with the product symbol "FVS1!" at European Exchange EUREX.
The main price trend is SHORT.
For this week our indicators show a SHORT setting, so the FVS1! VSTOXX MINI INDEX FUTURES will probably move lower next week than closing price last week.
You can get trading signals for a long or a short entry by signing our trading alert service.
FVS1! VSTOXX MINI INDEX FUTURES is probably a trademark of it`s specific owner. Please check analysta market forecast table for latest price updates.
No advice on investment is given here
Disclaimer: All opinions, charts, messages, news, research, analysis, pricing, or other information available on this site are for general education and training purposes only. analysta is not responsible for any loss or damage, including without limitation, any loss of profit that may arise, directly or indirectly, from the reliance on such information. Please be fully informed regarding the risks and costs associated with trading the financial markets, it is one of the riskiest investment forms possible. Please note: Trading and investing is associated with a significant risk and may lead to a total loss of the capital invested or even an obligation to make additional payments.
Standard and Poor's S&P is a trademark of it's specific owner.
OANDA Corp. is a trademark of it's specific owner.
Chicago Board Options Exchange CBOE is a trademark of it's specific owner.
New York Stock Exchange NYSE ARCA & MKT is a trademark of it's specific owner.
New York Commodities Exchange COMEX is a trademark of it's specific owner.
Chicago Board of Trade CBOT is a trademark of it's specific owner.
Intercontinental Exchange ICE is a trademark of it's specific owner.
European Exchange EUREX is a trademark of it's specific owner.
Chicago Mercantile Exchange CME is a trademark of it's specific owner.
Hong Kong Stock Exchange HKEX is a trademark of it's specific owner.
Dow Jones DJCFD is a trademark of it's specific owner.
NASDAQ is a trademark of it's specific owner.
STOXX Limited is a trademark of it's specific owner.
WISDOMTREE is a trademark of it's specific owner.
London Stock Exchange LSE is a trademark of it's specific owner.
FXCM is a trademark of it's specific owner.
New York Mercantile Exchange NYMEX is a trademark of it's specific owner.
Read the full article
0 notes
Text
Hacked exchanges?
As of this morning at 9:30 a.m. trading on the European stock exchanges Xetra and Eurex is no longer possible. It cannot yet be said whether a crash in the trading system is the reason for this, as Deutsche Börse announced. The stock exchanges in Vienna, Prague and Budapest are also said to be affected. Trading there has also been suspended since the morning.
The price movements on the international stock exchanges are not very impressed by this, the S&P 500 index is currently above one percent in the plus.
No, we are not into the market now. Keep up to date with further news on analysta.net.
Read the full article
0 notes
Text
Agriculture Analysis 2020/03/29
Before it's here, it's on analysta.net ;-)
...read the full text on www.analysta.net
Math Is The Answer.
This is an analysis update for the agricultural commodity market. Here we look at some of the world's most-important commodity futures and agricultural assets to give you a prognosis of current developments in the following markets: Cotton No. 2 Futures, Oat Futures, Wheat Futures, Soybean Oil Futures, Sugar No. 11 Futures, Rice Futures, Corn Futures, Soybean Futures, Milk Nonfat Dry Futures, Coffee C Futures, Denatured Fuel Ethanol Futures, Feeder Cattle Futures, Milk Class III Futures, Cocoa Futures, Lean Hogs Futures, Live Cattle Futures, CFDs On Wheat, CFDs On Sugar, CFDs On Corn, CFDs On Soybeans.
Futures on Agriculture predictive analytics part 1
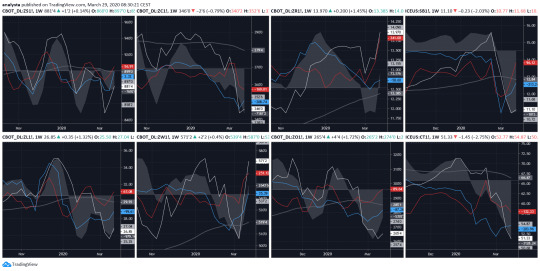
The white line shows the price. The gray area is a trend indicator: a positive value usually means a long trend, a negative value indicates a short trend. The blue and the red lines show the CCI (Commodity Channel Index) for the volume movement on multiple timeframes. The gray line shows the 55 days EMA (Exponential Moving Average) for the price. A typical long scenario occurs when the red and blue indicators are greater than zero and become increasingly positive. In a typical short scenario, the opposite is the case.
The graph shows today`s charts of COTTON NO. 2 FUTURES - ICE: CT1; OAT FUTURES - CBOT: ZO1; WHEAT FUTURES - CBOT: ZW1; SOYBEAN OIL FUTURES - CBOT: ZL1; SUGAR NO. 11 FUTURES - ICE: SB1; RICE FUTURES - CBOT: ZR1; CORN FUTURES - CBOT: ZC1; SOYBEAN FUTURES - CBOT: ZS1;
CORN FUTURES analysis and forecast
Every week we look at the agricultural markets and give you our assessment. Let's look at the current CORN FUTURES chart. The graph above shows the weekly chart of CORN FUTURES traded with the product symbol "ZC1" at Chicago Board of Trade CBOT.
The main price trend is SHORT.
For this week our indicators show a SHORT setting, so the CORN FUTURES price will probably move lower this week than closing price last week.
You can get trading signals for a long or a short entry by signing our trading alert service.
Please check analysta market forecast table for latest CORN FUTURES price updates.
COTTON NO. 2 FUTURES analysis and forecast
Every week we look at the agricultural markets and give you our assessment. Let's look at the current COTTON NO. 2 FUTURES chart. The graph above shows the weekly chart of COTTON NO. 2 FUTURES traded with the product symbol "CT1" at Intercontinental Exchange ICE.
The main price trend is SHORT.
For this week our indicators show a SHORT setting, so the COTTON NO. 2 FUTURES price will probably move lower this week than closing price last week.
You can get trading signals for a long or a short entry by signing our trading alert service.
Please check analysta market forecast table for latest COTTON NO. 2 FUTURES price updates.
OAT FUTURES analysis and forecast
Every week we look at the agricultural markets and give you our assessment. Let's look at the current OAT FUTURES chart. The graph above shows the weekly chart of OAT FUTURES traded with the product symbol "ZO1" at Chicago Board of Trade CBOT.
The main price trend is SHORT.
For this week our indicators show a REVlong setting, so the OAT FUTURES price will probably move higher this week than closing price last week.
You can get trading signals for a long or a short entry by signing our trading alert service.
Please check analysta market forecast table for latest OAT FUTURES price updates.
RICE FUTURES analysis and forecast
Every week we look at the agricultural markets and give you our assessment. Let's look at the current RICE FUTURES chart. The graph above shows the weekly chart of RICE FUTURES traded with the product symbol "ZR1" at Chicago Board of Trade CBOT.
The main price trend is LONG.
For this week our indicators show a LONG setting, so the RICE FUTURES price will probably move higher this week than closing price last week.
You can get trading signals for a long or a short entry by signing our trading alert service.
Please check analysta market forecast table for latest RICE FUTURES price updates.
SOYBEAN FUTURES analysis and forecast
Every week we look at the agricultural markets and give you our assessment. Let's look at the current SOYBEAN FUTURES chart. The graph above shows the weekly chart of SOYBEAN FUTURES traded with the product symbol "ZS1" at Chicago Board of Trade CBOT.
The main price trend is SHORT.
For this week our indicators show a REVlong setting, so the SOYBEAN FUTURES price will probably move higher this week than closing price last week.
You can get trading signals for a long or a short entry by signing our trading alert service.
Please check analysta market forecast table for latest SOYBEAN FUTURES price updates.
SOYBEAN OIL FUTURES analysis and forecast
Every week we look at the agricultural markets and give you our assessment. Let's look at the current SOYBEAN OIL FUTURES chart. The graph above shows the weekly chart of SOYBEAN OIL FUTURES traded with the product symbol "ZL1" at Chicago Board of Trade CBOT.
The main price trend is SHORT.
For this week our indicators show a REVlong setting, so the SOYBEAN OIL FUTURES price will probably move higher this week than closing price last week.
You can get trading signals for a long or a short entry by signing our trading alert service.
Please check analysta market forecast table for latest SOYBEAN OIL FUTURES price updates.
SUGAR NO. 11 FUTURES analysis and forecast
Every week we look at the agricultural markets and give you our assessment. Let's look at the current SUGAR NO. 11 FUTURES chart. The graph above shows the weekly chart of SUGAR NO. 11 FUTURES traded with the product symbol "SB1" at Intercontinental Exchange ICE.
The main price trend is SHORT.
For this week our indicators show a REVlong setting, so the SUGAR NO. 11 FUTURES price will probably move higher this week than closing price last week.
You can get trading signals for a long or a short entry by signing our trading alert service.
Please check analysta market forecast table for latest SUGAR NO. 11 FUTURES price updates.
WHEAT FUTURES analysis and forecast
Every week we look at the agricultural markets and give you our assessment. Let's look at the current WHEAT FUTURES chart. The graph above shows the weekly chart of WHEAT FUTURES traded with the product symbol "ZW1" at Chicago Board of Trade CBOT.
The main price trend is LONG.
For this week our indicators show a LONG setting, so the WHEAT FUTURES price will probably move higher this week than closing price last week.
You can get trading signals for a long or a short entry by signing our trading alert service.
Please check analysta market forecast table for latest WHEAT FUTURES price updates.
Before it's here, it's on analysta.net ;-)
...read the full text on www.analysta.net
Math Is The Answer.
Read the full article
0 notes
Text
Volatility Analysis 2020/03/15
Before it’s here, it’s on analysta.net! This analysis update is for volatility of stock and commodity markets. Here we look at some of the world's most-important volatility indices to give you an forecast of current developments in the stock and commodity markets. As you know, volatility is a measure of risk and shows the fluctuation in the price of an underlying. The greater this fluctuation range, the more volatile and therefore riskier an investment is.
The white line shows the price. The gray area is a trend indicator: a positive value usually means a long trend, a negative value indicates a short trend. The blue line shows the CCI (Commodity Channel Index) for the volume movement on multiple timeframes. The yellow line shows the MACD (Moving Average Convergence/Divergence) for the volume movement. The gray line shows the 55 days EMA (Exponential Moving Average) for the price.
The graph shows today`s charts of VIX Volatility S&P 500 Index (on derived data), VSTOXX MINI INDEX FUTURES (FVS1!), PROSHARES TRUST II SHORT VIX ETF (SVXY), BARCLAYS BANK IPATH S&P 500 VIX SHORT TERM FUTURE (VXX), GOLD VOLATILITY INDEX (GVZ), CBOE CRUDE OIL VOLATILITY INDEX (OVX).
VIX VOLATILITY analysis and forecast
Every week we look at the volatility of stock and commodity markets and give you our assessment. Let's look at the current VIX VOLATILITY S&P 500 INDEX chart. The graph above shows the weekly chart of VIX VOLATILITY S&P 500 INDEX.
The main price trend is LONG.
For this week our indicators show a LONG setting, so the VIX VOLATILITY S&P 500 INDEX price will probably move higher this week than closing price last week. The gray line shows the Exponential Moving Average (EMA 50). It can be either support or price resistance.
You can get trading signals for a long or a short entry by signing our trading alert service.
VIX and S&P 500 are probably trademarks of it`s specific owner. Please check analysta market forecast table for latest price updates.
FVS1! VSTOXX MINI INDEX FUTURES analysis and forecast
Every week we look at the volatility of stock and commodity markets and give you our assessment. Let's look at the current FVS1! VSTOXX MINI INDEX FUTURES chart. The graph above shows the weekly chart of FVS1! VSTOXX MINI INDEX FUTURES.
The main price trend is LONG.
For this week our indicators show a LONG setting, so the FVS1! VSTOXX MINI INDEX FUTURES price will probably move higher this week than closing price last week. The gray line shows the Exponential Moving Average (EMA 50). It can be either support or price resistance.
You can get trading signals for a long or a short entry by signing our trading alert service.
FVS1! VSTOXX MINI INDEX FUTURES is probably a trademark of it`s specific owner. Please check analysta market forecast table for latest price updates.
VXX BARCLAYS IPATH S&P 500 VIX SHORT TERM FUTURE analysis and forecast
Every week we look at the volatility of stock and commodity markets and give you our assessment. Let's look at the current VXX BARCLAYS IPATH S&P 500 VIX SHORT TERM FUTURE chart. The graph above shows the weekly chart of VXX BARCLAYS IPATH S&P 500 VIX SHORT TERM FUTURE.
The main price trend is LONG.
For this week our indicators show a LONG setting, so the VXX BARCLAYS IPATH S&P 500 VIX SHORT TERM FUTURE price will probably move higher this week than closing price last week. The gray line shows the Exponential Moving Average (EMA 50). It can be either support or price resistance.
You can get trading signals for a long or a short entry by signing our trading alert service.
VXX BARCLAYS IPATH S&P 500 VIX is probably a trademark of it`s specific owner. Please check analysta market forecast table for latest price updates.
SVXY PROSHARES SHORT VIX ETF analysis and forecast
Every week we look at the volatility of stock and commodity markets and give you our assessment. Let's look at the current SVXY PROSHARES SHORT VIX ETF chart. The graph above shows the weekly chart of SVXY PROSHARES SHORT VIX ETF.
The main price trend is SHORT.
For this week our indicators show a SHORT setting, so the SVXY PROSHARES SHORT VIX ETF price will probably move lower this week than closing price last week. The gray line shows the Exponential Moving Average (EMA 50). It can be either support or price resistance.
You can get trading signals for a long or a short entry by signing our trading alert service.
SVXY PROSHARES SHORT VIX ETF is probably a trademark of it`s specific owner. Please check analysta market forecast table for latest price updates.
OVX CBOE CRUDE OIL VOLATILITY INDEX analysis and forecast
Every week we look at the volatility of stock and commodity markets and give you our assessment. Let's look at the current OVX CBOE CRUDE OIL VOLATILITY INDEX chart. The graph above shows the weekly chart of OVX CBOE CRUDE OIL VOLATILITY INDEX.
The main price trend is LONG.
For this week our indicators show a LONG setting, so the OVX CBOE CRUDE OIL VOLATILITY INDEX price will probably move higher this week than closing price last week. The gray line shows the Exponential Moving Average (EMA 50). It can be either support or price resistance.
You can get trading signals for a long or a short entry by signing our trading alert service.
OVX CBOE CRUDE OIL VOLATILITY INDEX is probably a trademark of it`s specific owner. Please check analysta market forecast table for latest price updates.
GVZ GOLD VOLATILITY INDEX analysis and forecast
Every week we look at the volatility of stock and commodity markets and give you our assessment. Let's look at the current GVZ GOLD VOLATILITY INDEX chart. The graph above shows the weekly chart of GVZ GOLD VOLATILITY INDEX.
The main price trend is LONG.
For this week our indicators show a LONG setting, so the GVZ GOLD VOLATILITY INDEX price will probably move higher this week than closing price last week. The gray line shows the Exponential Moving Average (EMA 50). It can be either support or price resistance.
You can get trading signals for a long or a short entry by signing our trading alert service.
GVZ GOLD VOLATILITY INDEX is probably a trademark of it`s specific owner. Please check analysta market forecast table for latest price updates.
No advice on investment is given here
Disclaimer: All opinions, charts, messages, news, research, analysis, pricing, or other information available on this site are for general education and training purposes only. analysta is not responsible for any loss or damage, including without limitation, any loss of profit that may arise, directly or indirectly, from the reliance on such information. Please be fully informed regarding the risks and costs associated with trading the financial markets, it is one of the riskiest investment forms possible. Please be fully informed regarding the risks and costs associated with trading the financial markets, it is one of the riskiest investment forms possible.
Read the full article
0 notes
Text
Stock Market Analysis 2020/03/08
Before it's here, it's on analysta.net ;-)
...read the full text on www.analysta.net
Math Is The Answer.
This is an analysis update for stock markets. Here we look at some of the world's most-important stock indices to give you an forecast of current developments in the following markets: AUSTRALIA 200 (ASX), CHINA A50, JAPAN 225 (NIKKEI), SINGAPORE 30 (STI), EUROPE 50 (EURO STOXX), UK100 (FTSE), US S&P 500 and US NASDAQ 100.
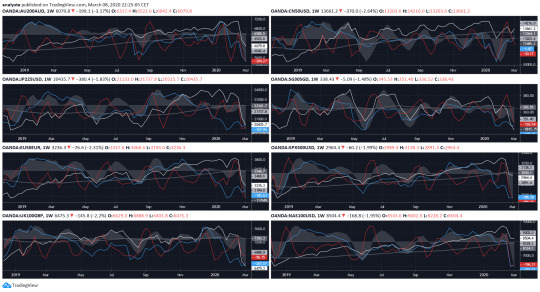
The white line shows the price. The gray area is a trend indicator: a positive value usually means a long trend, a negative value indicates a short trend. The blue and the red lines show the CCI (Commodity Channel Index) for the volume movement in different timeframes. The gray line shows the 55 days EMA (Exponential Moving Average) for the price.
The graph shows today`s charts of AUSTRALIA 200 in correlation to CFDs on Australian Securities Exchange (ASX), CHINA A50 in correlation to CFDs on Financial Times Stock Exchange (FTSE) China A50 Index, JAPAN 225 in correlation to CFDs on Nikkei 225, a stock market index for the Tokyo Stock Exchange (TSE), SINGAPORE 30 in correlation to CFDs on the FTSE Straits Times Index (STI), EUROPE 50 in correlation to CFDs on EURO STOXX 50, UK100 in correlation to CFDs on the Financial Times Stock Exchange 100 Index listed on the London Stock Exchange, the S&P 500 and NAS100USD in correlation to CFDs on NASDAQ 100.
EUROPE 50 (STOXX) analysis and forecast for current week
Every week we look at the markets and give you our assessment. Let's look at the current EUROPE 50 (STOXX) chart. The graph above shows the weekly chart of EUROPE 50 in correlation to CFDs on EURO STOXX 50.
The main price trend is SHORT.
For this week our indicators show a SHORT setting, so the EUROPE 50 (STOXX) price will probably move lower this week than closing price last week. The gray line shows the Exponential Moving Average (EMA 50). It can be either support or price resistance.
You can get trading signals for a long or a short entry by signing our trading alert service.
EURO STOXX is probably a trademark of it`s specific owner. Please check analysta market forecast table for latest price updates.
CHINA A50 analysis and forecast for current week
Every week we look at the markets and give you our assessment. Let's look at the current CHINA A50 chart. The graph above shows the weekly chart of CHINA A50 in correlation to CFDs on Financial Times Stock Exchange (FTSE) China A50 Index.
The main price trend is SHORT.
For this week our indicators show a REVlong setting, so the CHINA A50 price will probably move higher this week than closing price last week. The gray line shows the Exponential Moving Average (EMA 50). It can be either support or price resistance.
You can get trading signals for a long or a short entry by signing our trading alert service.
CHINA A50 and Financial Times Stock Exchange (FTSE) are probably trademarks of it`s specific owner. Please check analysta market forecast table for latest price updates.
UK100 (FTSE) analysis and forecast for current week
Every week we look at the markets and give you our assessment. Let's look at the current UK100 (FTSE) chart. The graph above shows the weekly chart of UK100 in correlation to CFDs on the Financial Times Stock Exchange 100 Index listed on the London Stock Exchange.
The main price trend is SHORT.
For this week our indicators show a SHORT setting, so the UK100 (FTSE) price will probably move lower this week than closing price last week. The gray line shows the Exponential Moving Average (EMA 50). It can be either support or price resistance.
You can get trading signals for a long or a short entry by signing our trading alert service.
FTSE and London Stock Exchange are probably trademarks of it`s specific owner. Please check analysta market forecast table for latest price updates.
JAPAN 225 (NIKKEI) analysis and forecast for current week
Every week we look at the markets and give you our assessment. Let's look at the current JAPAN 225 (NIKKEI) chart. The graph above shows the weekly chart of JAPAN 225 in correlation to CFDs on Nikkei 225, a stock market index for the Tokyo Stock Exchange (TSE).
The main price trend is SHORT.
For this week our indicators show a SHORT setting, so the JAPAN 225 (NIKKEI) price will probably move lower this week than closing price last week. The gray line shows the Exponential Moving Average (EMA 50). It can be either support or price resistance.
You can get trading signals for a long or a short entry by signing our trading alert service.
Nikkei 225 and Tokyo Stock Exchange (TSE) are probably trademarks of it`s specific owner. Please check analysta market forecast table for latest price updates.
US NASDAQ 100 analysis and forecast for current week
Every week we look at the markets and give you our assessment. Let's look at the current US NASDAQ 100 chart. The graph above shows the weekly chart of NAS100USD in correlation to CFDs on NASDAQ 100.
The main price trend is SHORT.
For this week our indicators show a SHORT setting, so the US NASDAQ 100 price will probably move lower this week than closing price last week. The gray line shows the Exponential Moving Average (EMA 50). It can be either support or price resistance.
You can get trading signals for a long or a short entry by signing our trading alert service.
NASDAQ is probably a trademark of it`s specific owner. Please check analysta market forecast table for latest price updates.
No advice on investment is given here
Disclaimer: All opinions, charts, messages, news, research, analysis, pricing, or other information available on this site are for general education and training purposes only. analysta is not responsible for any loss or damage, including without limitation, any loss of profit that may arise, directly or indirectly, from the reliance on such information. Please be fully informed regarding the risks and costs associated with trading the financial markets, it is one of the riskiest investment forms possible. Please be fully informed regarding the risks and costs associated with trading the financial markets, it is one of the riskiest investment forms possible.
Before it's here, it's on analysta.net ;-)
...read the full text on www.analysta.net
Math Is The Answer.
Read the full article
0 notes
Text
Currency Market Analysis 2020/02/09
Before it's here, it's on analysta.net ;-)
...read the full text on www.analysta.net
Math Is The Answer. NO GURUS NEEDED
This is an analysis update for the currency market. Here we look at some of the world's most important currencies to give you an forecast of current developments in the currency market. We look at US Dollar, Euro, Japanese Yen, Pound Sterling, Australian Dollar, Swiss Franc and Bitcoin, witch are some of the most traded currencies by value. Especially we are analysing the following currency pairs: AUD/USD, USD/JPY, EUR/USD, EUR/CHF, GBP/USD and BTC/USD. Finally, we look at the development of bonds, especially we see a chart of US 10 Year T-Note.
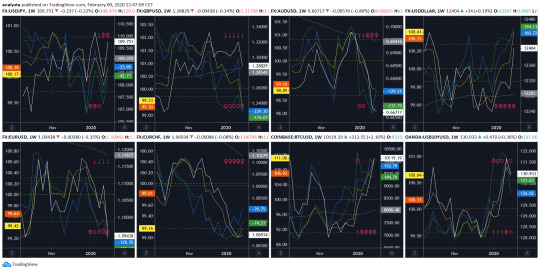
The graph shows today`s charts of USD/JPY, EUR/USD, GBP/USD, EUR/CHF, AUD/USD and BTC/USD. The last two charts are showing Dow Jones FXCM Dollar Index and below the World Currency Unit in US Dollar calculated by ICE Data Services.
USD/JPY analysis and forecast for current week
Every week we look at the markets and give you our assessment. Let's look at the current USD/JPY chart. The graph above shows the weekly chart of USD/JPY currency exchange rate.
The main price trend is LONG.
For this week our indicators show a LONG setting, so the USD/JPY rate will probably move higher this week than closing price last week. The gray line shows the Exponential Moving Average (EMA 50). It can be either support or price resistance.
You can get trading signals for a long or a short entry by signing our trading alert service.
Please check analysta market forecast table for latest USD/JPY price updates.
EUR/CHF analysis and forecast for current week
Every week we look at the markets and give you our assessment. Let's look at the current EUR/CHF chart. The graph above shows the weekly chart of EUR/CHF currency exchange rate.
The main price trend is SHORT.
For this week our indicators show a REVlong setting, so the EUR/CHF rate will probably move higher this week than closing price last week. The gray line shows the Exponential Moving Average (EMA 50). It can be either support or price resistance.
You can get trading signals for a long or a short entry by signing our trading alert service.
Please check analysta market forecast table for latest EUR/CHF price updates.
BITCOIN (BTC/USD) analysis and forecast for current week
Every week we look at the markets and give you our assessment. Let's look at the current BITCOIN (BTC/USD) chart. The graph above shows the weekly chart of BITCOIN (BTC/USD) currency exchange rate.
The main price trend is LONG.
For this week our indicators show a LONG setting, so the BITCOIN (BTC/USD) rate will probably move higher this week than closing price last week. The gray line shows the Exponential Moving Average (EMA 50). It can be either support or price resistance.
You can get trading signals for a long or a short entry by signing our trading alert service.
Please check analysta market forecast table for latest BITCOIN (BTC/USD) price updates.
US 10Y T-NOTE analysis and forecast for current week
Every week we look at the markets and give you our assessment. Let's look at the current US 10Y T-NOTE chart. The graph above shows the weekly chart of US 10Y T-NOTE bond.
The main price trend is LONG.
For this week our indicators show a LONG setting, so the US 10 Year T-Note price will probably move higher this week than closing price last week. The gray line shows the Exponential Moving Average (EMA 50). It can be either support or price resistance.
You can get trading signals for a long or a short entry by signing our trading alert service.
Please check analysta market forecast table for latest US 10 Year T-Note price updates.
AUD/USD analysis and forecast for current week
Every week we look at the markets and give you our assessment. Let's look at the current AUD/USD chart. The graph above shows the weekly chart of AUD/USD currency exchange rate.
The main price trend is SHORT.
For this week our indicators show a SHORT setting, so the AUD/USD rate will probably move lower this week than closing price last week. The gray line shows the Exponential Moving Average (EMA 50). It can be either support or price resistance.
You can get trading signals for a long or a short entry by signing our trading alert service.
Please check analysta market forecast table for latest AUD/USD price updates.
US DOLLAR analysis and forecast for current week
Every week we look at the markets and give you our assessment. Let's look at the current US DOLLAR chart. The graph above shows the weekly chart of US DOLLAR currency.
The main price trend is LONG.
For this week our indicators show a LONG setting, so the US DOLLAR price will probably move higher this week than closing price last week. The gray line shows the Exponential Moving Average (EMA 50). It can be either support or price resistance.
You can get trading signals for a long or a short entry by signing our trading alert service.
Please check analysta market forecast table for latest US DOLLAR price updates.
EUR/USD analysis and forecast for current week
Every week we look at the markets and give you our assessment. Let's look at the current EUR/USD chart. The graph above shows the weekly chart of EUR/USD currency exchange rate.
The main price trend is SHORT.
For this week our indicators show a SHORT setting, so the EUR/USD rate will probably move lower this week than closing price last week. The gray line shows the Exponential Moving Average (EMA 50). It can be either support or price resistance.
You can get trading signals for a long or a short entry by signing our trading alert service.
Please check analysta market forecast table for latest EUR/USD price updates.
GBP/USD analysis and forecast for current week
Every week we look at the markets and give you our assessment. Let's look at the current GBP/USD chart. The graph above shows the weekly chart of GBP/USD currency exchange rate.
The main price trend is SHORT.
For this week our indicators show a SHORT setting, so the GBP/USD rate will probably move lower this week than closing price last week. The gray line shows the Exponential Moving Average (EMA 50). It can be either support or price resistance.
You can get trading signals for a long or a short entry by signing our trading alert service.
Please check analysta market forecast table for latest GBP/USD price updates.
Bitcoin, Dow Jones, FXCM and ICE are probably trademarks of it's specific owner.
No advice on investment is given here
Disclaimer: All opinions, charts, messages, news, research, analysis, pricing, or other information available on this site are for general education and training purposes only. analysta is not responsible for any loss or damage, including without limitation, any loss of profit that may arise, directly or indirectly, from the reliance on such information. Please be fully informed regarding the risks and costs associated with trading the financial markets, it is one of the riskiest investment forms possible. Please be fully informed regarding the risks and costs associated with trading the financial markets, it is one of the riskiest investment forms possible.
Read the full article
0 notes
Text
Weekly Forecast 2020/01/29
Stock Market Analysis for 2020/01/29
This our weekly forecast for stock markets. Here we look at some of the world's most-important stock indices to share our view of current developments in the following markets: AUSTRALIA 200 (ASX), CHINA A50, JAPAN 225 (NIKKEI), SINGAPORE 30 (STI), EUROPE 50 (EURO STOXX), UK100 (FTSE), US S&P 500 and US NASDAQ 100.

The graph shows today`s charts of AUSTRALIA 200 in correlation to CFDs on Australian Securities Exchange (ASX), CHINA A50 in correlation to CFDs on Financial Times Stock Exchange (FTSE) China A50 Index, JAPAN 225 in correlation to CFDs on Nikkei 225, a stock market index for the Tokyo Stock Exchange (TSE), SINGAPORE 30 in correlation to CFDs on the FTSE Straits Times Index (STI), EUROPE 50 in correlation to CFDs on EURO STOXX 50, UK100 in correlation to CFDs on the Financial Times Stock Exchange 100 Index listed on the London Stock Exchange, the S&P 500 and NAS100USD in correlation to CFDs on NASDAQ 100. The gray line shows the Exponential Moving Average (EMA 50). It can be either support or price resistance.
AUSTRALIA 200 (ASX) analysis and forecast
Let's look at the current AUSTRALIA 200 (ASX) chart. The graph above shows the weekly chart of AUSTRALIA 200 in correlation to CFDs on Australian Securities Exchange (ASX).
For this week our indicators show a LONG setting.
In our view the AUSTRALIA 200 (ASX) price will probably move higher this week than closing price last week.
You can get trading signals for a long or a short entry by signing our trading alert service.
Australian Securities Exchange (ASX) is probably a trademark of it`s specific owner. Please check analysta market forecast table for latest price updates.
CHINA A50 analysis and forecast
Let's look at the current CHINA A50 chart. The graph above shows the weekly chart of CHINA A50 in correlation to CFDs on Financial Times Stock Exchange (FTSE) China A50 Index.
For this week our indicators show a SHORT setting.
In our view the CHINA A50 price will probably move lower this week than closing price last week.
You can get trading signals for a long or a short entry by signing our trading alert service.
CHINA A50 and Financial Times Stock Exchange (FTSE) are probably trademarks of it`s specific owner. Please check analysta market forecast table for latest price updates.
JAPAN 225 (NIKKEI) analysis and forecast
Let's look at the current JAPAN 225 (NIKKEI) chart. The graph above shows the weekly chart of JAPAN 225 in correlation to CFDs on Nikkei 225, a stock market index for the Tokyo Stock Exchange (TSE).
For this week our indicators show a SHORT setting.
In our view the JAPAN 225 (NIKKEI) price will probably move lower this week than closing price last week.
You can get trading signals for a long or a short entry by signing our trading alert service.
Nikkei 225 and Tokyo Stock Exchange (TSE) are probably trademarks of it`s specific owner. Please check analysta market forecast table for latest price updates.
SINGAPORE 30 (STI) analysis and forecast
Let's look at the current SINGAPORE 30 (STI) chart. The graph above shows the weekly chart of SINGAPORE 30 in correlation to CFDs on the FTSE Straits Times Index (STI).
For this week our indicators show a SHORT setting.
In our view the SINGAPORE 30 (STI) price will probably move lower this week than closing price last week.
You can get trading signals for a long or a short entry by signing our trading alert service.
FTSE Straits Times Index (STI) is probably a trademark of it`s specific owner. Please check analysta market forecast table for latest price updates.
EUROPE 50 (STOXX) analysis and forecast
Let's look at the current EUROPE 50 (STOXX) chart. The graph above shows the weekly chart of EUROPE 50 in correlation to CFDs on EURO STOXX 50.
For this week our indicators show a SHORT setting.
In our view the EUROPE 50 (STOXX) price will probably move lower this week than closing price last week.
You can get trading signals for a long or a short entry by signing our trading alert service.
EURO STOXX is probably a trademark of it`s specific owner. Please check analysta market forecast table for latest price updates.
UK100 (FTSE) analysis and forecast
Let's look at the current UK100 (FTSE) chart. The graph above shows the weekly chart of UK100 in correlation to CFDs on the Financial Times Stock Exchange 100 Index listed on the London Stock Exchange.
For this week our indicators show a REVshort setting.
In our view the UK100 (FTSE) price will probably move lower this week than closing price last week.
You can get trading signals for a long or a short entry by signing our trading alert service.
FTSE and London Stock Exchange are probably trademarks of it`s specific owner. Please check analysta market forecast table for latest price updates.
US S&P 500 analysis and forecast
Let's look at the current US S&P 500 chart. The graph above shows the weekly chart of the US stock market index S&P 500 .
For this week our indicators show a REVshort setting.
In our view the US S&P 500 price will probably move lower this week than closing price last week.
You can get trading signals for a long or a short entry by signing our trading alert service.
S&P is probably a trademark of it`s specific owner. Please check analysta market forecast table for latest price updates.
US NASDAQ 100 analysis and forecast
Let's look at the current US NASDAQ 100 chart. The graph above shows the weekly chart of NAS100USD in correlation to CFDs on NASDAQ 100.
For this week our indicators show a REVshort setting.
In our view the US NASDAQ 100 price will probably move lower this week than closing price last week.
You can get trading signals for a long or a short entry by signing our trading alert service.
NASDAQ is probably a trademark of it`s specific owner. Please check analysta market forecast table for latest price updates.
Currency Market Analysis for 2020/01/29
This our weekly forecast for the currency market. Here we look at some of the world's most important currencies to share our view of current developments in the currency market. We look at US Dollar, Euro, Japanese Yen, Pound Sterling, Australian Dollar, Swiss Franc and Bitcoin, witch are some of the most traded currencies by value. Especially we are analysing the following currency pairs: AUD/USD, USD/JPY, EUR/USD, EUR/CHF, GBP/USD and BTC/USD. Finally, we look at the development of bonds, especially we see a chart of US 10 Year T-Note.
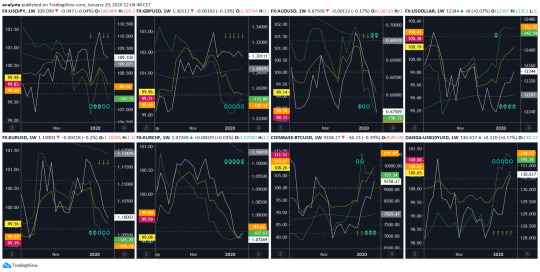
The graph shows today`s charts of USD/JPY, EUR/USD, GBP/USD, EUR/CHF, AUD/USD and BTC/USD. The last two charts are showing Dow Jones FXCM Dollar Index and below US 10 Year T-Note. The gray line shows the Exponential Moving Average (EMA 50). It can be either support or price resistance.
US DOLLAR analysis and forecast
Let's look at the current US DOLLAR chart. The graph above shows the weekly chart of US DOLLAR currency.
For this week our indicators show a LONG setting.
In our view the US DOLLAR price will probably move higher this week than closing price last week.
You can get trading signals for a long or a short entry by signing our trading alert service.
Please check analysta market forecast table for latest US DOLLAR price updates.
AUD/USD analysis and forecast
Let's look at the current AUD/USD chart. The graph above shows the weekly chart of AUD/USD currency exchange rate.
For this week our indicators show a SHORT setting.
In our view the AUD/USD rate will probably move lower this week than closing price last week.
You can get trading signals for a long or a short entry by signing our trading alert service.
Please check analysta market forecast table for latest AUD/USD price updates.
USD/JPY analysis and forecast
Let's look at the current USD/JPY chart. The graph above shows the weekly chart of USD/JPY currency exchange rate.
For this week our indicators show a REVshort setting.
In our view the USD/JPY rate will probably move lower this week than closing price last week.
You can get trading signals for a long or a short entry by signing our trading alert service.
Please check analysta market forecast table for latest USD/JPY price updates.
EUR/USD analysis and forecast
Let's look at the current EUR/USD chart. The graph above shows the weekly chart of EUR/USD currency exchange rate.
For this week our indicators show a SHORT setting.
In our view the EUR/USD rate will probably move lower this week than closing price last week.
You can get trading signals for a long or a short entry by signing our trading alert service.
Please check analysta market forecast table for latest EUR/USD price updates.
EUR/CHF analysis and forecast
Let's look at the current EUR/CHF chart. The graph above shows the weekly chart of EUR/CHF currency exchange rate.
For this week our indicators show a SHORT setting.
In our view the EUR/CHF rate will probably move lower this week than closing price last week.
You can get trading signals for a long or a short entry by signing our trading alert service.
Please check analysta market forecast table for latest EUR/CHF price updates.
GBP/USD analysis and forecast
Let's look at the current GBP/USD chart. The graph above shows the weekly chart of GBP/USD currency exchange rate.
For this week our indicators show a REVshort setting.
In our view the GBP/USD rate will probably move lower this week than closing price last week.
You can get trading signals for a long or a short entry by signing our trading alert service.
Please check analysta market forecast table for latest GBP/USD price updates.
BITCOIN (BTC/USD) analysis and forecast
Let's look at the current BITCOIN (BTC/USD) chart. The graph above shows the weekly chart of BITCOIN (BTC/USD) currency exchange rate.
For this week our indicators show a LONG setting.
In our view the BITCOIN (BTC/USD) rate will probably move higher this week than closing price last week.
You can get trading signals for a long or a short entry by signing our trading alert service.
Please check analysta market forecast table for latest BITCOIN (BTC/USD) price updates.
US 10Y T-NOTE analysis and forecast
Let's look at the current US 10Y T-NOTE chart. The graph above shows the weekly chart of US 10Y T-NOTE bond.
For this week our indicators show a LONG setting.
In our view the US 10 Year T-Note price will probably move higher this week than closing price last week.
You can get trading signals for a long or a short entry by signing our trading alert service.
Please check analysta market forecast table for latest US 10 Year T-Note price updates.
Bitcoin, Dow Jones, FXCM and ICE are probably trademarks of it's specific owner.
Energy Market Analysis for 2020/01/29
This our weekly forecast for the energy commodity market. Here we look at some of the world's most-important commodities to share our view of current developments in the energy market. Crude Oil benchmarks are the United States' WTI (West Texas Intermediate) and United Kingdom's Brent. We also look at Gasoline Futures, CFDs on Natural Gas and NY Harbor Heating Oil Futures. The Cboe Crude Oil Volatility Index points to increasing or decreasing price fluctuations in the energy sector.

The graph shows today`s charts of WTI (West Texas Intermediate) Oil, Brent Crude Oil, Gasoline Futures, CFDs on Natural Gas, NY Harbor Heating Oil Futures and the Cboe Crude Oil Volatility Index. The gray line shows the Exponential Moving Average (EMA 50). It can be either support or price resistance.
West Texas Intermediate WTI Oil analysis and forecast
Let's look at the current West Texas Intermediate WTI Oil chart. The graph above shows the weekly chart of WTICOUSD in correlation to West Texas Intermediate WTI Oil.
For this week our indicators show a SHORT setting.
In our view the West Texas Intermediate WTI Oil price will probably move lower this week than closing price last week.
You can get trading signals for a long or a short entry by signing our trading alert service.
Please check analysta market forecast table for latest WTI (OIL) price updates.
Brent Crude Oil analysis and forecast
Let's look at the current Brent Crude Oil chart. The graph above shows the weekly chart of BCOUSD in correlation to Brent Crude Oil.
For this week our indicators show a SHORT setting.
In our view the Brent Crude Oil price will probably move lower this week than closing price last week.
You can get trading signals for a long or a short entry by signing our trading alert service.
Please check analysta market forecast table for latest BRENT (OIL) price updates.
Gasoline analysis and forecast
Let's look at the current Gasoline chart. The graph above shows the weekly chart of RB1! in correlation to RBOB Gasoline Futures.
For this week our indicators show a SHORT setting.
In our view the Gasoline price will probably move lower this week than closing price last week.
You can get trading signals for a long or a short entry by signing our trading alert service.
Please check analysta market forecast table for latest GASOLINE price updates.
Heating Oil analysis and forecast
Let's look at the current Heating Oil chart. The graph above shows the weekly chart of NYMEX HO1 NY Harbor ULSD Future in correlation to HEATING OIL.
For this week our indicators show a SHORT setting.
In our view the Heating Oil price will probably move lower this week than closing price last week.
You can get trading signals for a long or a short entry by signing our trading alert service.
Please check analysta market forecast table for latest HEATING OIL price updates.
Natural Gas analysis and forecast
Let's look at the current Natural Gas chart. The graph above shows the weekly chart of NATGASUSD in correlation to Natural Gas Index on Henry Hub.
For this week our indicators show a SHORT setting.
In our view the Natural Gas price will probably move lower this week than closing price last week.
You can get trading signals for a long or a short entry by signing our trading alert service.
Please check analysta market forecast table for latest NATURAL GAS price updates.
Crude Oil Volatility analysis and forecast
Let's look at the current Crude Oil Volatility chart. The graph above shows the weekly chart of Cboe Crude Oil Volatility Index that shows price fluctuations in the energy sector.
For this week our indicators show a LONG setting.
In our view the Crude Oil Volatility will probably move higher today than closing yesterday.
You can get trading signals for a long or a short entry by signing our trading alert service.
Cboe Crude Oil Volatility Index is probably a trademark of it`s specific owner.
Precious and Industrial Metals Analysis for 2020/01/29
This our weekly forecast for precious and industrial metals to share our view of current developments in the metal commodities market. We look at Gold, Silver, Platinum and Palladium as precious metals and Copper and Nickel as industrial metals.

The graph shows today`s charts of Gold, Silver, Platinum and Palladium as precious metals and Copper and Nickel as industrial metals. The gray line shows the Exponential Moving Average (EMA 50). It can be either support or price resistance.
GOLD analysis and forecast
Let's look at the current GOLD chart. The graph above shows the weekly chart of GOLD.
For this week our indicators show a LONG setting.
In our view the GOLD price will probably move higher this week than closing price last week.
You can get trading signals for a long or a short entry by signing our trading alert service.
Please check analysta market forecast table for latest GOLD price updates.
SILVER analysis and forecast
Let's look at the current SILVER chart. The graph above shows the weekly chart of SILVER.
For this week our indicators show a REVshort setting.
In our view the SILVER price will probably move lower this week than closing price last week.
You can get trading signals for a long or a short entry by signing our trading alert service.
Please check analysta market forecast table for latest SILVER price updates.
PLATINUM analysis and forecast
Let's look at the current PLATINUM chart. The graph above shows the weekly chart of PLATINUM.
For this week our indicators show a REVshort setting.
In our view the PLATINUM price will probably move lower this week than closing price last week.
You can get trading signals for a long or a short entry by signing our trading alert service.
Please check analysta market forecast table for latest PLATINUM price updates.
PALLADIUM analysis and forecast
Let's look at the current PALLADIUM chart. The graph above shows the weekly chart of PALLADIUM.
For this week our indicators show a REVshort setting.
In our view the PALLADIUM price will probably move lower this week than closing price last week.
You can get trading signals for a long or a short entry by signing our trading alert service.
Please check analysta market forecast table for latest PALLADIUM price updates.
COPPER analysis and forecast
Let's look at the current COPPER chart. The graph above shows the weekly chart of COPPER.
For this week our indicators show a SHORT setting.
In our view the COPPER price will probably move lower this week than closing price last week.
You can get trading signals for a long or a short entry by signing our trading alert service.
Please check analysta market forecast table for latest COPPER price updates.
NICKEL analysis and forecast
Let's look at the current NICKEL chart. The graph above shows the weekly chart of NICKEL.
For this week our indicators show a SHORT setting.
In our view the NICKEL price will probably move lower this week than closing price last week.
You can get trading signals for a long or a short entry by signing our trading alert service.
Please check analysta market forecast table for latest NICKEL price updates.
Agriculture Analysis for 2020/01/29
This our weekly forecast for the agricultural commodity market. Here we look at some of the world's most-important commodities and agricultural assets to give you an forecast of current developments in the following markets: Live Cattle, Cocoa, Cotton, Coffee, Soybeans, Corn, Sugar and Wheat.
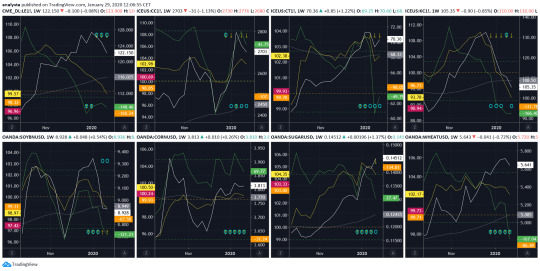
The graph shows today`s charts of LE1! in correlation to Live Cattle Futures, CC1! in correlation to COCOA FUTURES, CT1! in correlation to COTTON NO. 2 FUTURES, KC1! in correlation to COFFEE C FUTURES, SOYBNUSD in correlation to CFDs On SOYBEANS PRICE, CORNUSD in correlation to CFDs On CORN PRICE, SUGARUSD in correlation to CFDs On SUGAR PRICE and WHEATUSD in correlation to CFDs On WHEAT PRICE.
Live Cattle analysis and forecast
Let's look at the current Live Cattle chart. The graph above shows the weekly chart of LE1! in correlation to Live Cattle Futures.
For this week our indicators show a SHORT setting.
In our view the Live Cattle price will probably move lower this week than closing price last week.
You can get trading signals for a long or a short entry by signing our trading alert service.
Please check analysta market forecast table for latest Live Cattle price updates.
Cocoa analysis and forecast
Let's look at the current Cocoa chart. The graph above shows the weekly chart of CC1! in correlation to COCOA FUTURES.
For this week our indicators show a REVshort setting.
In our view the Cocoa price will probably move lower this week than closing price last week.
You can get trading signals for a long or a short entry by signing our trading alert service.
Please check analysta market forecast table for latest Cocoa price updates.
Cotton analysis and forecast
Let's look at the current Cotton chart. The graph above shows the weekly chart of CT1! in correlation to COTTON NO. 2 FUTURES.
For this week our indicators show a REVshort setting.
In our view the Cotton price will probably move lower this week than closing price last week.
You can get trading signals for a long or a short entry by signing our trading alert service.
Please check analysta market forecast table for latest Cotton price updates.
Coffee analysis and forecast
Let's look at the current Coffee chart. The graph above shows the weekly chart of KC1! in correlation to COFFEE C FUTURES.
For this week our indicators show a SHORT setting.
In our view the Coffee price will probably move lower this week than closing price last week.
You can get trading signals for a long or a short entry by signing our trading alert service.
Please check analysta market forecast table for latest Coffee price updates.
Soybeans analysis and forecast
Let's look at the current Soybeans chart. The graph above shows the weekly chart of SOYBNUSD in correlation to CFDs On SOYBEANS PRICE.
For this week our indicators show a SHORT setting.
In our view the Soybeans price will probably move lower this week than closing price last week.
You can get trading signals for a long or a short entry by signing our trading alert service.
Please check analysta market forecast table for latest Soybeans price updates.
Corn analysis and forecast
Let's look at the current Corn chart. The graph above shows the weekly chart of CORNUSD in correlation to CFDs On CORN PRICE.
For this week our indicators show a LONG setting.
In our view the Corn price will probably move higher this week than closing price last week.
You can get trading signals for a long or a short entry by signing our trading alert service.
Please check analysta market forecast table for latest Corn price updates.
Sugar analysis and forecast
Let's look at the current Sugar chart. The graph above shows the weekly chart of SUGARUSD in correlation to CFDs On SUGAR PRICE.
For this week our indicators show a LONG setting.
In our view the Sugar price will probably move higher this week than closing price last week.
You can get trading signals for a long or a short entry by signing our trading alert service.
Please check analysta market forecast table for latest Sugar price updates.
Wheat analysis and forecast
Let's look at the current Wheat chart. The graph above shows the weekly chart of WHEATUSD in correlation to CFDs On WHEAT PRICE.
For this week our indicators show a REVshort setting.
In our view the Wheat price will probably move lower this week than closing price last week.
You can get trading signals for a long or a short entry by signing our trading alert service.
Please check analysta market forecast table for latest Wheat price updates.
No advice on investment is given here
Disclaimer: All opinions, charts, messages, news, research, analysis, pricing, or other information available on this site are for general education and training purposes only. analysta is not responsible for any loss or damage, including without limitation, any loss of profit that may arise, directly or indirectly, from the reliance on such information. Please be fully informed regarding the risks and costs associated with trading the financial markets, it is one of the riskiest investment forms possible. Please be fully informed regarding the risks and costs associated with trading the financial markets, it is one of the riskiest investment forms possible.
Read the full article
1 note
·
View note