#sea ice
Text
The 1987 Montreal Protocol, which phased out the production and use of chemicals that were depleting the ozone layer, has long been considered one of the most successful environmental treaties in history. New research finds that the global pact achieved another unforeseen benefit: delaying the melting of Arctic sea ice.
In a study published Monday in the Proceedings of the National Academy of Sciences, researchers from the University of Exeter and Columbia University found that the implementation of the Montreal Protocol is delaying the first ice-free Arctic summer by up to 15 years. That’s because the chemicals banned under the agreement are also potent greenhouse gases.
“Our results show that the climate benefits from the Montreal Protocol are not in some faraway future: the protocol is delaying the melting of Arctic sea ice at this very moment,” Lorenzo Polvani, one of the study’s authors, said in a press release.
The study authors ran a series of climate models based on two different scenarios: one that included levels of ozone-depleting substances that would be expected if the Montreal Protocol never existed, and another accounting for the global treaty. The researchers concluded that the protocol is postponing the first ice-free Arctic summer by a decade or more, and entirely due to the phasedown of ozone-depleting chemicals.
The Montreal Protocol was created to address a hole in the stratospheric ozone layer over the Antarctic. The ozone layer protects the Earth from harmful ultraviolet radiation that causes skin cancer and cataracts in humans. The treaty phased out almost 100 chemicals — including aerosols used in hair spray and other products, refrigerants, and solvents — that were found to be responsible for destroying stratospheric ozone.
Those banned chemicals, collectively called ozone-depleting substances, or ODS, are also potent greenhouse gases, with up to tens of thousands times the global warming potential of carbon dioxide. The report authors estimate that 1 metric ton of avoided ODS emissions leads to 7,000 square meters (more than 75,000 square feet) of avoided Arctic sea loss. By way of comparison, 1 metric ton of carbon dioxide emissions results in about 3 square meters (about 32 square feet) of sea ice loss.
Given the potency of ODSs as a greenhouse gas, the authors are not surprised at this outsize impact on Arctic sea ice levels. “Nonetheless, such a large mitigating impact of the Montreal Protocol on Arctic sea ice loss is remarkable if one keeps in mind that the protocol was aimed at preventing ozone depletion in the Antarctic stratosphere, and little was known of its effect on Arctic sea ice when the protocol was signed,” the authors noted.
According to their projections, the Montreal Protocol has already prevented more than half a million square kilometers (about 193,000 square miles) of sea ice loss. By 2030, that amount will rise to more than 1 million square kilometers, and to 2 million square kilometers of prevented Arctic sea ice loss by 2040.
-via Grist, 5/24/23
#arctic#arctic circle#arctic ocean#arctic ice#sea ice#climate change#global warming#sea level rise#montreal protocol#cfc#hfc#greenhouse gasses#carbon dioxide#if we hurry#we can absolutely buy ourselves the time to save ourselves#as someone constantly looking at good news developments in the environment and green tech I truly believe that#good news#hope
417 notes
·
View notes
Text
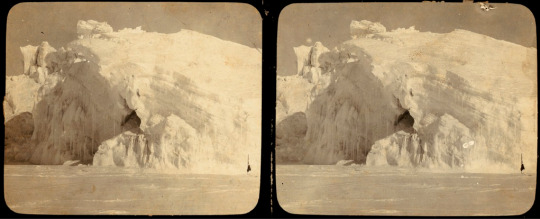
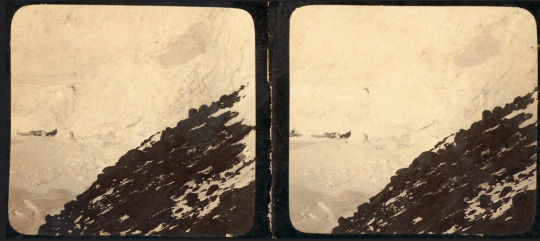
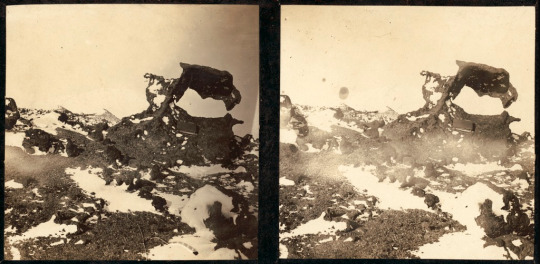

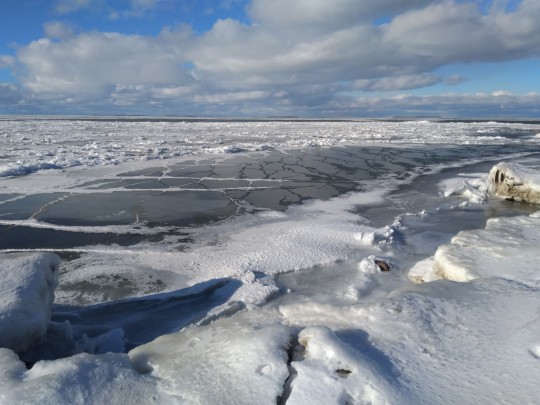
'Dear Google,' said I, 'please show me what a shear crack in sea ice looks like.'
'Do you mean T. Griffith Taylor's unpublished stereograph of the shear crack between Inaccessible and Tent Islands, which he and Wright admired on the day Wright wanted to shoot Teddy Evans (who he thought was a penguin), which is probably why you're searching for shear crack reference?'
'Why yes, Google, that will do nicely, thank you.'
[concealed amongst hundreds of other random photos on the National Library of Australia's Flickr. There are also some Hurley photos from the Australasian Expedition but this is not a Mawson blog.]
#photos#griff#t. griffith taylor#stereograph#photography#terra nova expedition#new photo klaxon#national library of australia#frank hurley#sea ice#shear crack#tent island#antarctica
93 notes
·
View notes
Photo
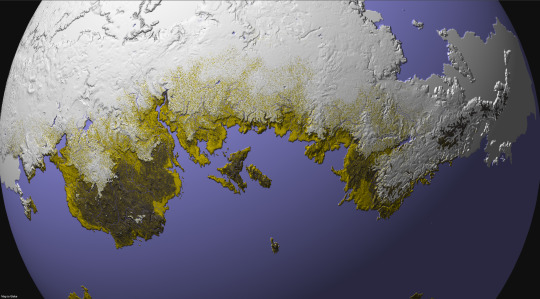
Some months ago, I created a series of maps and diagrams for @iguanodont‘s Birdbug worldbuilding project, representing the planet inhabited by their original species and its planetological data. This isn’t the first time I mapped out this planet, as I was also commissioned by Ripley back in 2020 back when I didn’t have nearly as much experience and knowledge as I do now. Two years later, I’ve been commissioned once again to revisit this world and its peculiarities.
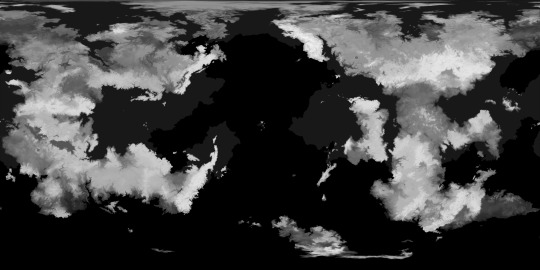
This first map (in Equirectangular projection and poles-centered perspective) depicts the elevation for this planet, with a color gradient applied to the data.
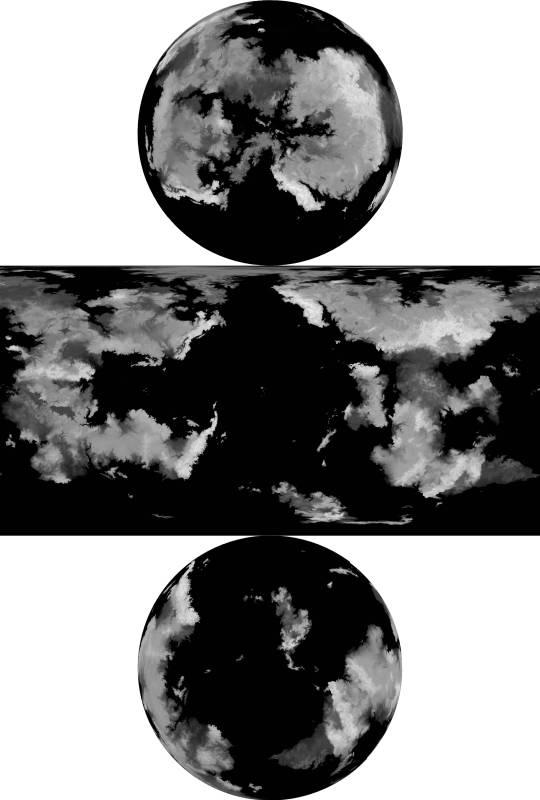
Here is the same elevation data, presented without the color gradient.
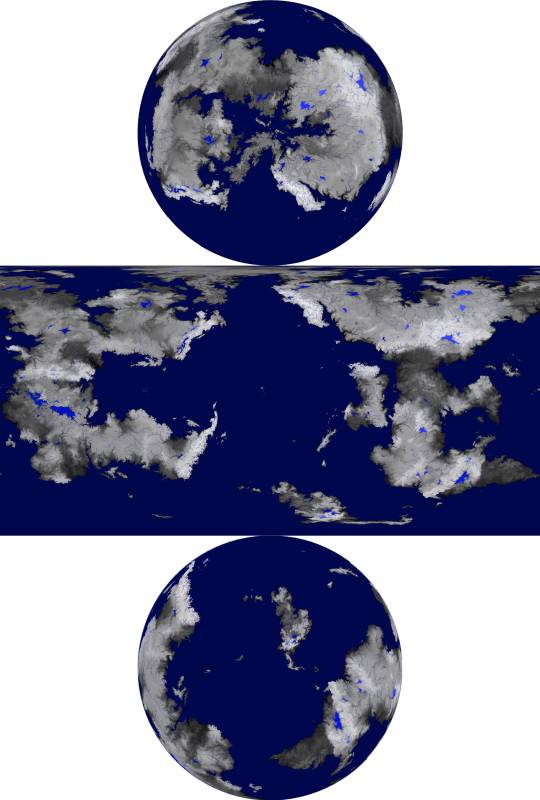
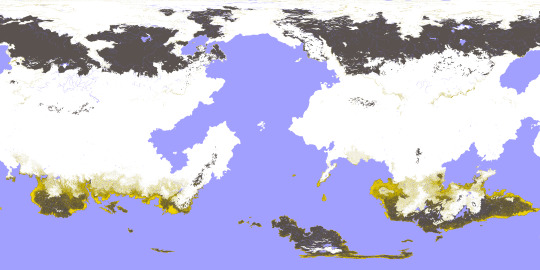
This time, the elevation is presented with bodies of liquid water included, such as rivers, oceans, and lakes.
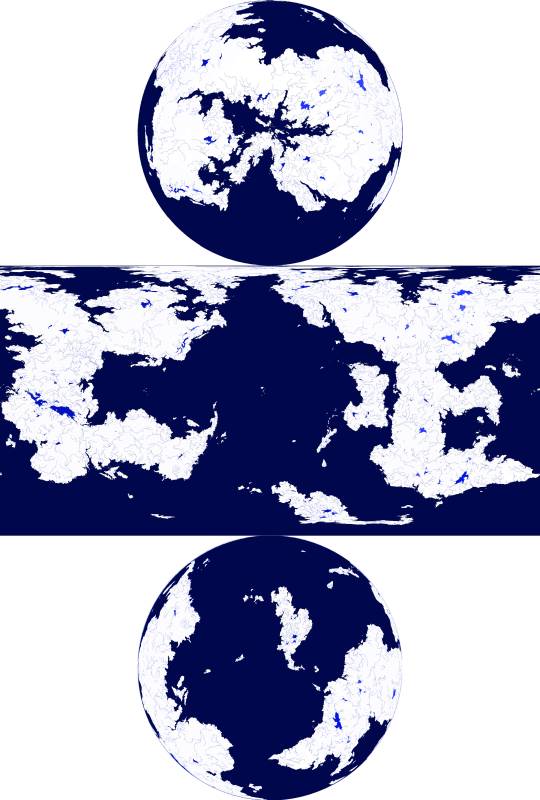
and in this one, the water is isolated from the other data, against a white background
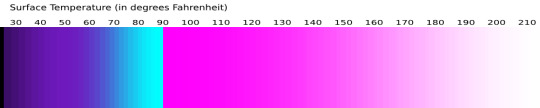
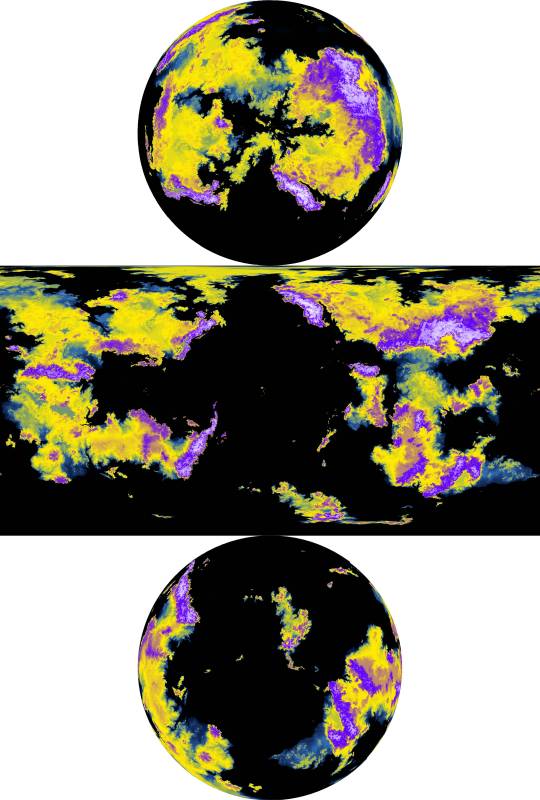
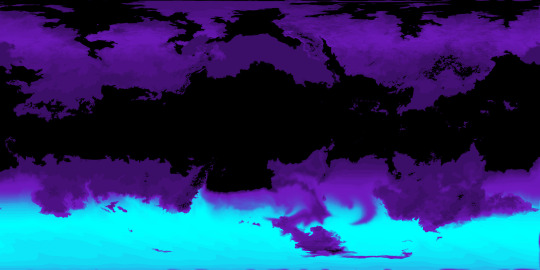
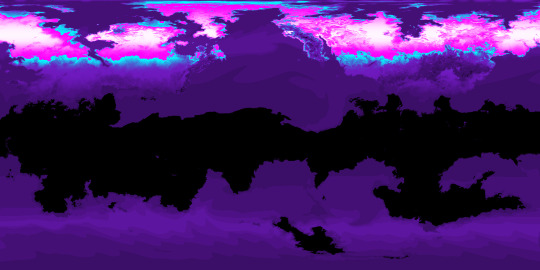
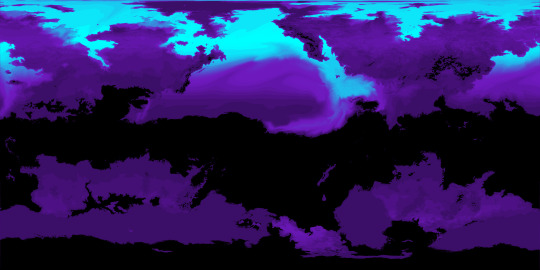
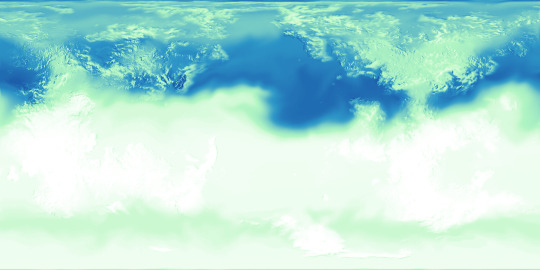
Next, there are the surface temperatures that occur on this planet, the key to which is shown above. The four maps below show the seasonal temperatures for land and sea, in order of Northern Spring Equinox, Northern Summer Solstice, Northern Autumn Equinox, and Northern Winter Solstice.
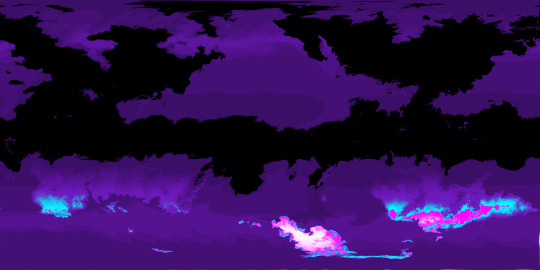
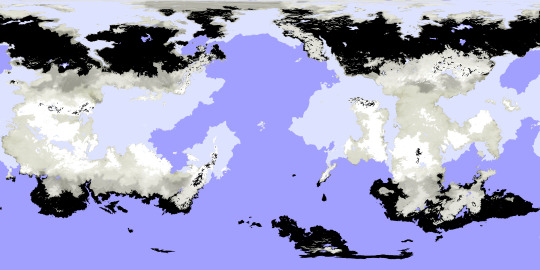
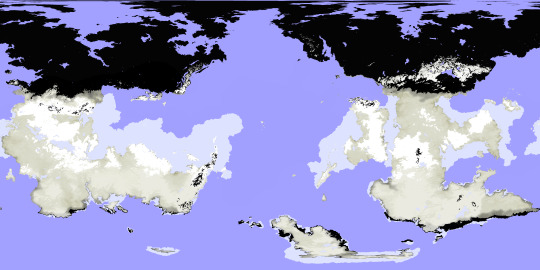
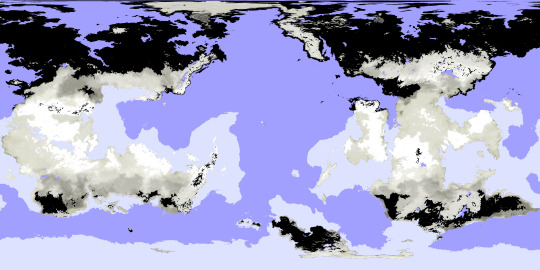
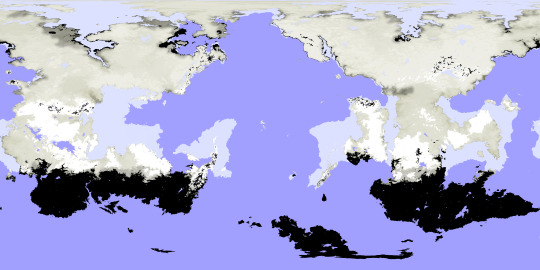
Correlating closely to the above data is the snow and ice cover, which is fairly extensive on this planet owing to its high obliquity and distance from its star. Land ice only occurs where the snow falls and is compacted year-round, but snow and sea ice can be much more seasonal.
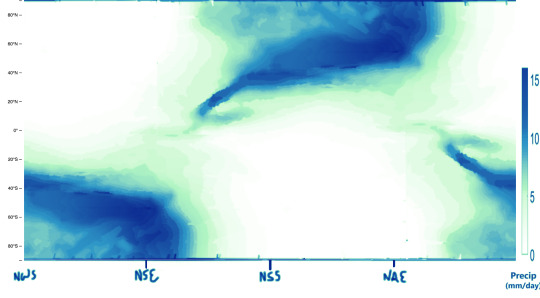
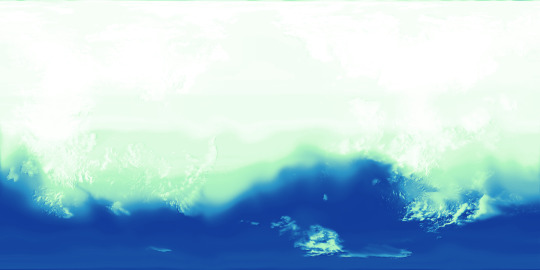
Seasonal precipitation levels were another important phase of this project, and the below diagram shows those levels for a given latitude (y-axis) on a given date (x-axis), with a key attached.
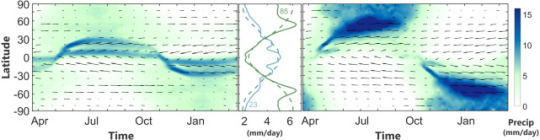
My reference for creating the above graphic is the figure below, which comes from a 2019 paper by A.H. Lobo and S. Bordoni titled “Atmospheric Dynamics of High Obliquity Planets”, and shows Earth’s precipitation levels compared to those of a planet with an 85° obliquity.
The following maps can now be better understood in light of these diagrams and keys.
-Northern Spring Equinox
-Northern Summer Solstice

-Northern Autumn Equinox

-Northern Winter Solstice
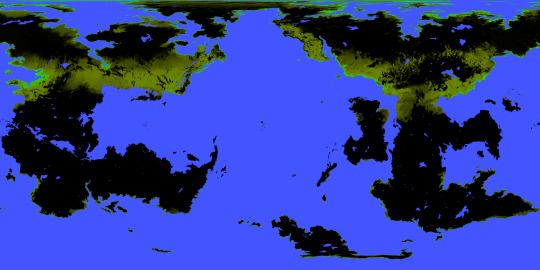
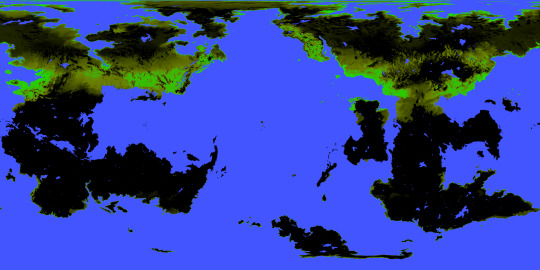
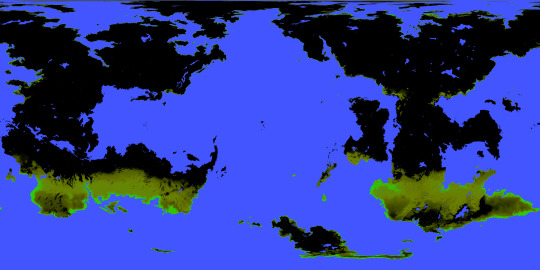
I was also tasked with mapping out the extent and density of this planet’s vegetation (or at least its alien equivalent), and from this you can see how wildly it varies by season, with very few year-round holdings. Precipitation is a major factor in where it is possible for plants to flourish, but snow cover and the extreme temperature swings limit it too. Near either pole, for example, within the space of a year temperatures soar far above Earth’s upper limits and also plummet below freezing; if either extreme were to be the annual norm for a region, some plants might adapt to those conditions, but because of the wild fluctuation any adaptations to one extreme would leave plants especially vulnerable to the other. These regions, then, remain barren regardless of rainfall or brief windows of mild temperatures, while areas with less wide temperature ranges allow for at least brief periods of flourishing.

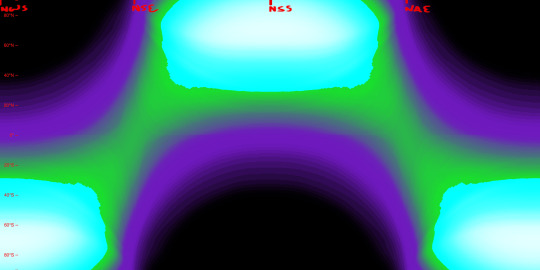
Determining the surface temperatures for this planet required a lot of background work. The first piece of the puzzle for this was knowing the number of daily hours of sunlight for a given latitude and date, which is exemplified first in this diagram for Earth:
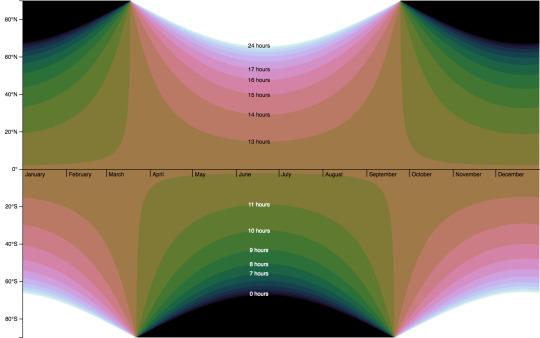
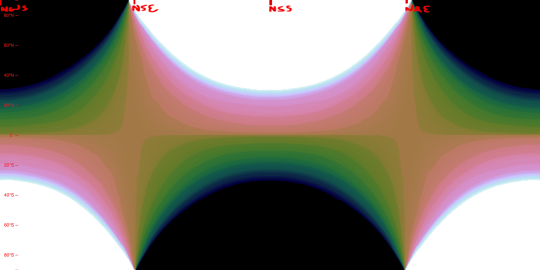
and then for the Birdbug planet, below. Since this planet rotates on an axis of 60 degrees, there are many more latitudes within range of either pole that experience periods of sunlight and darkness lasting longer than a day. The higher the latitude, the longer this period lasts, with the poles themselves experiencing either condition for half a year at a time.
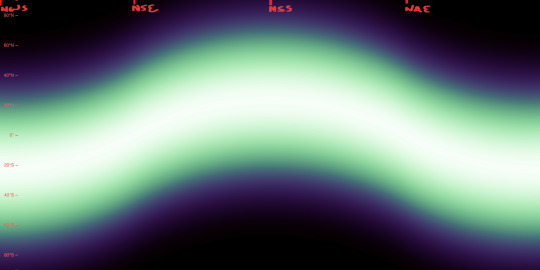
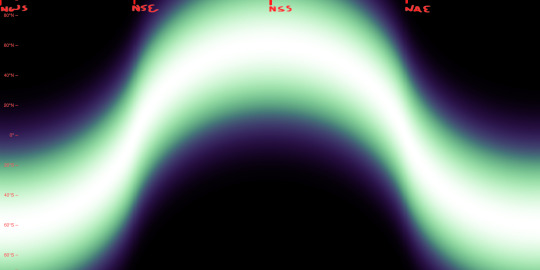
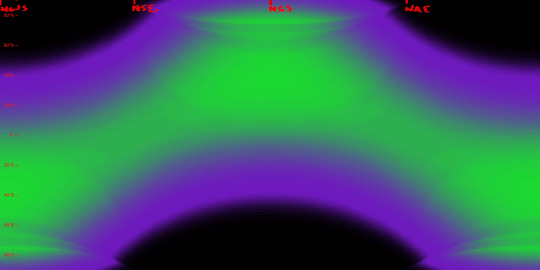
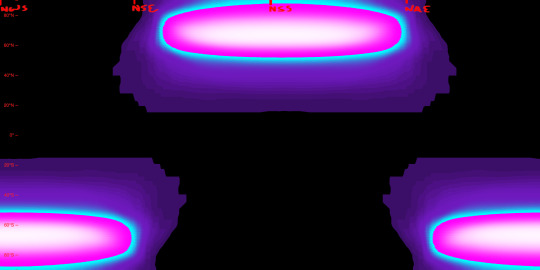
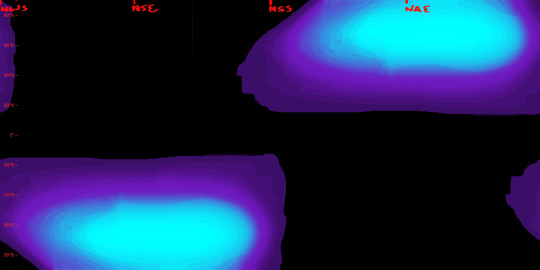
Another important factor is the height to which the sun is seen to rise (more scientifically, the angle at which the sun’s light hits parts of the planet’s surface), seen here first for Earth and then for the Birdbug planet. In these diagrams, white represents the sun reaching the zenith of the sky (meeting the surface at a 90° angle), and black represents the sun failing to appear above the horizon (meeting at an angle of 0° or below), while shades of green and purple stand in for angles between those extremes. For Earth and the Birdbug planet alike, the sun reaches the zenith within the bounds of either planet’s Tropic circles of latitude, and fails to rise at all only within the Polar circles of latitude; the difference in obliquity means that the Birdbug planet’s key circles of latitude are flipped compared to Earth’s.
The duration of sunlight and the angle at which that sunlight is reaches the planet’s surface determine a planet’s Insolation, that is, the amount of solar energy it receives. The first image below is a preexisting diagram of Earth’s Insolation, where it is measured in watts per square meter. The next two images are my own attempts at replicating this data for Earth, and then for the Birdbug planet.
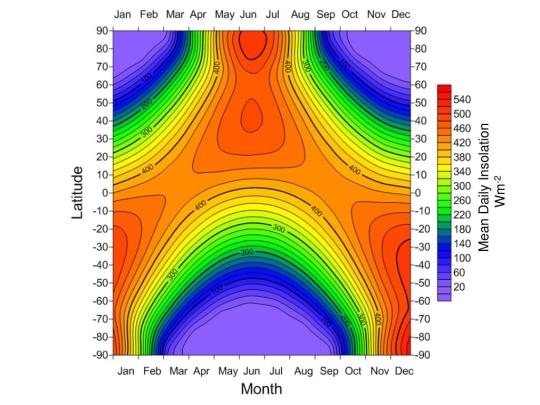
As seen in the diagrams above, Insolation on the Birdbug planet differs from Earth not only in its latitudinal distribution, but also in its sheer intensity at the higher latitudes. Compared to Earth there are twice as many latitudes for which the sun is shining longer than one rotational period, and many of those latitudes see the sun shine at a direct or nearly direct angle, whereas the Polar circles of latitude on Earth see the sun shine much more obliquely.
Below, we can see the data that all the above figures were instrumental in finding: that is, surface temperatures. The first image is a preexisting figure that measures Earth’s mean surface temperatures by date and latitude, and below that is my attempt at replicating the data by my own process.
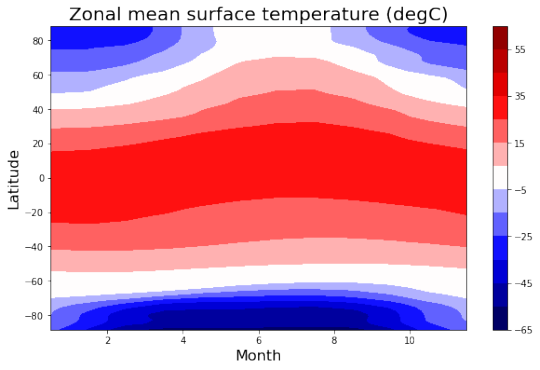
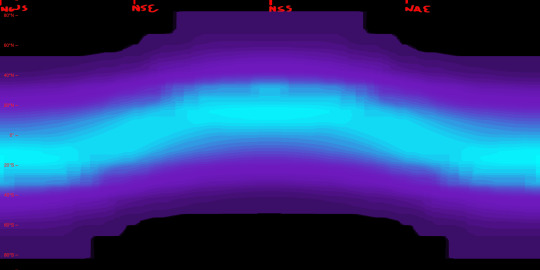
This is done not by just copying the seasonal Insolation data, but by also factoring in the yearly average for each latitude.
Above, we see the temperatures of the land by date and latitude, and below, we see the temperatures at the surface of the sea, which lag behind the land temperatures and remain comparatively mild.
Lastly, here’s an image I created to combine the snow and ice cover as well as the vegetation extent and density, as of the Northern Spring Equinox. This, along with the elevation map also seen here, is what I uploaded to maptoglobe.com in order to produce the screenshot at the top of this post.
These maps and figures (except for the preexisting ones) were all created in Photopea. Higher resolution versions of many of these images can be seen in my dedicated Reddit posts, linked below:
reddit post one, reddit post two
2022
#mapmaking#imaginary maps#worldbuilding#major project#imaginary planetology#elevation#waterways#river systems#surface temperatures#ice and snow cover#sea ice#precipitation#vegetation#Insolation#high obliquity planets#explanatory diagrams#digital rendering#Photopea#Birdbug worldbuilding project#Birgs#Birgworld#2022#digital painting#extremely long post#Christopher Maida Artwork
616 notes
·
View notes
Photo


Brinicle: Ice Finger of Death
A brinicle is a downward-growing hollow tube of ice enclosing a plume of sinking brine that is formed beneath developing sea ice.
857 notes
·
View notes
Text
Summer sea ice in the Arctic could melt almost completely by the 2030s—roughly a decade earlier than projected—even if humans cut back drastically on greenhouse gas emissions, new research suggests.
“We are very quickly about to lose the Arctic summer sea-ice cover, basically independent of what we are doing,” Dirk Notz, a climate scientist at the University of Hamburg in Germany tells the New York Times’ Raymond Zhong. “We’ve been waiting too long now to do something about climate change to still protect the remaining ice.”
An ice-free summer, also called a “blue ocean event,” will happen when the sea ice drops below one million square kilometers (386,102 square miles), writes Jonathan Bamber, a professor of physical geography at the University of Bristol, in the Conversation. This equates to just 15 percent of the Arctic’s seasonal minimum ice cover of the late 1970s, per the Times.
Previous assessments using models have estimated an ice-free summer under high and intermediate emissions scenarios by 2050. But researchers noticed differences between what climate models predicted about what would happen to sea ice and what they've actually seen through observations, according to Bob Weber of the Canadian Press. "The models, on average, underestimate sea ice decline compared with observations," says Nathan Gillett, an environment and climate change Canada scientist, to Weber.
Now, in a new study published in Nature Communications, Notz, Gillett and their colleagues tweaked these models to more closely fit satellite data collected over the past 40 years. Using these modified models, the researchers projected ice changes under different possible levels of greenhouse gas emissions. Their paper suggests that regardless of emissions scenario, “we may experience an unprecedented ice-free Arctic climate in the next decade or two.” Under a high emissions scenario, the Arctic could see a sustained loss of sea ice from August until as late as October before the 2080s, lead author Seung-Ki Min, a climate scientist at Pohang University of Science and Technology in South Korea, tells CNN’s Rachel Ramirez.
While sea ice naturally shrinks in the summer and refreezes during the winter, summer ice coverage has steadily been declining over the past few decades because of climate change. And Arctic ice melting accelerates itself—as ice disappears, it exposes more of the dark blue ocean, which absorbs more heat and leads to more melting. This process, known as Arctic amplification, has led to the region warming nearly four times faster than the rest of the globe since 1979.
Sea ice decline could have catastrophic consequences that extend to the rest of the planet, including sea level rise and disruption to weather patterns and ecosystems. Animals like polar bears and seals that rely on Arctic ice to survive could be placed at risk.
“It’s already happening,” Mark C. Serreze, the director of the National Snow and Ice Data Center at the University of Colorado Boulder who was not involved with the new research, tells the Times. “And as the Arctic continues to lose its ice, those impacts will grow and grow and grow.”
#current events#climate change#global warming#environmentalism#ecology#meteorology#weather#ice#sea ice#arctic circle
47 notes
·
View notes
Photo
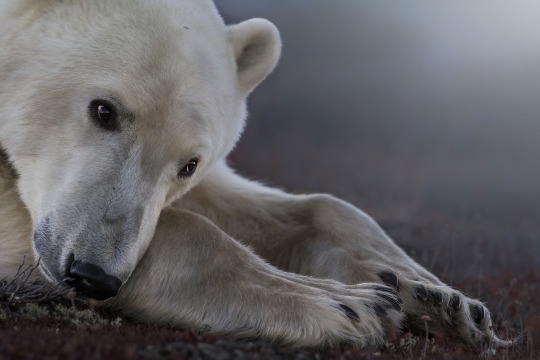
A polar bear almost seems to heave a sigh as it waits outside Churchill, Man., for sea ice to form on Hudson Bay.
Photographer: Dave Sandford
Canadian Geographic’s Canadian Photos of the Year competition
#dave sandford#photographer#canada#canadian geographics canadian photos of the year competition#polar bear#bear#animal#mammal#churchill#manitoba#sea ice#hudson bay#nature
94 notes
·
View notes
Text
Antarctic sea ice at historic low

The floating sea ice around Antarctica hit a record low for the second year in a row. Since satellites started tracking the region’s ice in 1978, there has never been less ice.
The alarm from scientists at last year's record low ice cover is now astonishment as the winter sea ice has shrunk even more. Some worry we are witnessing the collapse of Antarctica’s sea ice.
By now there should be about 16.4 million square kilometers of Antarctic sea ice. But this week, there was just 14.1 million square km: An area bigger than Mexico has failed to freeze.
more in the Guardian story: X
34 notes
·
View notes
Text
This should be on the front page of newspapers globally. But because of consistently foolish editorial judgment among major news outlets, which are incapable of discerning hugely consequential matters that unfold over lengthy period of time from flash-in-the-pan inconsequential political nonsense, it isn't.
It's Antarctic winter, a time when the area of floating sea ice around the continent should be rapidly expanding. This year though, the freeze-up has been happening in slow motion. After reaching a record low minimum extent this summer there is now an area of open ocean bigger than Greenland. If the "missing" sea ice were a country, it'd be the tenth largest in the world.
Who cares about Antarctic sea ice?
In the face of more immediate climate concerns, why does Antarctic sea ice matter?
Floating sea ice is a pivotal climate puzzle piece. Without it, global temperatures would be warmer because its bright, white surface acts like a mirror, reflecting the sun's energy back to space. This keeps the Antarctic—and by extension, the planet—cool.
Antarctic sea ice also plays a particularly important role in controlling ocean currents and may act as a buffer that protects floating ice shelves and glaciers from collapsing and adding to global sea levels.
In short, the loss of Antarctic sea ice matters for the whole planet.
Southern sea ice: A short history
Every year Antarctic sea ice undergoes a transformation: from its summer minimum in February, its area increases more than six-fold during the winter freeze-up which reaches its height in September. A clear way to monitor the health of Antarctic sea ice is to track these peaks and troughs.
Records began in 1979 and until 2015, the yearly average extent of frozen sea around Antarctica was increasing ever so slightly. Yet in the past seven years, Antarctic sea ice has changed dramatically.
https://phys-org.cdn.ampproject.org/.../2023-08...
15 notes
·
View notes
Text
'Alarming drop off the cliff': Record low Antarctic sea ice triggers eme...
youtube
#climate change#climate crisis#climate#climate emergency#climate action#new zealand#nz#world news#politics#aotearoa#antarctica#sea ice#global warming#sea level rise#warming oceans#climate catastrophe#environment#Youtube
7 notes
·
View notes
Text
7 notes
·
View notes
Text
7 notes
·
View notes
Text
15 notes
·
View notes
Link
Recent years have seen temperatures far above average recorded in the Arctic, with seasoned observers describing the situation as “crazy”, “weird”, and “simply shocking”. Some climate scientists have warned the unprecedented events could signal faster and more abrupt climate breakdown.
66 notes
·
View notes
Last Seen Blogs

lucifers-paramour
I AM THE NUGGET KING

julmolina
345

shutterafterdark
SHUTTER AFTER DARK

lilithism1848
Lilithism

hike4ass
Untitled